In an April 10 post on the Klamath Chinook salmon run, I discussed an expected record low run in 2017. The Klamath run has six subcomponent runs, including the Scott River. Improving the Scott River run is one means of improving the Klamath run.
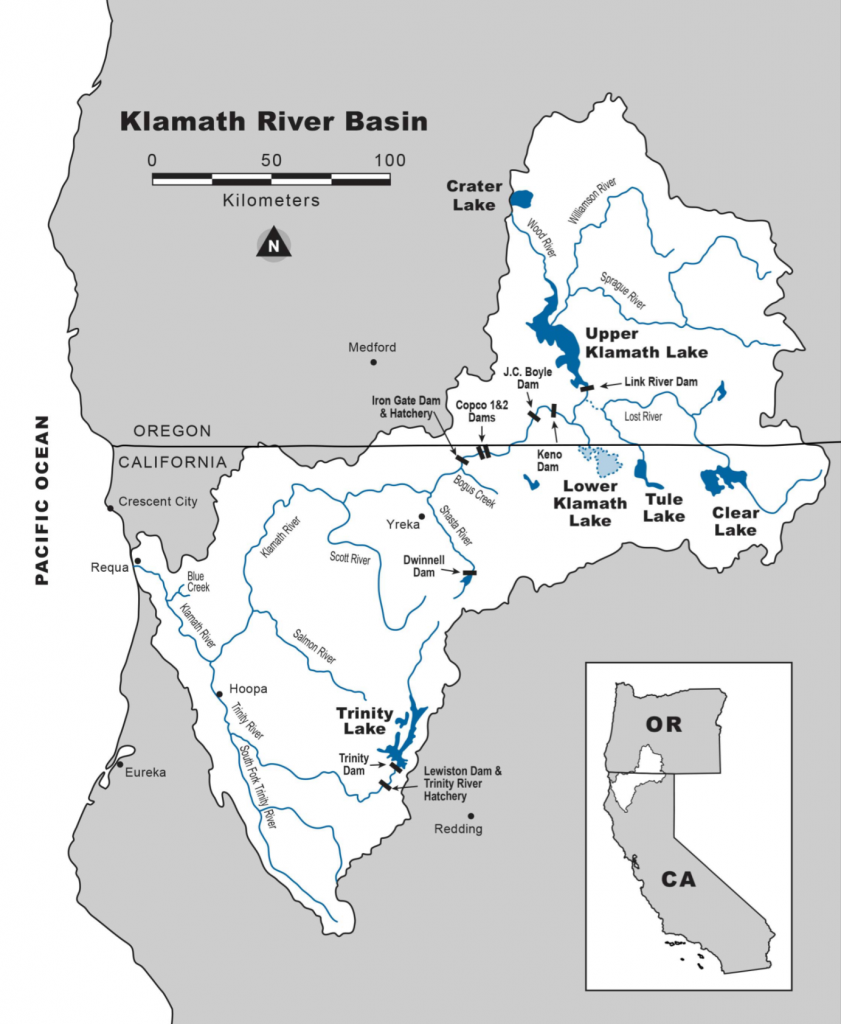
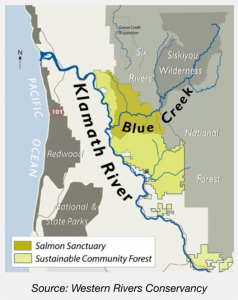
Like the adjacent Shasta and Salmon Rivers, the Scott is a unique ecological gem, sitting high in the Marble and Trinity mountains before plunging north down the volcanic escarpment into the Klamath River canyon (Figure 1). Like the Shasta River, the Scott flows through a mountain rimmed glacial valley not unlike those in the North American Rockies or European Alps. Scott Valley is one of those “beautiful places.” It is also one of the last great places for salmon and steelhead in California. Unlike the Shasta River whose flow is supported by large volcanic springs from Mt. Shasta, the Scott depends on snowmelt from the Marbles and Trinities, as well as on springs from its alluvial valley.

Figure 1. The Scott River Valley in northern California west of Yreka, CA (Yreka is located in the Shasta River Valley). The Scott and Shasta Rivers flow north into the Klamath River, which runs west to the ocean. The Salmon River watershed is immediately west of the Scott River watershed. The upper Trinity River watershed is immediately to the south of the Scott River watershed.
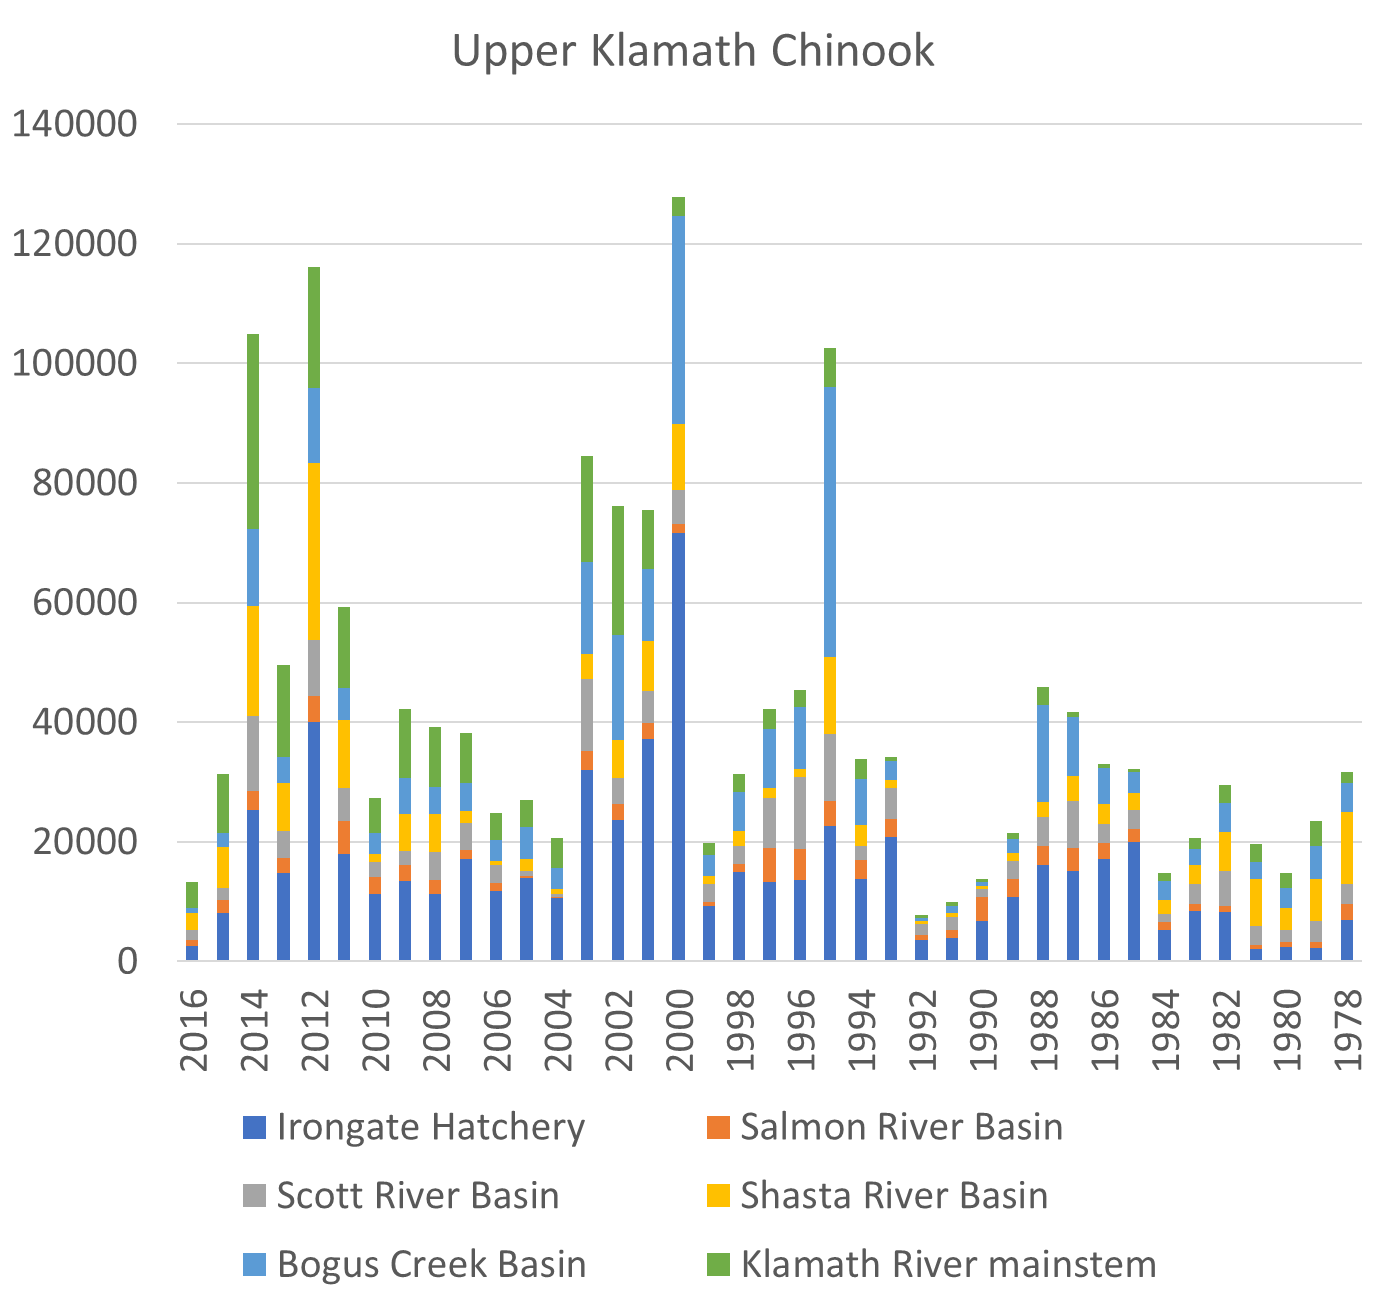
The Scott River is home to wild runs of Chinook salmon, Coho salmon, and steelhead trout that make up significant components of the Klamath River runs of these species. In this post I address the Scott River fall-run Chinook salmon. The California Department of Fish and Wildlife has estimated the annual run size since 1978 (Figure 2).
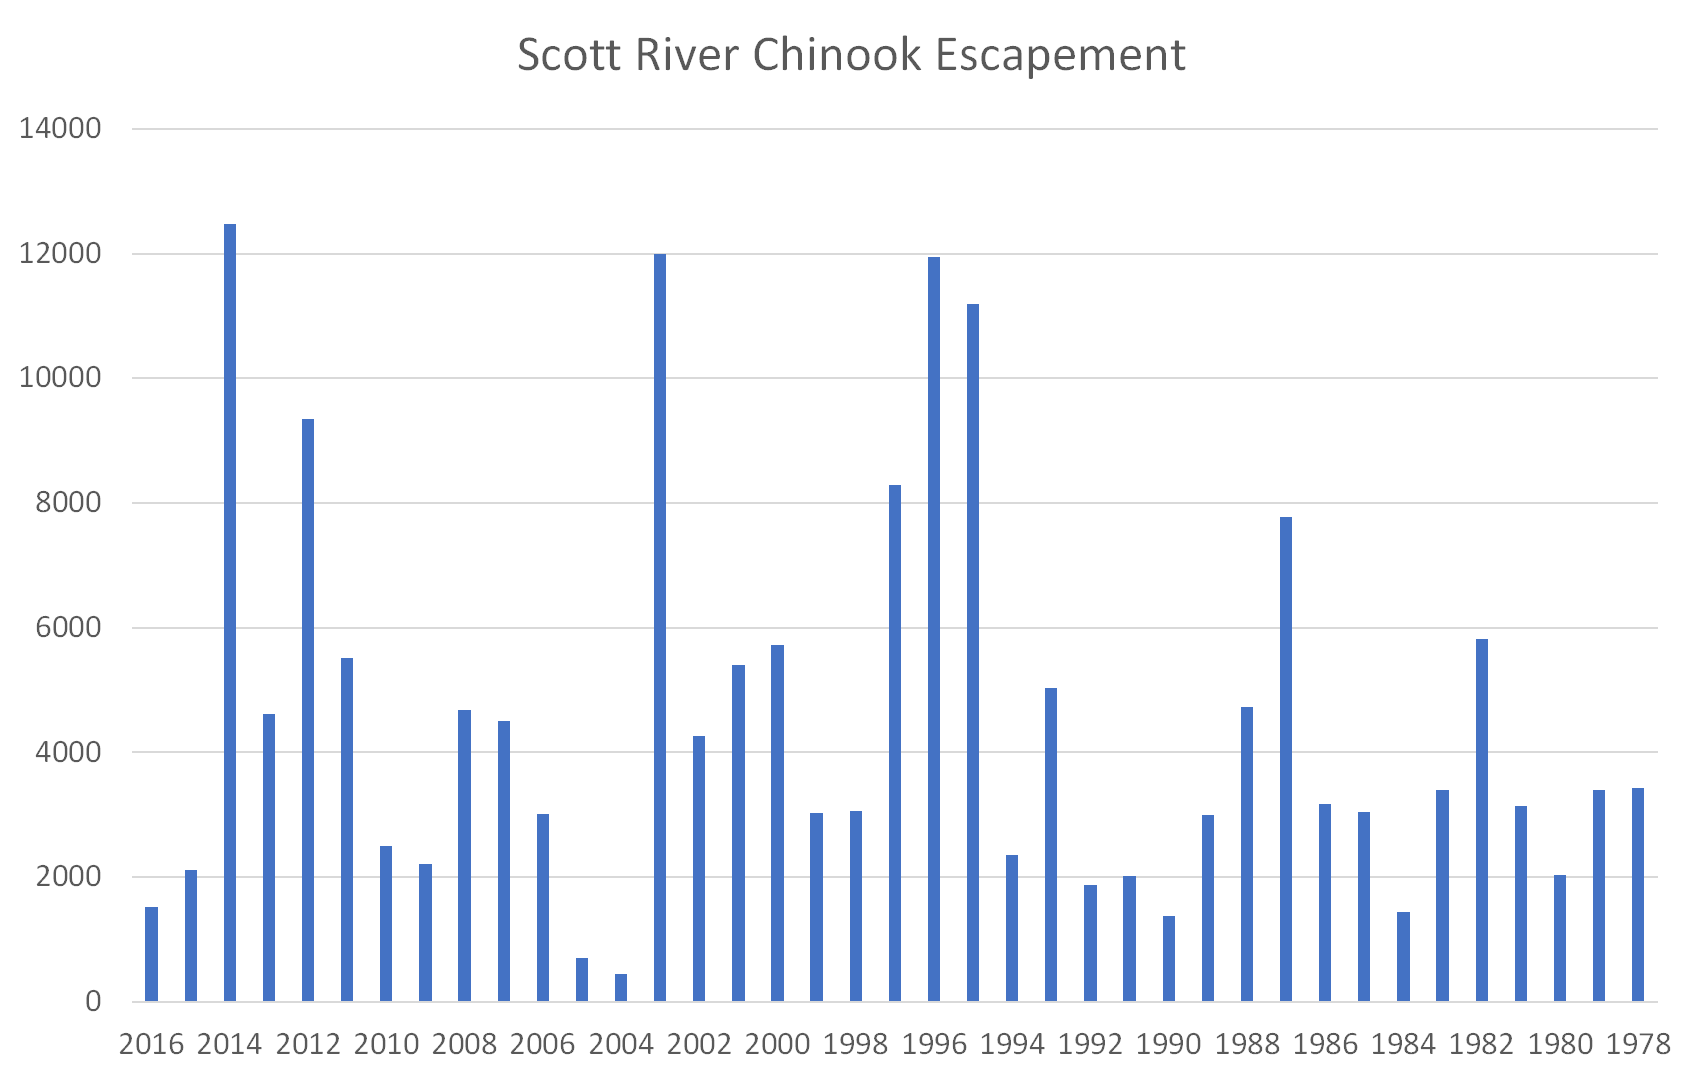
Figure 2. Escapement of adult fall-run Chinook salmon to the Scott River from 1978 to 2016. Data source: CDFW GrandTab.
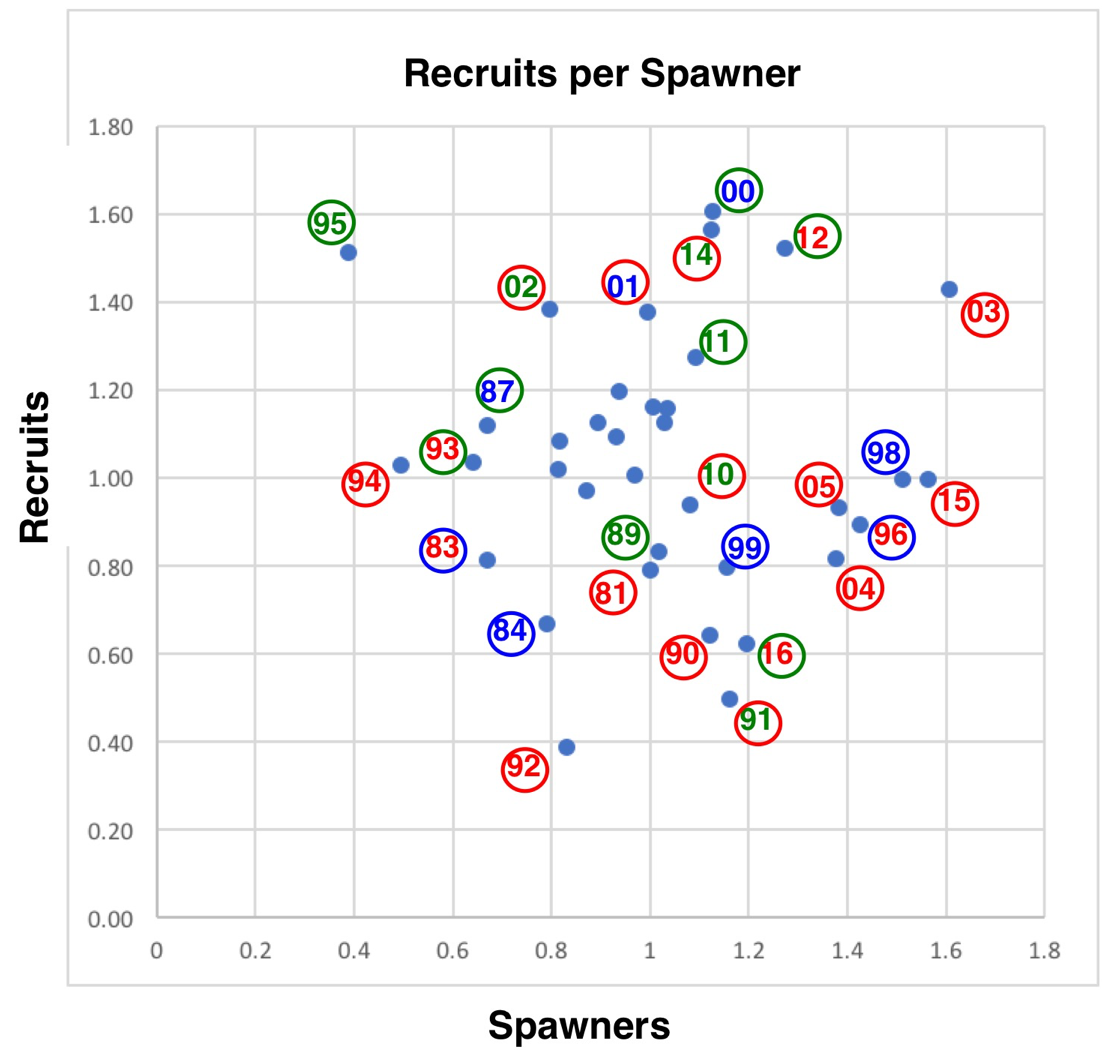
The run size, or “escapement” in fisheries science vernacular, is a consequence of the previous number of spawners; their success; survival of eggs, embryos, fry, and smolts in rivers; survival for up to several years in the ocean; and finally, the success of adults migrating back from the ocean to river spawning grounds. There is a lot that can happen at each of these life stages that may affect the ultimate escapement. I show the effect of several key factors in Figure 3, which starts from the escapement numbers in Figure 2 and shows the recruits-per-spawner relationship.
I hypothesized the following from the Figure 3 recruits-per-spawner relationship:
- Recruits-per-spawner is generally higher for wet (blue) rearing conditions – the winter/spring conditions of the year that followed the spawning or brood year. Note that smolts generally reach the ocean by their first summer, so conditions early in their rearing year likely affect survival prior to entering the ocean. Survival may be affected by the rearing conditions in the Scott River and/or those downstream in the Klamath River. Low late-winter and spring flows affect river rearing survival as well as the overall survival during emigration to the ocean. Ocean survival can be a consequence of success during river rearing or emigration: of the smolts that reach the ocean, larger healthier smolts generally survive better in the ocean.
- Recruits-per-spawner is generally lower as a consequence of dry conditions during the spawning run (red circle years have lower recruits-per-spawner). The lower Klamath River die-off of adult salmon in 2002 was an example of dry year mortality during the spawning migration.
- Recruits-per-spawner may be depressed in very wet rearing years when floods disturb spawning beds of salmon. An example is 1999. The number of recruits was depressed by the 1997 New Years flood, which affected the fall 1996 spawn. Similarly, floods in winter 1982, 1983, 1996, 1998, and 2006 may have reduced survival and run size in 1984, 1985, 1998, 2000, and 2008.
- The number of spawners three years earlier has little or no apparent effect on the number of recruits (at least at these levels of spawners). For example: recruits in 2007 and 2008 were relatively high despite low number of spawners three years earlier.
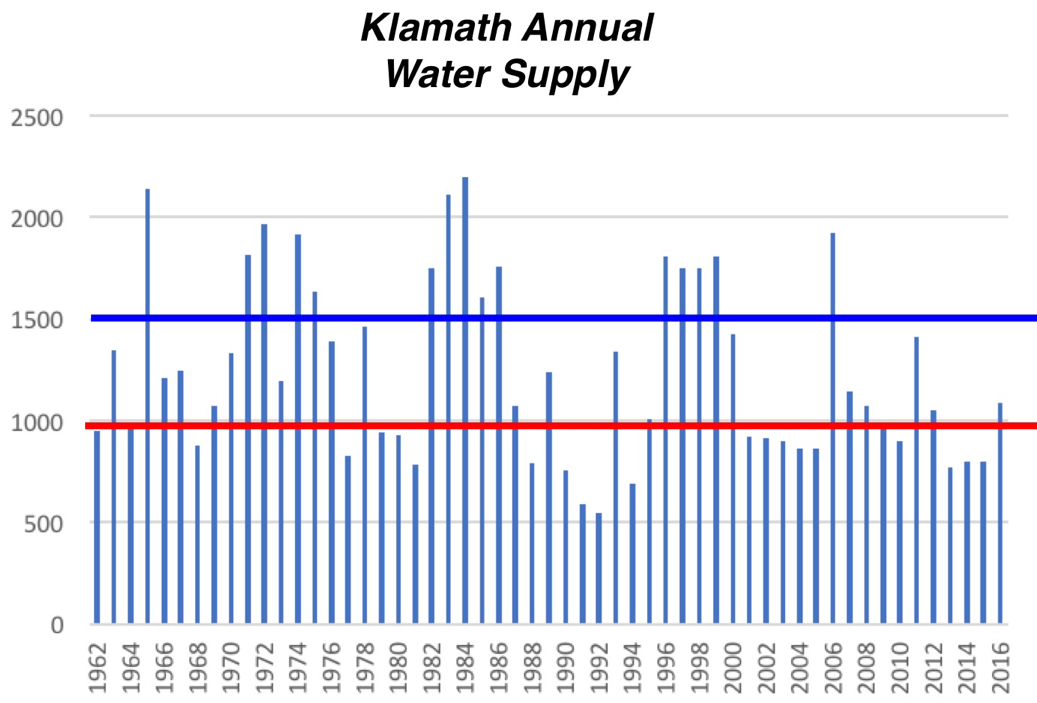
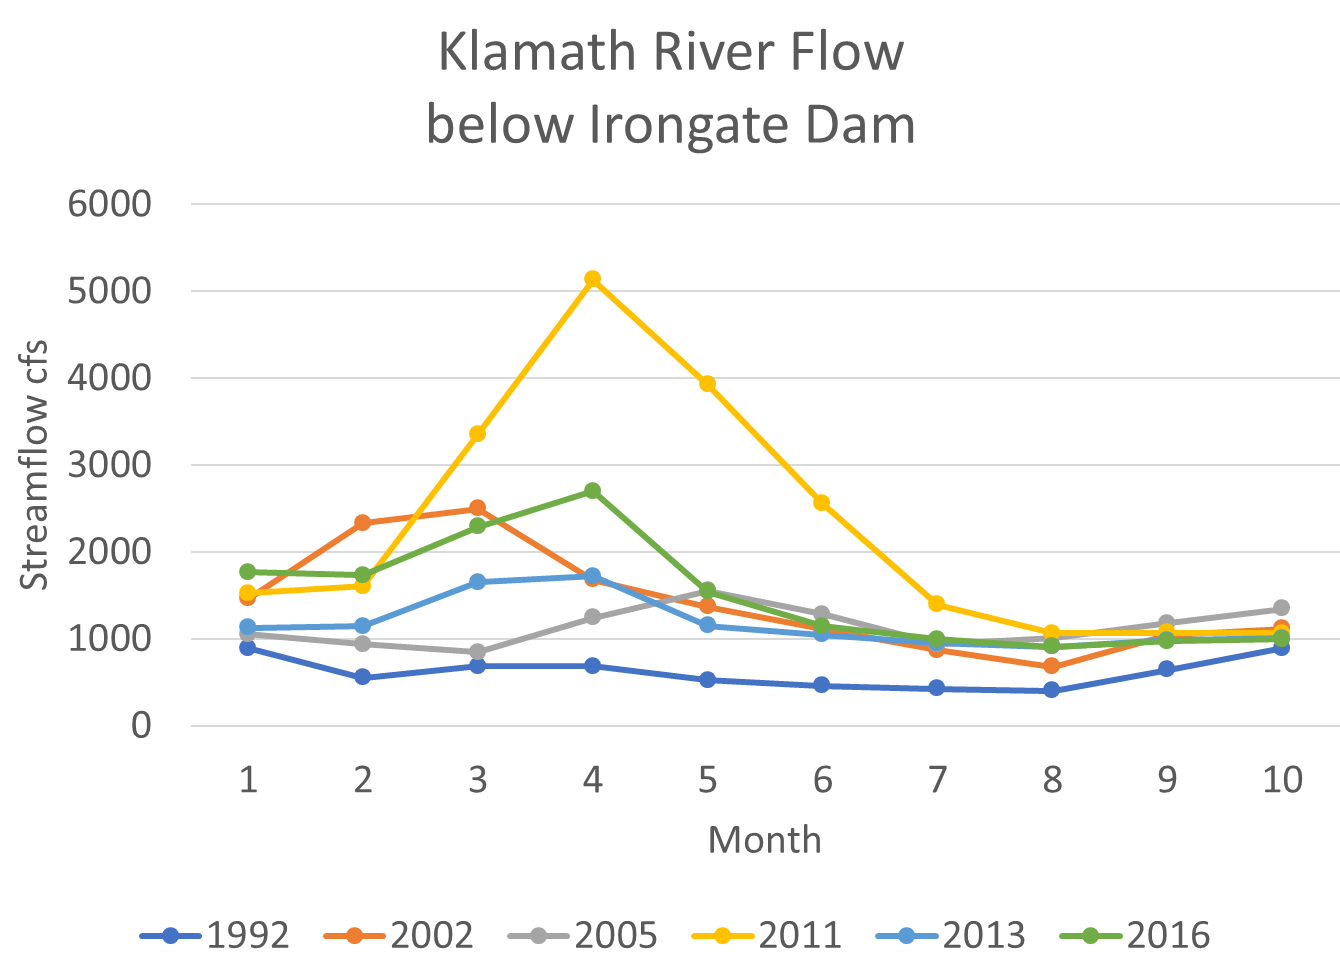
I derived the wet or dry water year designations using Figure 4. I derived the wet or dry August-September streamflow designations for the spawning run from the average monthly Scott River streamflow for those months and years (Figure 5 shows a sample range of years). Note that there is not a lot of difference among years in the August-October flows – they are all relatively low. That is because by August, the snow-melt season is over and base flows are occurring from springs and hay-field and pasture runoff or seepage.
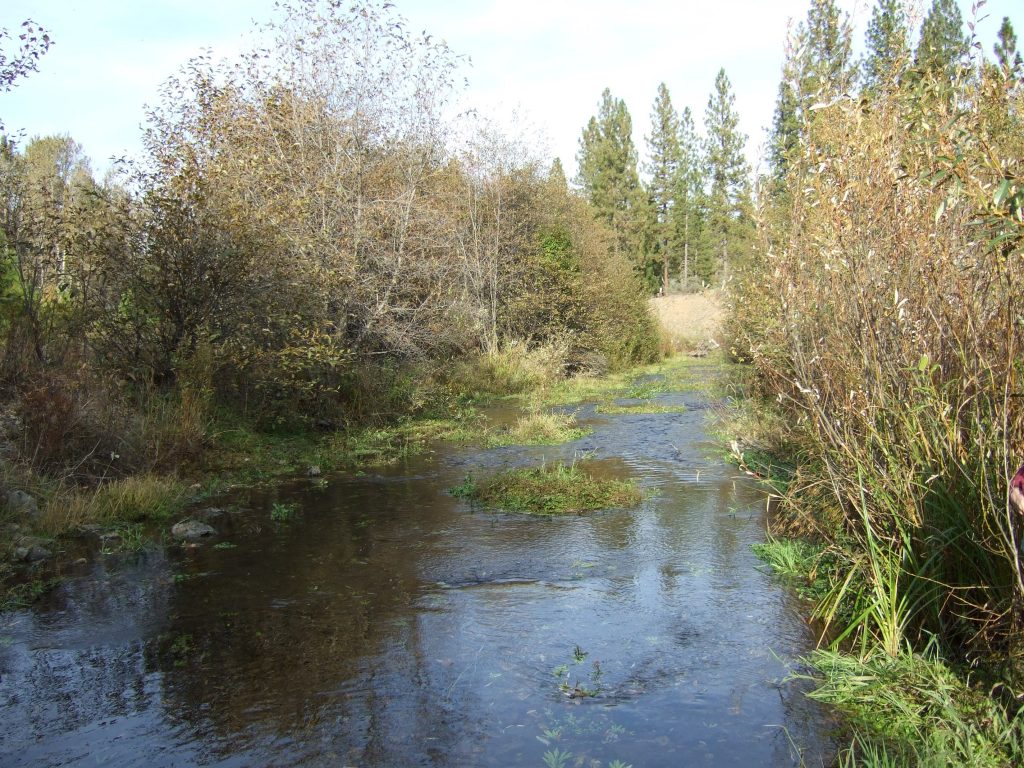
There is also the negative effect on flows from wells and surface diversions, the predominate forms of irrigation in Scott Valley. In the drier years the late summer and early fall river flows exiting the Valley below Ft. Jones can be extremely low (less than 10 cfs – see Figure 5) because of extensive well use, driven by lower available surface water. Low late summer and early fall flows can block salmon from entering the river for several months (Figure 6). This results in loss of stored energy, lower egg viability, and high pre-spawn mortality. It also results in delayed spawning, increasing the likelihood that salmon will spawn in the lower sections of the Scott River, where there is poor spawning and rearing habitat. Low flows in the river upstream can further hinder migration and access to prime spawning tributaries (Figure 7).
It takes about 100 cfs or higher to provide full access to the upper river’s spawning areas. In most years, flows are too low to provide good access. The Scott River Water Trust purchases irrigation water in some years to help the salmon migration. In most years, the river’s baseflows increase soon after the irrigation draw on groundwater ends in late October, allowing unhindered migration.
Part of the solution to the problem of low flows during the spawning run is to cease irrigation earlier. Hay irrigators generally cease pumping water by October 1, and some say there is minimal benefit of irrigating after August. Ranchers often irrigate pastures into November, if only for stock watering. Because many wells are not operated after August, idle wells have sufficient total capacity to readily keep the river watered after September 1 to pump groundwater directly into the river (ranchers would consider this if the costs of pumping were covered). I believe the effect of the extra pumping on groundwater levels would be minimal, because the Valley aquifer recovers from well pumping over the winter-spring recharge season.
Survival during the late winter-early spring rearing and emigration period could be enhanced in drier years by limiting early spring irrigation use and using selected idle wells prior to the irrigation season to add water directly to the river.
In summary, the Scott Chinook fall-run is reduced in dry years when spawning and rearing success are compromised by low river flows in the Scott and Klamath Rivers. The Scott River Chinook salmon population would likely benefit from (1) improved late-summer and early-fall flows that would improve access of spawners to upriver and tributary spawning grounds, and (2) higher river flows in drier years during the late–winter and early-spring rearing and emigration period. A record low run is expected in fall 2017 because of low fall and spring flows in 2015, which limited the survival of the juveniles from the 2014 run.
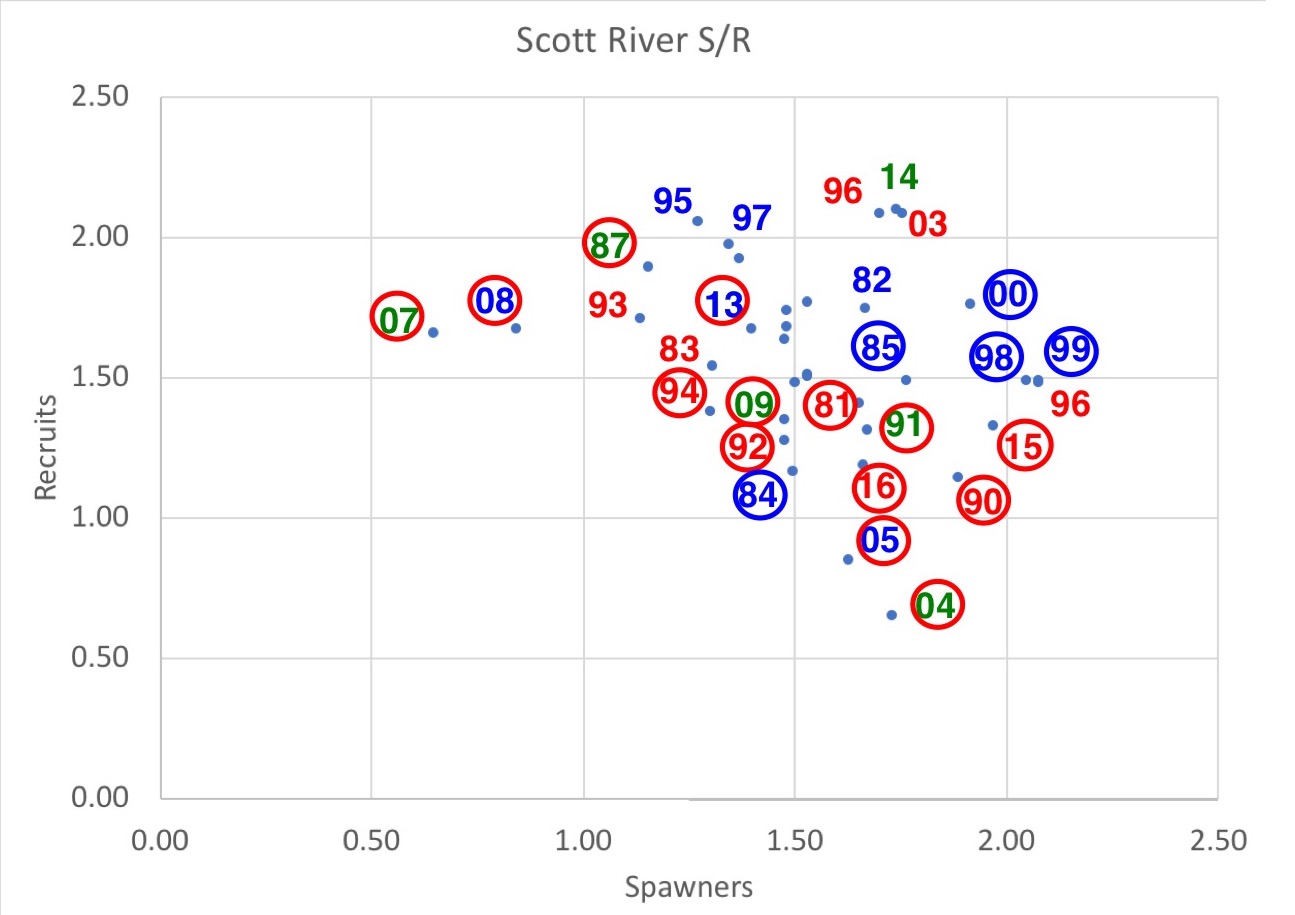
Figure 3. The recruit-per-spawner relationship for the Scott River fall-run Chinook salmon from 1978 to 2016. Escapement by year (recruits) is plotted against escapement three years earlier (spawners). The escapement values plotted are transformed (Log10X-2). The number shown is the escapement year or recruit year – the year the run was tallied. Number color denotes rearing year water supply type – two years prior to recruit year. Red is dry. Green is average. Blue is wet. Circle represents escapement year water supply during the spawning run (August-September). For example: “04” is run size in fall 2004, which had an average winter-spring rearing year (water year 2002) and dry conditions during the late summer run in 2004 (red circle).

Figure 4. Water years (10/1-9/30) 1978-2016 average annual flow in Scott River measured at Ft. Jones gage. Source: USGS. I designated years above the blue line as wet years, years below the red line as dry years, and years between the lines as average years.
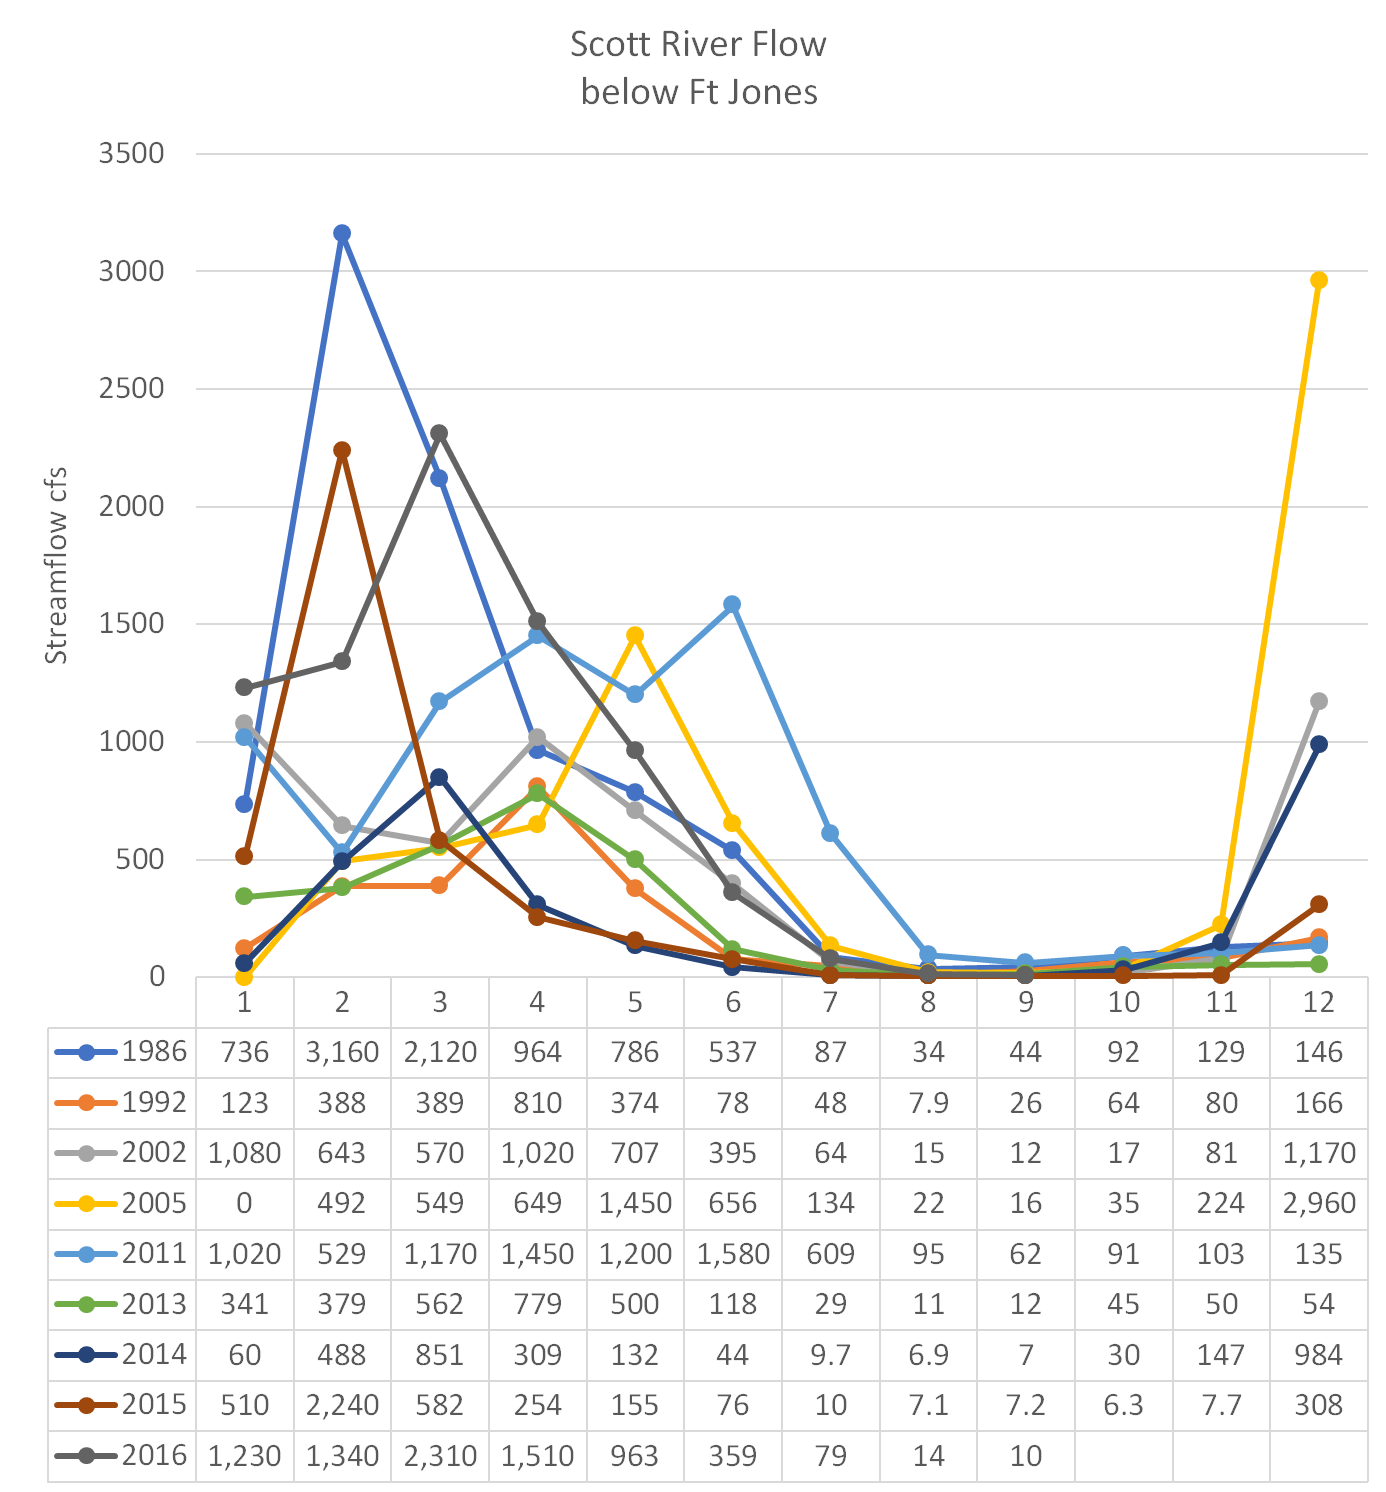
Figure 5. Scott River average monthly flow (cfs) below Ft. Jones for selected years. Source: USGS.
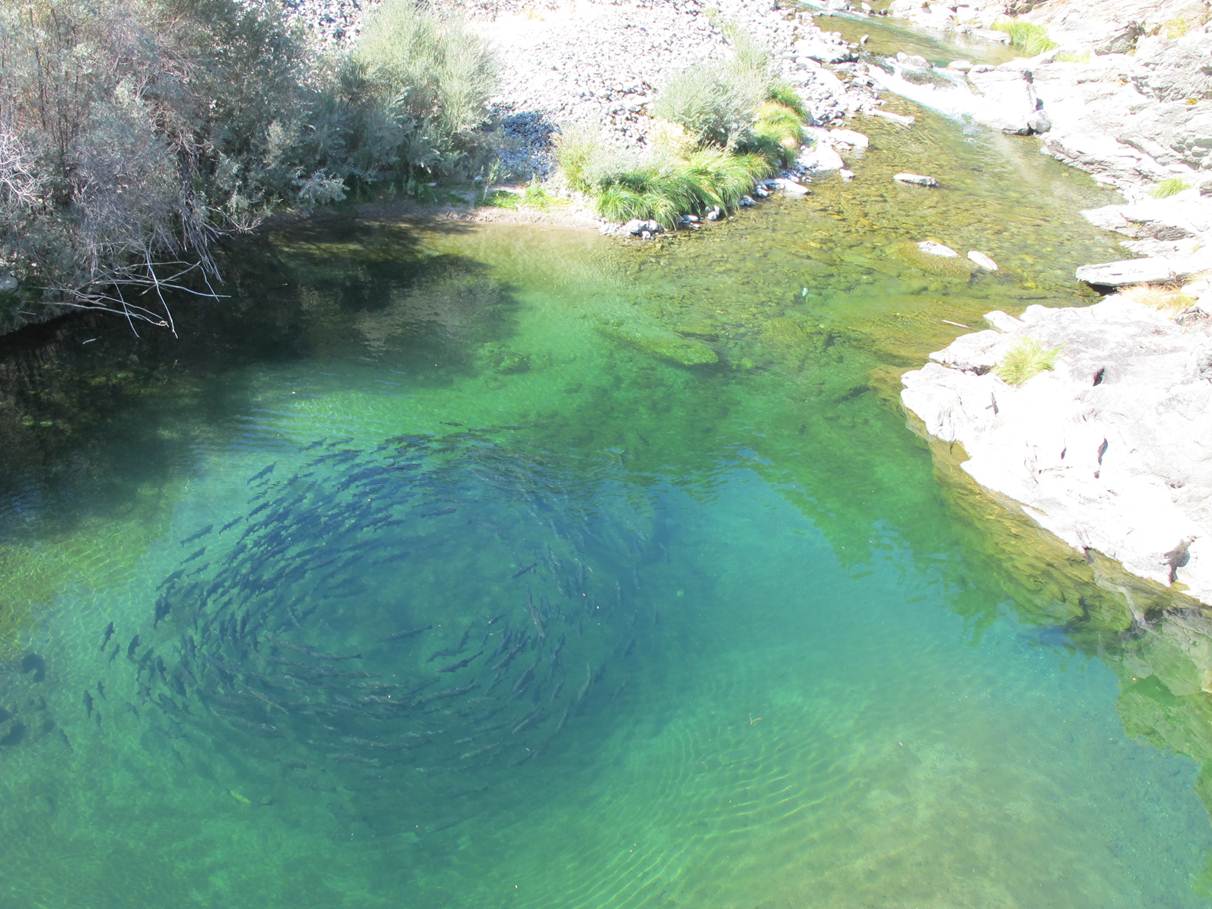
Figure 6. Adult fall-run Chinook salmon waiting at the mouth of the Scott River in the Klamath River in late summer for flows to improve before attempting to migrate up the Scott River to their spawning grounds.
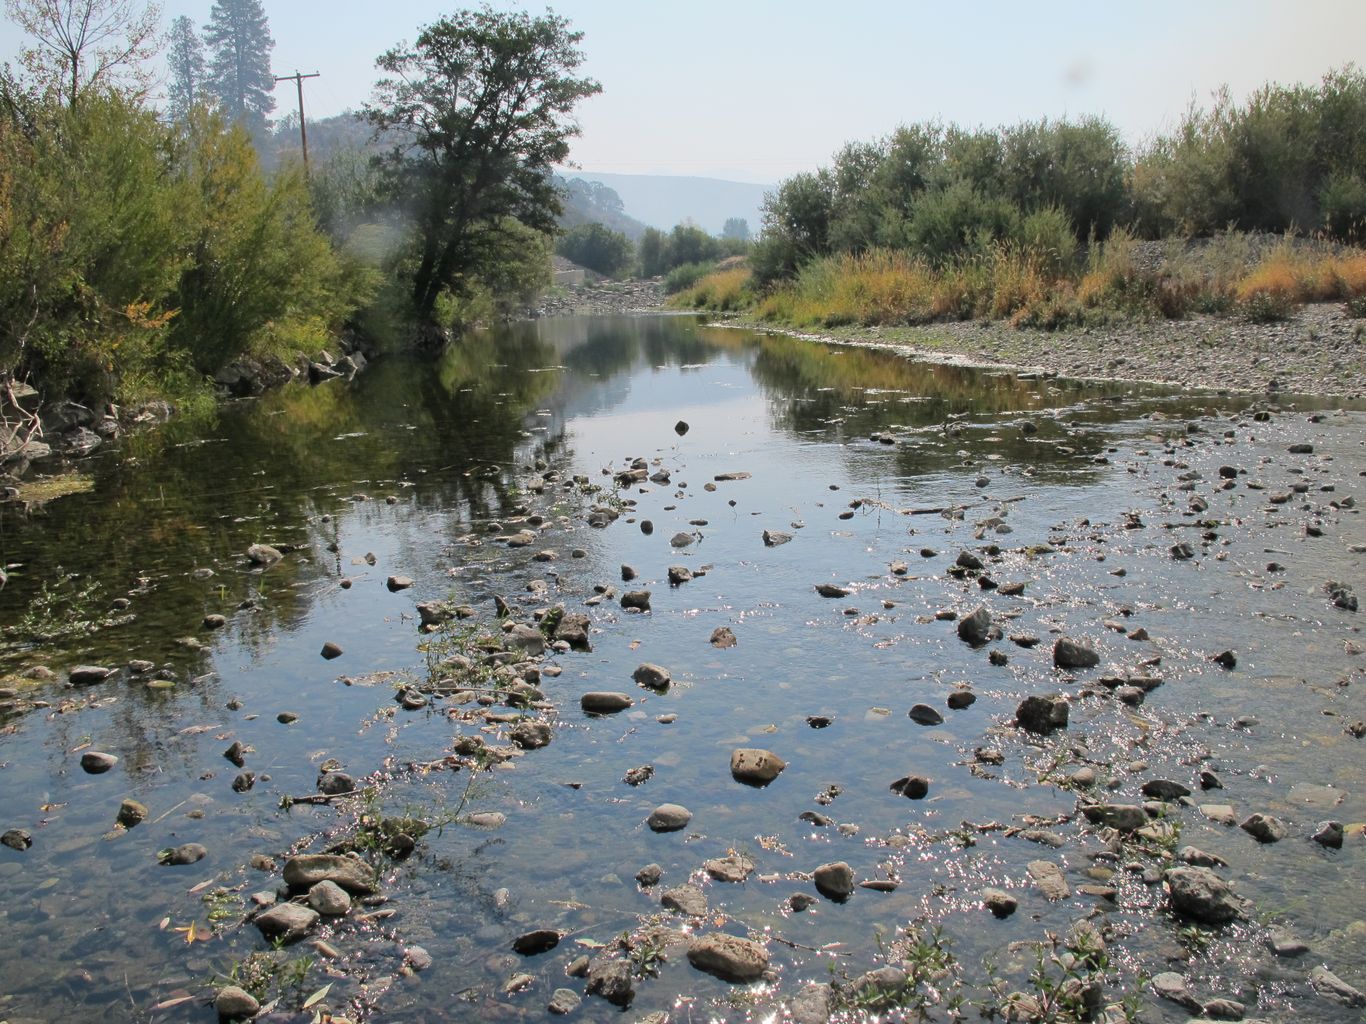
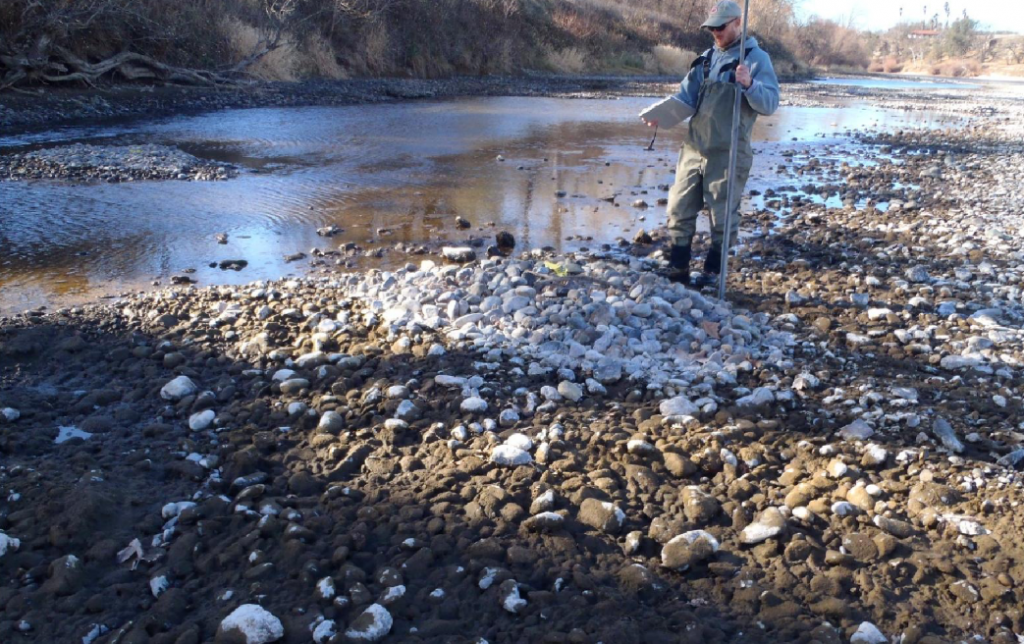
Figure 7. Trickle of flow in the mainstem Scott River in Scott Valley during late summer below Young’s Dam irrigation diversion near Etna, CA. The dam can be seen in the distance at upper center of photo. The fish ladder at the dam is not functional at such low flows. The dam is located approximately 50 river-miles upstream from the river mouth. There is approximately 20 miles of additional Chinook salmon spawning habitat upstream of Young’s Dam.
 To get the process moving faster, I offer the following recommendations: