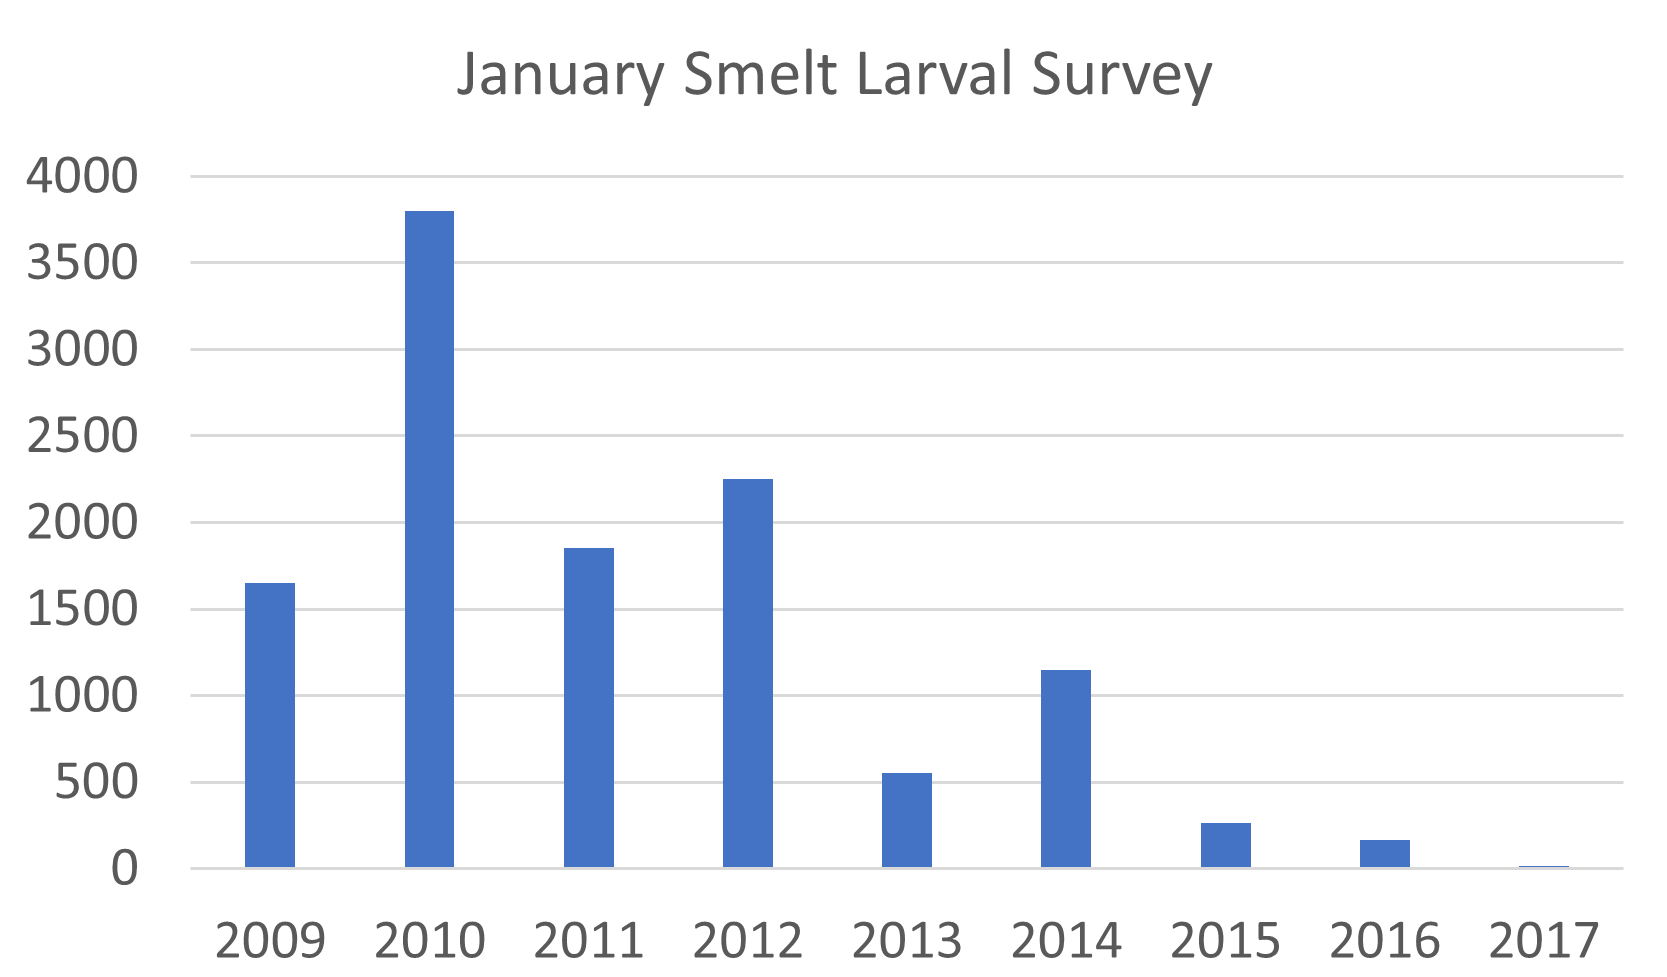
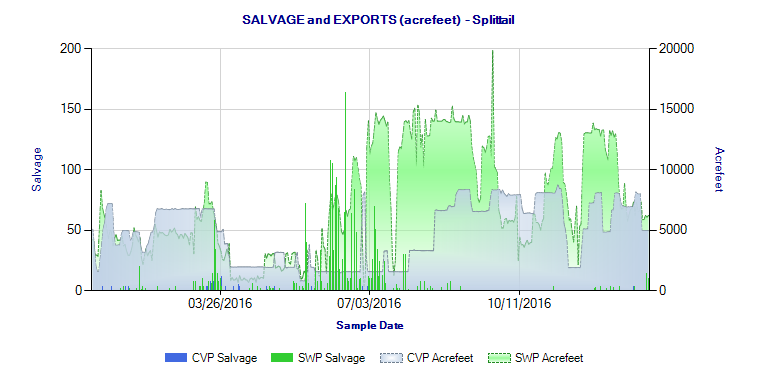
The last post about risk to Delta smelt was on January 9. Adult smelt migrate into the Delta from the Bay in winter to spawn. They take advantage of the flood tide to move upstream. However, with flood flows as high as 100,000 cfs entering the north Delta from the Sacramento River, the Yolo Bypass, and Georgiana Slough in mid- to late January 2017, there are no flood tides to ride into the north Delta spawning areas.
The only option for the adult smelt is thus to ride the incoming tide up the San Joaquin River into the central and south Delta (Figure 1). South Delta export pumping is currently at 14,000 cfs, near maximum capacity, using four rarely used auxiliary pumps. This pumping increases the pull of the incoming tide, reducing the effect of the inflow from the San Joaquin, Calaveras, Mokelumne, and Cosumnes rivers. While Delta inflow from these rivers is relatively high (Figures 2-5), it does not offset the influence of the incoming tide as does the inflow from the Sacramento.
Net tidal flows in lower Old and Middle Rivers (OMR flows) remain at the allowed limit of -5000 cfs, consistent with the smelt Biological Opinion. Several adult Delta smelt were salvaged at the export facilities in mid-January. This scenario is considered a “high risk” to Delta smelt by the Smelt Working Group, because of the continuing risk that the pumps will draw or attract adult smelt into the central Delta and subsequently into the south Delta.
Under lower San Joaquin River flows, the maximum allowed export pumping is 11,400 cfs. High San Joaquin River inflow allows exports of 14,000 cfs that do not generate OMR flows more negative than -5000 cfs. The theoretical benefit of high San Joaquin River flows is that it should keep flow into the central and south Delta moving westward. But a large portion of that inflow is diverted south into the Head of Old River toward the pumping plants (Figure 6).
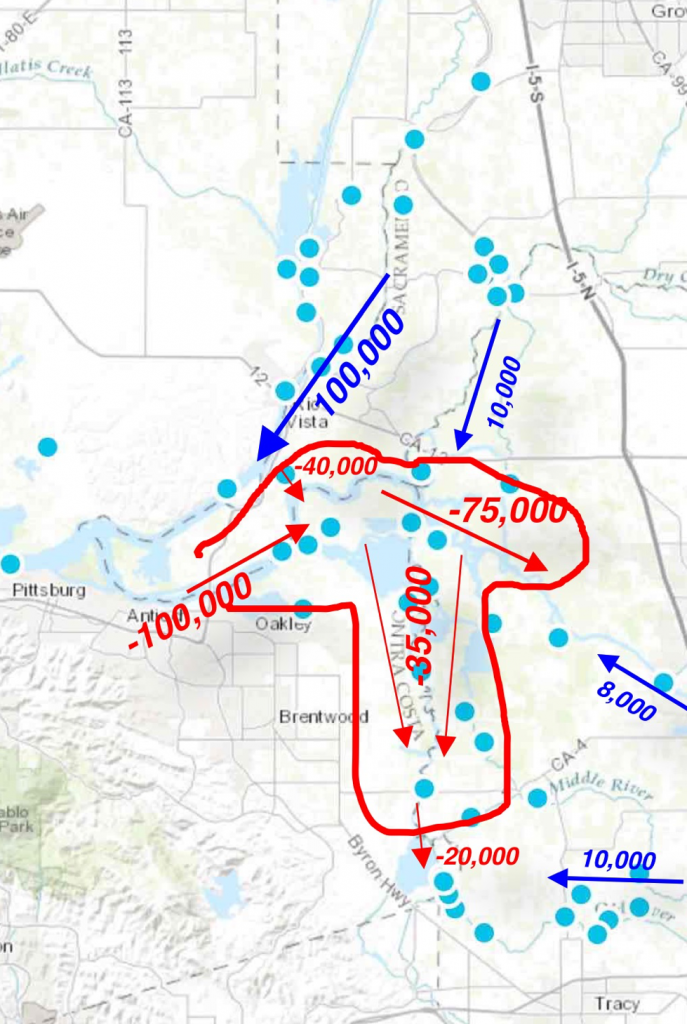
Figure 1. Approximate flood tide flow in cubic feet per second in mid to late January 2017. Blue arrows represent high Sacramento River, San Joaquin River and Mokelumne River flows (during flood tides). Red arrows depict negative flows of incoming tides. Note the south Delta incoming tide of -20,000 cfs would be less if not for the 14,000 cfs export rate at the south Delta pumping plants.

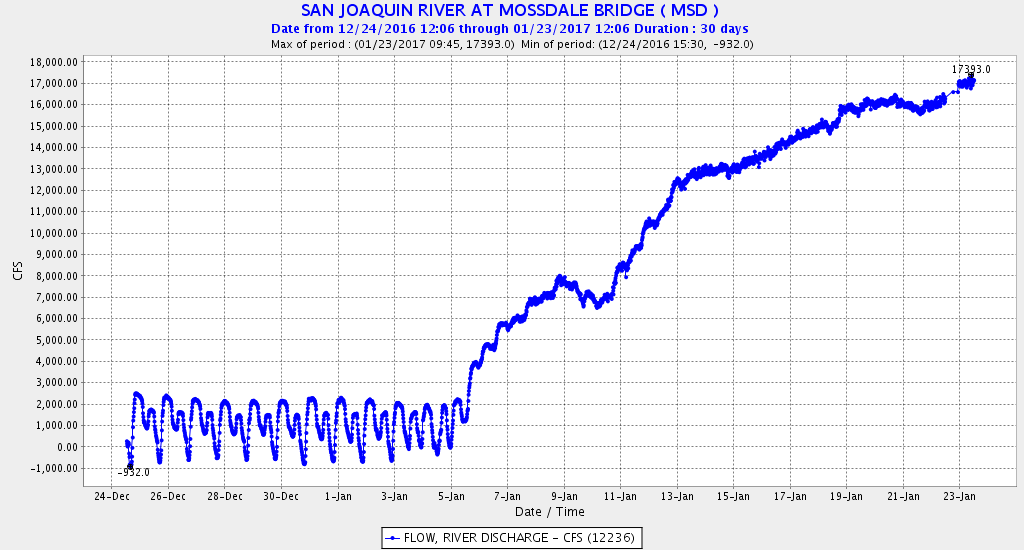
Figure 2. San Joaquin River flow at Mossdale at the head of the Delta upstream of Stockton and the Head of Old River. Note that on Jan 6 when flow reached about 6,000 cfs, the tidal signal dissipated when flow overcame the tidal forces.

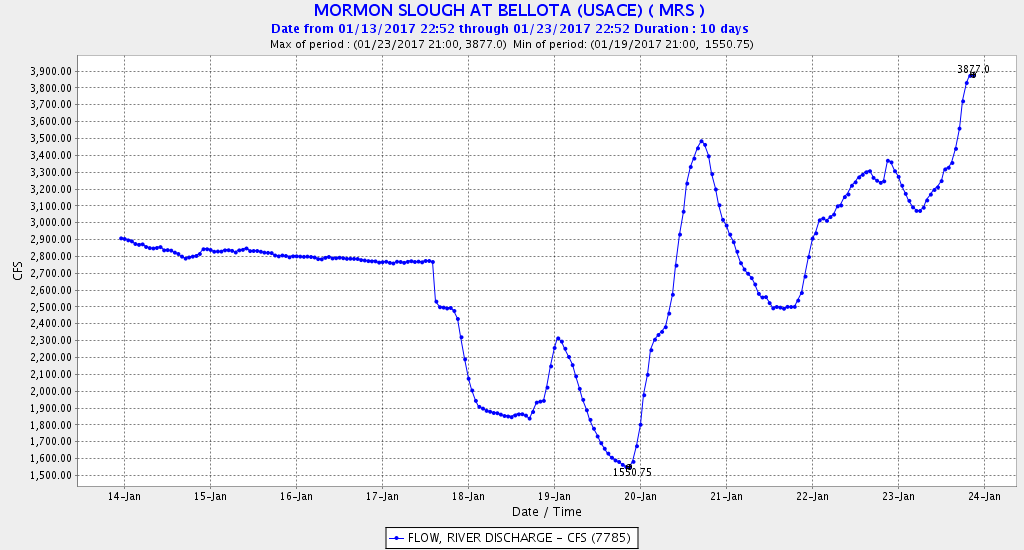
Figure 3: Flow from the Calaveras River, upstream of the Delta. The Calaveras enters the Delta at Stockton.
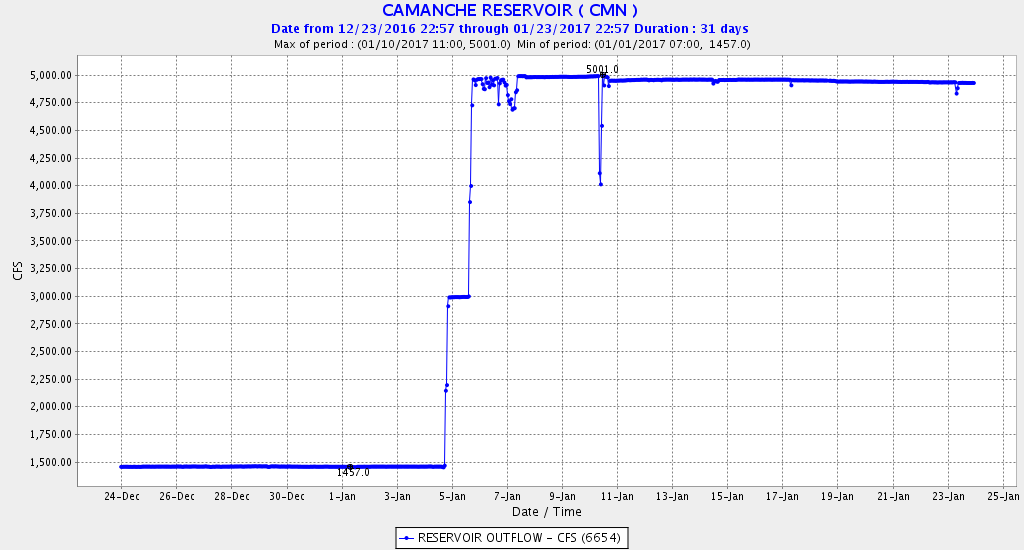
Figure 4. Release from Camanche Dam to the Mokelumne River. CDEC does not show flow values for the Mokelumne at gages further downstream. The Mokelumne enters the Delta near Jersey Point.
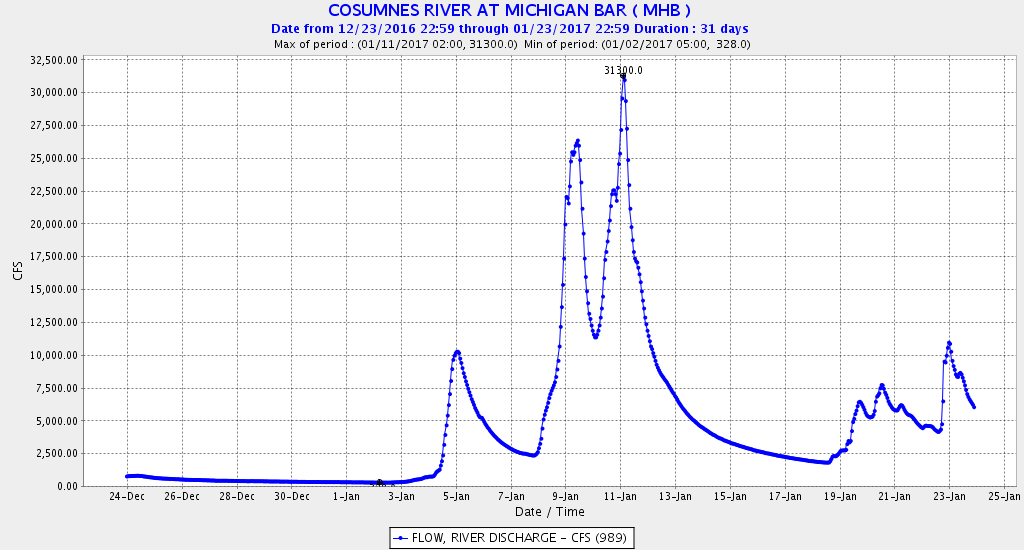
Figure 5. Cosumnes River flow well upstream of the Delta. Much of the high flow peaks enters the river’s connected floodplain, roughly between Lodi and Elk Grove, and does not flow immediately to the Delta. Flows in the Cosumnes enter the Mokelumne before passing into the Delta
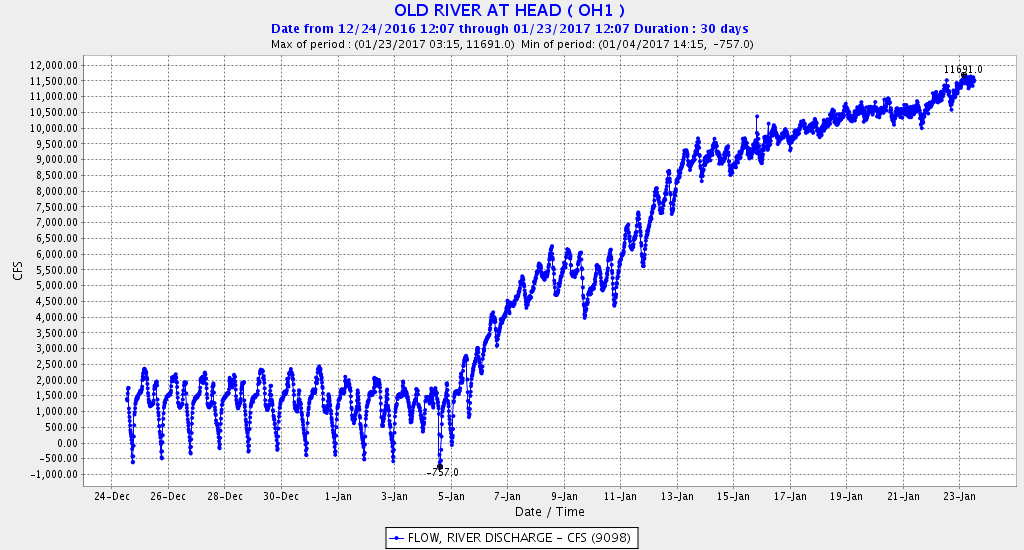
Figure 6. Flow entering the entrance to Old River from the San Joaquin River near Stockton.