June Protection Lost for Delta Smelt

In a May post and again in an early June post, I offered some hope for Delta smelt.  But the Smelt Biological Opinion and the Smelt Working Group failed the smelt once again.  The only protection afforded Delta smelt in June is the -5000 cfs Old-Middle River negative flow limit, which has the practical effect of limiting Delta exports to about 5000-6000 cfs.  Historically (from 1978-1994), D-1485 water quality standards limited June exports to 6000 cfs in order to protect Delta fish, but there are no June export limits in the existing D-1641 standards.

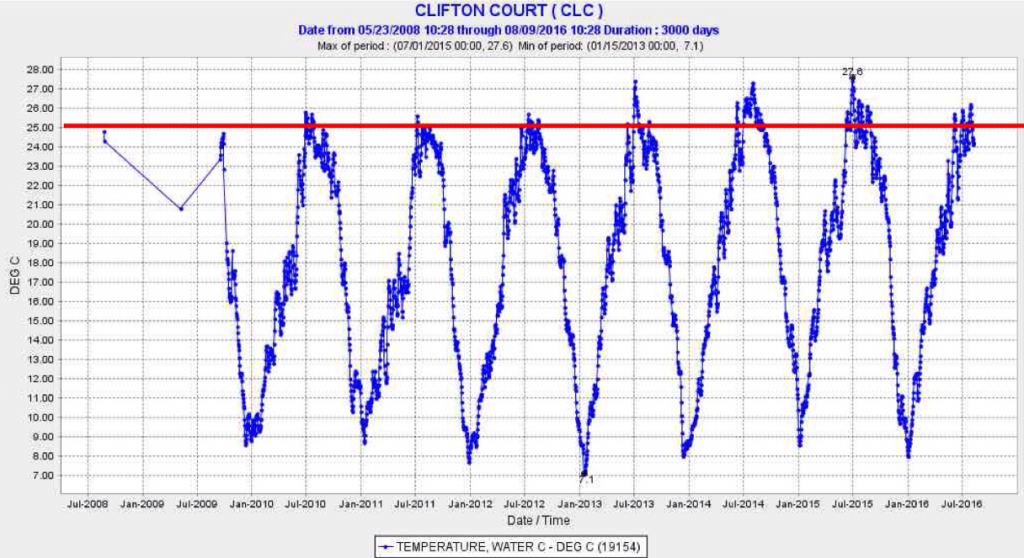
The last Smelt Working Group meeting was May 31.  The only biological opinion criterion left to manage, the -5000 cfs OMR limit, was gone because of a little known trigger in the opinion that dropped the OMR limit when the water temperature in the South Delta first reaches 25°C or 77°F (Figure 1).  The reasoning behind this trigger in the biological opinion was that exports would no longer hurt smelt because 25°C/77°F water temperatures would kill them anyway.  The problem with this logic is that exports can still pull smelt from their cooler nursery in the west and north Delta (Figures 2 and 3) into warm water killing zone in the central and south Delta.  Fortunately, export pumping in June 2016 was limited (Figure 4) by Reclamation’s holding back Shasta Reservoir storage releases to conserve cold-water for salmon.  Otherwise June exports and negative OMR flow would likely have been higher.

Reclamation has begun consulting with fishery agencies on a new biological opinion.  We can only hope that they improve protections for smelt and other Delta fish in spring and summer.  I suggest strong OMR restrictions any time the Delta Cross Channel in the far north Delta is closed, as this will help minimize (1) the draw of smelt from their nursery area and (2) the degradation of the Low Salinity Zone by south Delta exports.

Figure 1. Water temperature in Clifton Court Forebay in the South Delta in June 2016.

Figure 1. Water temperature in Clifton Court Forebay in the South Delta in June 2016.

Figure 2. Water temperature at Jersey Point in the west Delta in June 2016.

Figure 2. Water temperature at Jersey Point in the west Delta in June 2016.

Figure 3. Water temperature in the lower San Joaquin River at Three Mile Slough in June 2016.

Figure 3. Water temperature in the lower San Joaquin River at Three Mile Slough in June 2016.

Figure 4. June OMR flow. The Smelt Biological Opinion limit is for June is -5000 cfs, but that provision does not apply once south Delta water temperature reaches 25°C/77°F.

Figure 4. June OMR flow. The Smelt Biological Opinion limit is for June is -5000 cfs, but that provision does not apply once south Delta water temperature reaches 25°C/77°F.

Salmon Season Opens July 16

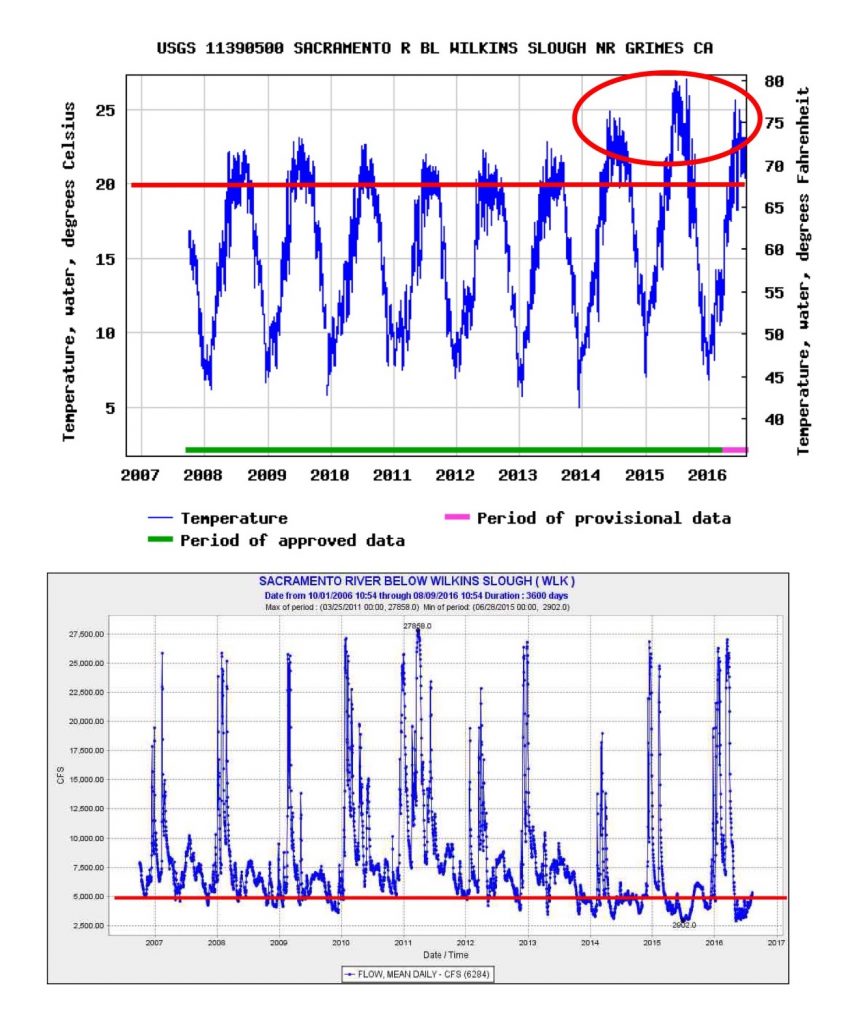
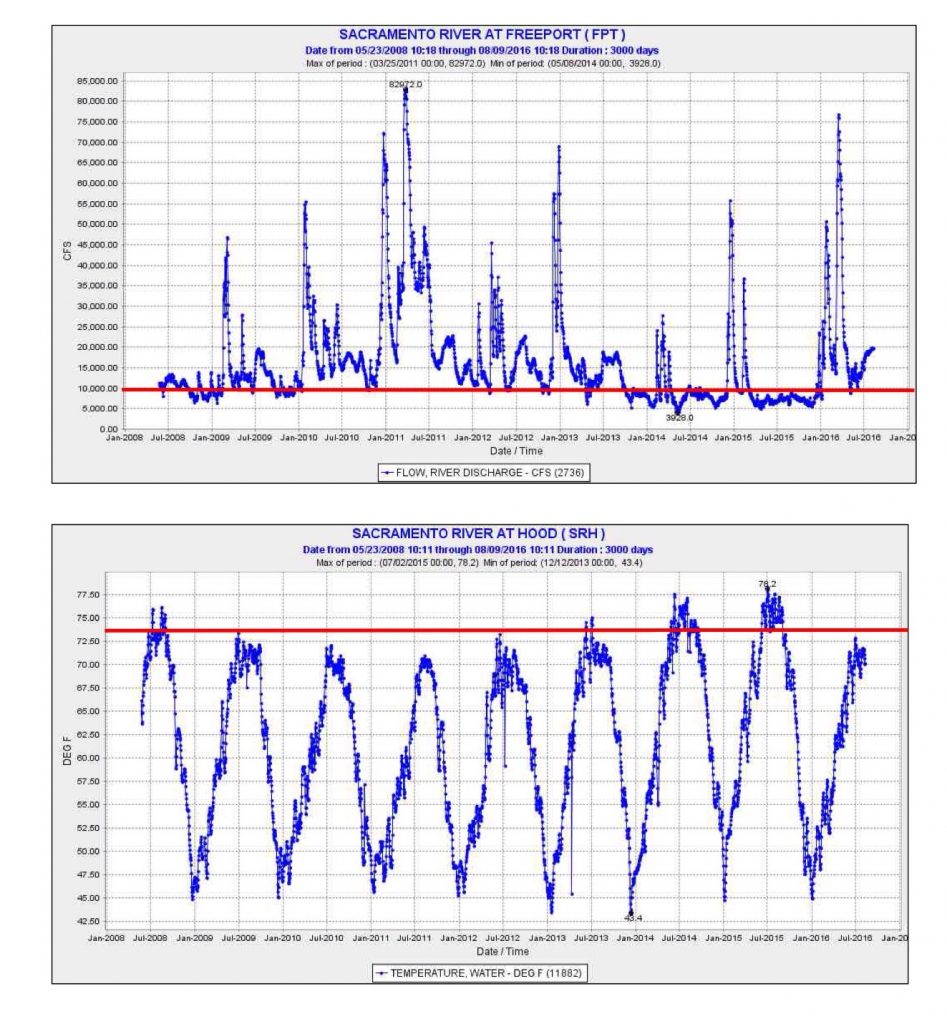
The Sacramento River salmon season opens on July 16 in the lower Sacramento River below Red Bluff, and in the lower Feather and American Rivers, as well as in the Bay-Delta. Will the Sacramento River remain cold enough to allow the fall-run salmon to leave the Bay and Delta for the rivers? Are the lower rivers warming into the 72-75°F range that blocks migration and stresses the adult salmon?

Salmon will be headed for the upper river reaches where water temperatures are cool, near 60°F. The Bay and west Delta remain below 70°F. At Rio Vista and Freeport on the Sacramento River in the north Delta water temperature have reached 70°F and are slowly rising. Upstream of the Delta, downstream of the points of relatively cool inflow from the Feather and American rivers, the Sacramento River remains just below 70°F.

Upstream from the mouth of the Feather, water temperatures in the Sacramento River are increasingly problematic. The hundred miles of river upstream from the mouth of the Feather to Hamilton City (RM 200) have a Central Valley Basin Plan upper temperature limit of 68°F in summer to protect the salmon during their run up the river in summer and fall. The only water temperature recorder is at Wilkins Slough, about mid-way in the reach, about 20 miles below Colusa (RM 143). Water temperature at Wilkins Slough has risen from 65°F to 72°F in the past week.

Summer water temperatures at Wilkins Slough vary with air temperatures, but are also determined in part by river flow. In the critically dry year last summer, water temperatures in July approached the lethal level for salmon of 80°F (Figure 1) under very low river flows (Figure 2). In below-normal year 2010, water temperatures were cooler (Figure 3) under higher river flows (Figure 4).

The flow at Wilkins Slough has increased over the past week from 3500 cfs to 5000 cfs, but the water temperature has continued to rise to 72°F with higher air temperatures. With even warmer air temperatures forecasted in the coming weeks, river flow should be increased to 6000 cfs or higher as in 2010 to maintain water temperature below 72°F. Temperatures above this level impede migration and stress adult salmon. A flow of 8000 cfs, as occurred in the summer of dry year 2012, would be more protective (Figures 5 and 6).

Figure 1. Water temperature at Wilkins Slough on the Sacramento River (RM 125) in June-July 2015, a critically dry year.

Figure 1. Water temperature at Wilkins Slough on the Sacramento River (RM 125) in June-July 2015, a critically dry year.

Figure 2. Sacramento River flow at Wilkins Slough in June-July 2015.

Figure 2. Sacramento River flow at Wilkins Slough in June-July 2015.

Figure 3. Water temperature at Wilkins Slough on the Sacramento River (RM 125) in June-July 2010, a below normal year.

Figure 3. Water temperature at Wilkins Slough on the Sacramento River (RM 125) in June-July 2010, a below normal year.

Figure 4. Sacramento River flow at Wilkins Slough in June-July 2010.

Figure 4. Sacramento River flow at Wilkins Slough in June-July 2010.

Figure 5. Water temperature at Wilkins Slough on the Sacramento River (RM 125) in June-July 2010, a dry year.

Figure 5. Water temperature at Wilkins Slough on the Sacramento River (RM 125) in June-July 2012, a dry year.

Figure 6. Sacramento River flow at Wilkins Slough in June-July 2012.

Figure 6. Sacramento River flow at Wilkins Slough in June-July 2012.

Lake Davis Sierra Trout Fishing

Typical “trophy-sized” rainbow trout caught (and released) in May 2016 from Lake Davis. (Jon Baiocchi photo )

Typical “trophy-sized” rainbow trout caught (and released) in May 2016 from Lake Davis. (Jon Baiocchi photo1)

Lake Davis is a popular Sierra trout fishing destination in Plumas County near the town of Portola, California. Lake Davis was created in 1966 when the California Department of Water Resources dammed Grizzly Creek, a tributary of the Middle Fork Feather River, as part of State Water Project. The lake is perhaps best known for its decade-long battle over northern pike extermination efforts by CDFW that ended successfully nearly a decade ago.

Controversy now returns to the lake’s fishery, because catch rates for trout have plummeted again, similar to their decline when pike spread in the lake. This time, the problem seems to be either over-harvest by fishermen or cutbacks in CDFW’s stocking program since the huge hatchery plantings that followed the poisoning of pike (and trout) in the lake a decade ago. Did fishermen become spoiled and harvest too many fish? Or has the state become stingy with its fishery stocking and management programs?

Some speculate the state has become vindictive to ongoing lawsuits brought on by the town government by holding back on stocking. Others note that overall hatchery production, especially of the popular Eagle-Lake strain used in Lake Davis, has suffered during the recent drought. Regardless, the issues beg the question of whether changes are needed in managing some Sierra lake fisheries, if only to protect fragile local Sierra community economies sustained in large part by recreation.

Like many other popular Sierra lakes, Davis is managed by CDFW as a Hatchery Supported Trout Water. It is stocked and managed as a Put-and-Grow and Put-and-Take water. Such waters are capable of supporting trout growth and carry-over survival, but have limited capacity for natural reproduction. For Put-and-Grow fisheries, hatchery-produced trout 3-6 inches in length are stocked periodically to augment the trout population. Put-and-Take waters are stocked with catchable-sized hatchery trout in support of intensive fisheries to support waters near campgrounds, roadsides or other high access areas where angling demand is high, and where anglers often want to keep some fish. California is blessed with many such public waters sustained by CDFW and public utilities’ stocking.

At Lake Davis, many locals, visitors, and guides have noted a gradual decline in catch rates of trout, but an increasing average size of trout over the past four to five years. Catch rates including my own have gone from 20 to 10 per day to 5 to or even 1 or 2 per day. Average size has increased several inches to 20-22 inches, with larger fish common. Rather than faster growth, it appears more fish are reaching their terminal age of 4 to 5 years. A lack of smaller size trout in catches may indicate reduced stocking or poor survival of the 3-12 inch hatchery fish.

Harvest rates of 5 per day are allowed, with 10 in possession. The season is openyear round, and ice fishing is popular. Winter-spring harvest of adult trout near the mouths of spawning creeks is allowed, whereas some other Sierra lakes open in April or May to protect spawning fish. Other quality Sierra lake fisheries have reduced harvest rates of 2 fish per day. Regardless, the lake attracts many diverse fishing interests who have been attracted by high catch rates and the large size of trout over the years.

Other than harvest and stocking rates, what else has changed the lake in recent years? Certainly four years of drought has brought about the gradual drop in lake depth and surface area, with some recovery this winter and spring. Largemouth bass and shiners have returned in small numbers, but thankfully there have been no reports of pike. The trout’s food supply seems recovered and abundant for the most part. The lake’s bed of invasive aquatic Eurasian milfoil plants remains abundant. The lake’s twin sister Davis Lake in southern Oregon with restrictive fly-fishing-only regulations and no trout harvest allowed has also had its trout fishery decline in recent drought years.2

Other than stocking more fish or restricting harvest, what else could be done to improve the lake’s fishery? One option I would recommend is raising catchable and trophy sized trout in pens using local funding. This approach was recently begun at Englebright Reservoir on the Yuba River.3 It is gaining favor throughout the West for enhancing popular high-intensity trout lake fisheries where there is limited natural production and limited conflict with wild-trout populations. On Davis Lake, Honker Cove or the Dam Cove would be good locations for such an endeavor. I would also recommend stocking more sterile triploid trout, as they may grow faster and survive better to older ages by not having the urge to undergo the rigors of spawning.

For further reading on the Lake Davis trout fishery, Sierra lake fishery management, and related issues see the following:

June Update and Possible Solution to 2016 Fish Woes

Over the past month I related water issues involving Delta and longfin smelt, striped bass, green and white sturgeon, and winter-run and spring-run salmon. All of these species need river flow and cooler water over the next several months. Shasta releases to the upper Sacramento River need to be cold, stable, and sufficient to sustain winter-run salmon eggs in the river near Redding and to sustain moderate flows and cooler water temperatures for 200 miles of river to protect sturgeon and other lifestages of salmon. Sufficient flows needs to pass through the Delta to keep the low salinity zone downstream of the Delta in the cool waters of eastern Suisun Bay, away from Delta exports.

Shasta releases are now 8000 cfs, with Bend Bridge water temperature near the Red Bluff target of 56°F. In June and July of drought years 2012 and 2013, releases were 11,000-14,000 cfs. However, concern over carryover storage and sustaining cold-water releases through summer has led to a more conservative management strategy in 2016. The cold-water pool in Shasta Reservoir is being rationed to make it through the summer. Flows will rise over the next six weeks to 9,000 or 10,000 cfs to satisfy irrigation demands in the upper river.

Flows in the lower Sacramento River at Wilkins Slough need to be greater than 5000 cfs in summer, if only to keep water temperature down closer to the Basin Plan’s 68°F. Flows are now 3000-4000 cfs, with water temperatures up to 75°F. In dry years 2012 and 2013, flows at Wilkins Slough were 6000-9000 cfs, and water temperatures were cooler, as some of Shasta’s storage was allocated for Delta export. This year’s management strategy to hold back Shasta releases will, if continued, keep both Wilkins Slough flows and Delta exports down.

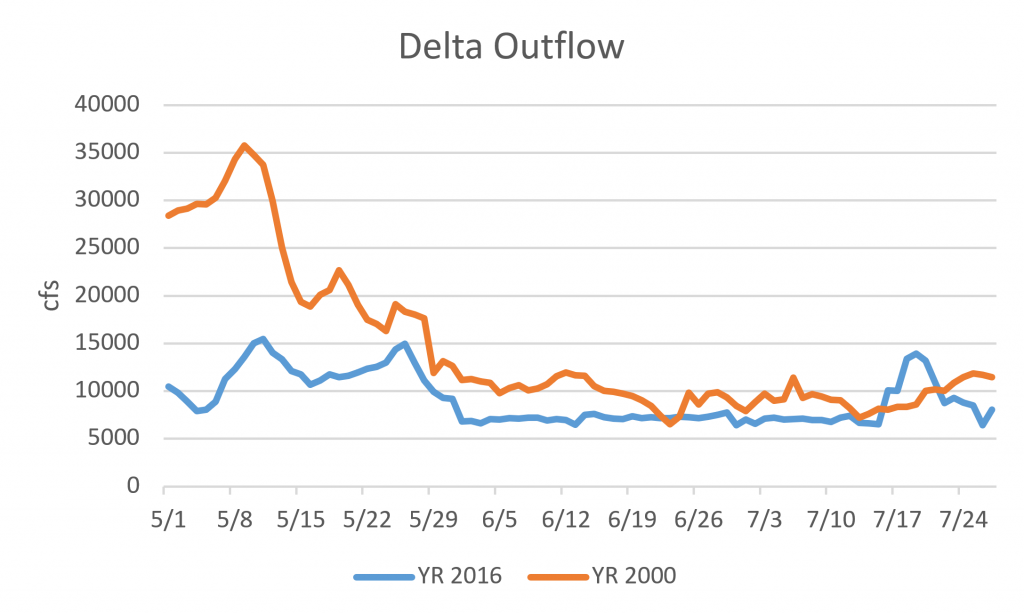
Delta outflows need to be sustained near 10,000 cfs to keep the low salinity zone and X2 (2 ppt salinity) near Collinsville in eastern Suisun Bay. However, July outflow to the Bay required by water quality standards will be only about 8000 cfs. To help save the last of the two smelt species, 10,000 cfs would be far better.

A reasonable solution is apparent: raise Shasta releases through most of the summer by 2000 cfs to 10,000-12,000 cfs and require that the extra release be passed down the river to and through the Delta. While such a management strategy would benefit the fish, it would decrease Shasta storage by 120,000 acre-ft of water per month. At present, Shasta is 90% full at 4.1 million acre-feet (the cold-water pool volume is about 2.4 maf). At 12,000 cfs, the total Shasta release would rise to 600,000 acre-feet per month, which is about the current total release from Oroville (Feather River) and Folsom (American River) reservoirs. NMFS and USBR have determined that a 10,000 cfs Shasta cold-water release can be sustained through the summer, while a 12,000 cfs release could be problematic. Protests would no doubt come from water users who would want the extra 2000 cfs. But note that of the 20,000 cfs being released today from the three main Sacramento Valley reservoirs, only 8000 cfs is reaching the Bay.1

This solution of raising total reservoir releases to 22,000-24,000 and Bay outflow to 10,000 cfs is reasonable to help the fish after four years of drought. In 2014-2015, water quality standards were drastically reduced, with catastrophic effects to fish. The continuing legacy of these catastrophic effects creates the urgency to do better in 2016.

If higher releases from Shasta become problematic for whatever reason, then some compromise should be achievable, noting that water deliveries of Shasta water are to be provided only after the needs of the fish are first considered, including conservation of Shasta’s cold-water pool through the summer and early fall (Water Rights Orders 90-05 and 92-02). Further, Central Valley water rights are provided via the Trinity River trans-basin diversion to Keswick Reservoir on the Sacramento River below Shasta Dam, but the Trinity supply is much in doubt because Trinity storage has failed to recover after the drought, unlike Shasta storage. A lack of Trinity supply this summer will further limit water available for irrigation in the Central Valley. Yet another constraint is whether the available storage in Oroville and Folsom reservoirs is able to satisfy Delta demands without compromising the needs of endangered fish in the Feather and American rivers.

Sorting out these conflicts and needs is the responsibility of the State Water Resources Control Board. The Board’s top priority should be the basic needs of the endangered salmon, sturgeon, and smelts of the Central Valley. At minimum, the Board should require the following conditions this summer:

  1. Below Shasta – Stable flows of 9,000 to 10,000 cfs and 56°F average daily water temperatures near Red Bluff (Jellys Ferry or Bend Bridge).
  2. Lower Sacramento River – minimum 5000 cfs at Wilkins Slough (RM 125 on the Sacramento River)
  3. Delta Outflow – 9,000 cfs in July, 5,000 cfs in August, and 4,000 cfs in September.
  1.  A further complication is that South Delta export criteria allow an increase from 35% of inflow to 65% starting July 1.  Exports in June are limited to 5000 cfs.  In July, exports can be raised to 65% of inflow, but only if outflow is kept at 8000 cfs.  Delta ag diversions are also near 4000 cfs.  Thus July Delta inflow of  20,000 cfs or more (compared to the present inflow of 15,000 cfs) would be needed to allow 10,000 cfs of Delta export.  

It is not too late for Delta smelt

Before the 2012-2015 drought, Delta smelt had a recovery period in 2010 and 2011. Now, in 2016, there remains an opportunity for some form of recovery, albeit small. What is needed is exactly what the US Fish and Wildlife Service has been pleading for so far this spring to save Delta smelt: more Delta outflow.

This note was at the bottom of the USFWS’s last Delta smelt determination memo to the USBR on June 1, 2016. This literally was their last action this year under the Delta Smelt Biological Opinion because there are no protections in summer once the South Delta reaches a water temperature of 25°C (77°F).

This note was at the bottom of the USFWS’s last Delta smelt determination memo to the USBR on June 1, 2016.1 This literally was their last action this year under the Delta Smelt Biological Opinion because there are no protections in summer once the South Delta reaches a water temperature of 25°C (77°F).

A careful look at the four figures below indicates that there remains a chance to recover smelt this summer. There is a concentration of Delta smelt near Sherman Island in the west Delta (figure 1). If these smelt can get to Suisun Bay in the coming weeks as they did in 2010 and 2011, where habitat is better and where they are away from the influence of the south Delta exports, then they have a chance.

To move the largest remaining concentration of this species in existence downstream, it will take outflows of about 10,000 cfs. Right now outflows are about 7500 cfs (see chart 1, below), the minimum required under present water quality standards. The fisheries agencies and the water projects need to find a way to make up the difference as soon as possible.

Chart 1. Delta outflow in June 2010, 2011, 2015, and 2016. 2011 was a Wet year. 2010 and 2016 are Below Normal water years. 2015 was a Critically Dry year.

Chart 1. Delta outflow in June 2010, 2011, 2015, and 2016. 2011 was a Wet year. 2010 and 2016 are Below Normal water years. 2015 was a Critically Dry year.

Figure 1. Mid-June 20-mm Smelt Survey 2016. Largest green dot is in north side of Sherman Island in Sacramento River channel of west Delta.

Figure 1. Mid-June 20-mm Smelt Survey 2016. Largest green dot is in north side of Sherman Island in Sacramento River channel of west Delta.

Figure 2. Mid June 20-mm Smelt Survey 2010. Note smelt length-frequency chart at bottom-center of chart, which also depicts total caught in survey.

Figure 2. Mid June 20-mm Smelt Survey 2010. Note smelt length-frequency chart at bottom-center of chart, which also depicts total caught in survey.

Figure 3. Mid-June 20-mm Smelt Survey 2011.

Figure 3. Mid-June 20-mm Smelt Survey 2011.

Figure 4. Mid-June 20-mm Smelt Survey 2015. Large green dot is in Sacramento Deep Water Ship Channel.

Figure 4. Mid-June 20-mm Smelt Survey 2015. Large green dot is in Sacramento Deep Water Ship Channel.