Sacramento River Salmon Science

A recent paper in the prestigious Canadian Journal of Fisheries and Aquatic Science discusses Central Valley salmon. The paper concludes: “Wild stocks in several California rivers are now dominated by hatchery fish (Barnett-Johnson et al. 2007; Johnson et al. 2012; Quiñones and Moyle 2014), potentially eroding the long-term resiliency of wild, locally adapted populations by disrupting selection for heritable traits that improve lifetime reproductive success in variable environments.”

First, wild or naturally spawning stocks or runs of fall-run Chinook salmon in Valley rivers are all dominated by hatchery salmon. Without hatcheries and straying of hatchery salmon to non-hatchery rivers (e.g., Yuba, Cosumnes, etc.), there would be almost no salmon runs of significance.

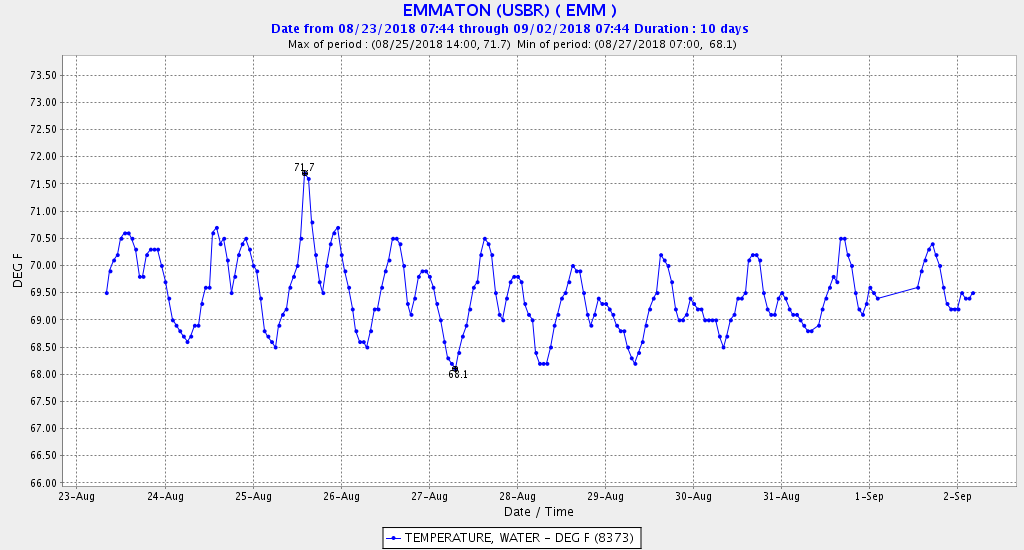
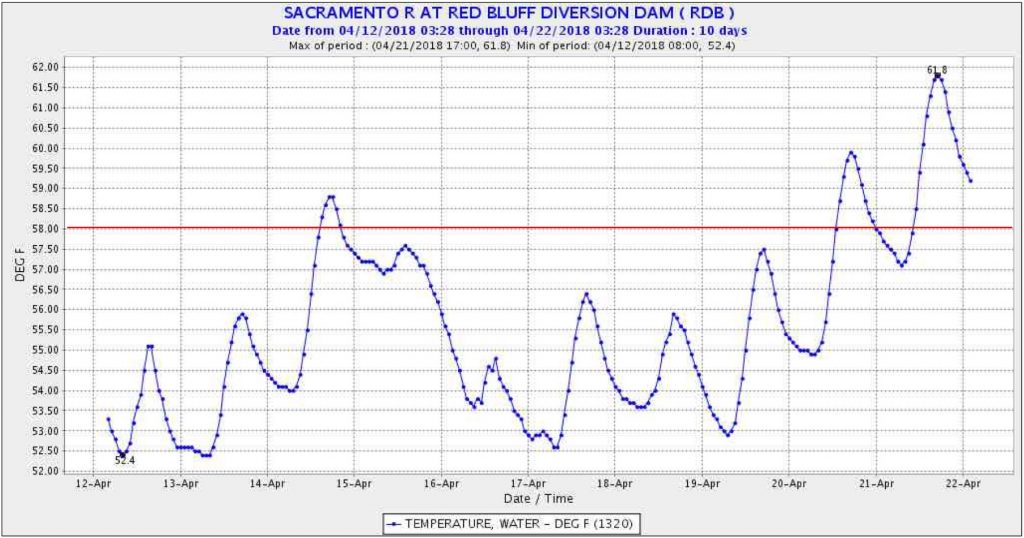
Second, there are hardly any significant locally adapted (wild) traits left to erode. River flows, water temperatures, gravel spawning beds, large woody debris, predators, and channel morphologies have become so limiting or compromising that wild salmon survival is nearly nonexistent.

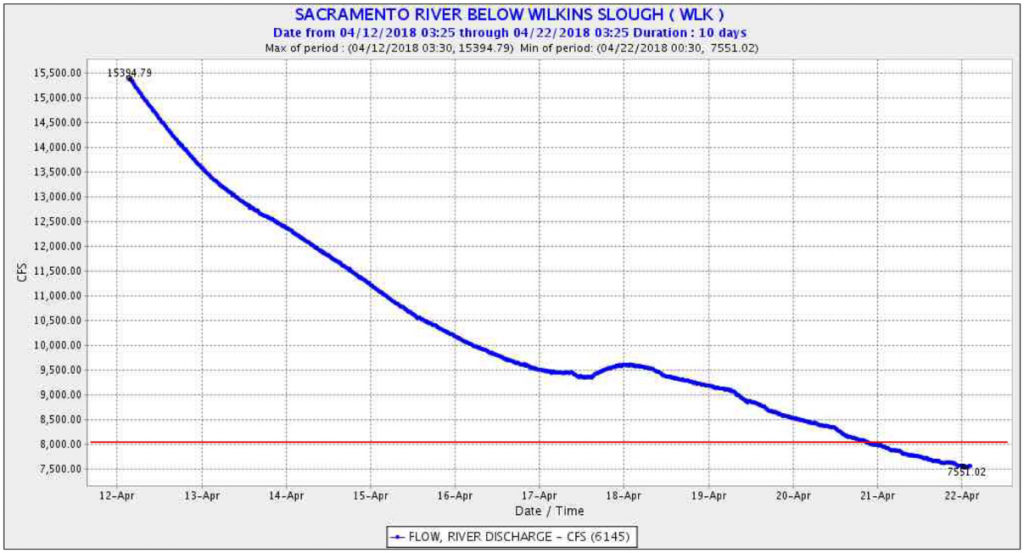
Third, the “lifetime reproductive success” potential of wild fish is primarily compromised by water and fisheries management. Flows are too low, and fisheries continue harvesting much of the wild salmon production.

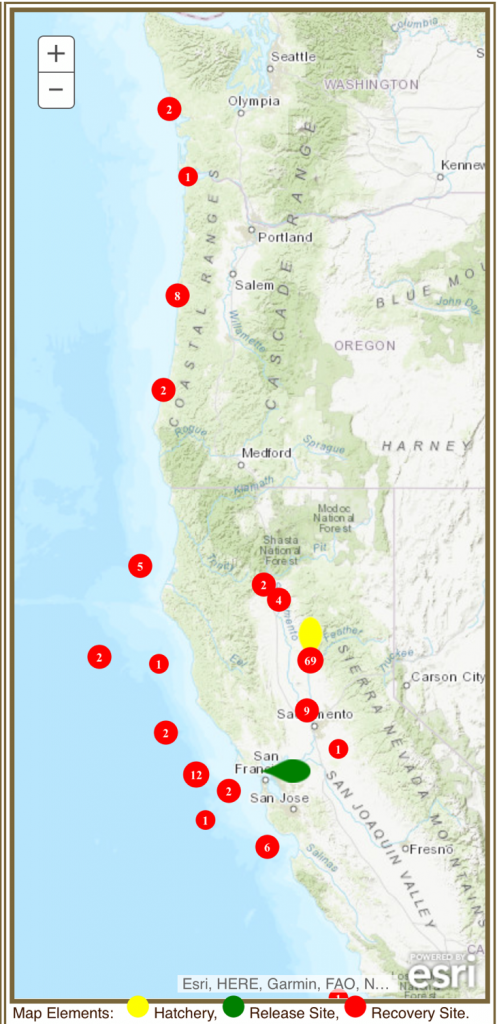
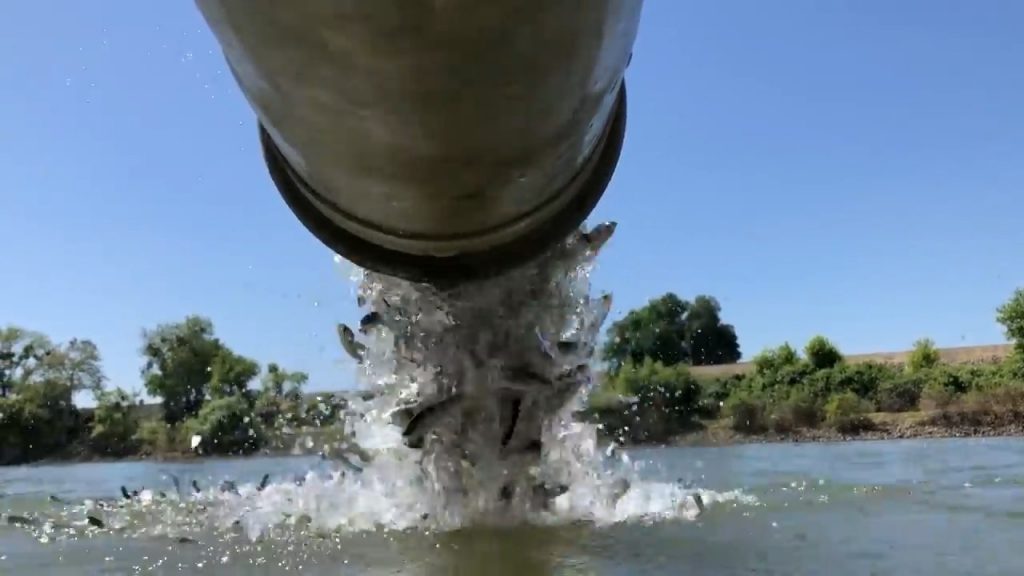
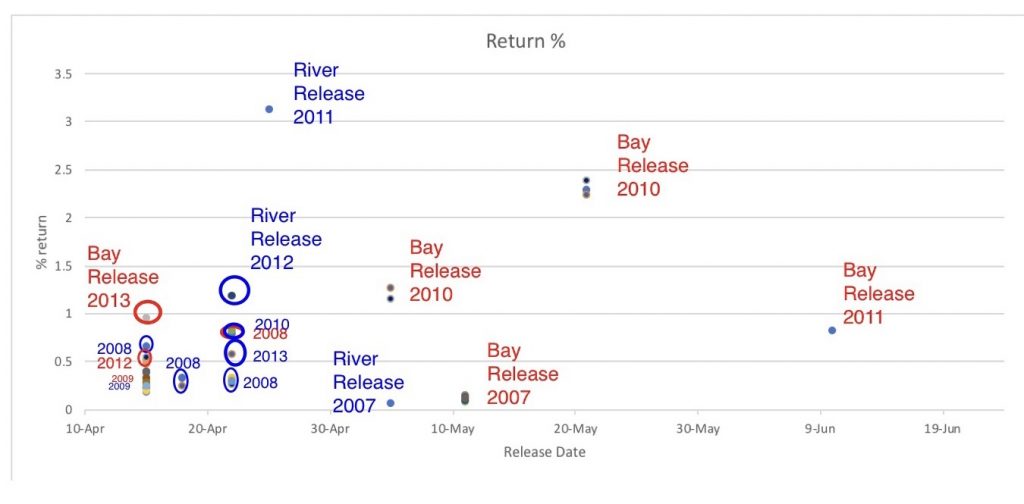
Fourth, the recent salmon population crashes of 2009 and 2016 are blamed by many salmon scientists on poor ocean conditions, with little regard for poor river habitat or water management as contributing factors, let alone hatcheries. By contrast, the federal Battle Creek hatchery managers knew they had to truck some of their smolt production to the Bay during the drought because of poor river conditions if they hoped for some survival and contribution to future runs.

The authors of the paper imply that hatcheries are the problem. No doubt the hatchery programs could be improved to lessen their negative effects and improve their contribution to salmon recovery. But for sure the fault is not with the hatcheries. Lack of support for hatcheries by scientists and resource agencies will dry up hatchery funding by water-user entities and make the problem worse.

The paper’s authors conclude: “There is a growing concern that salmon populations in the C[entral] V[alley] of California are becoming dependent upon hatchery supplementation, a conservation status recently identified as “mitigated extinction” Baumsteiger and Moyle 2017).” California salmon have been dependent on hatcheries for many decades. This is not a new development. Dams and diversions wiped out the wild salmon and their critical habitats, while hatcheries kept the dream going. Now scientists want to take the dream away.

Give the authors some credit for ending by saying: “Hatcheries can play a key role in the recovery of wild stocks, supplementing the fishery, and the reestablishment of natural areas, but only with cautious and appropriate management.” Despite the ambiguity, I had similar recommendations for improving hatchery programs in a recent post. 1

Tag Code #060448

In the spring of 2014, 11,791 Feather River fall run Chinook smolts with tag code #060448 were trucked from the Feather River Hatchery and released to net pens in northern San Francisco Bay near Tiburon, California and the Golden Gate Bridge.  It was the middle of the historic 2012-2015 drought.  Somehow, an estimated 323 of these fished survived (2.74%) to be recovered in fisheries, spawning grounds, and hatcheries, including 68 back to the Feather River Hatchery (Figure 1).  The return rate for the Tiburon released smolts was over ten times that of the Feather River releases, five times that of Delta net pens, and over twice that of eastern San Pablo Bay pen releases (Table 1).  Similar results occurred from 2013 and 2015 Tiburon releases.  Results were even better from smolts barged from the Feather River to the Golden Gate in 2013.1

One wonders whether trucking and barging millions of smolts reared at the Feather and American River hatcheries would lead to more salmon commercial and sport fishery catches and improved spawning runs in the Feather and American rivers, especially during droughts.  Salmon run collapses during the 2007-2009 and 2013-2015 droughts were often blamed on poor ocean conditions, as well as poor river conditions.  Concerns of potential straying are unfounded, as all the Bay releases of Feather and American hatcheries have low straying rates (see Figure 1 for example).  Do we want a better return on our Central Valley salmon hatchery investments?

Table 1.  Number released and estimated %return from 2014 Feather River smolt releases.2
Release Location Total Released Percent Return
Tiburon Net Pens 11,791 2.74
Lower Feather River 1,230,000 0.01-0.19
West Delta Net Pens 201,000 0.55
San Pablo Bay Net Pens 6,900,000 0.19-1.30
Lake Oroville 127,000 0.0
Total 8,400,000 0.0-2.74

Figure 1. Tag return locations from #060448 Tiburon release. Source: rmis.org

  1. http://calsport.org/fisheriesblog/?p=1052
  2. Note: not all returns have been analyzed and recorded; further returns are expected from various 2017 tag-recovery sources. Data source: rmis.org

Delta Smelt Summer 2018

After catching over 800 Delta smelt in 2011 (Figure 1) and near 30 in 2017 (Figure 2), the Summer Townet Survey captured only 3 in 2018 (Figure 3). The pattern is consistent with the spring 20-mm Survey collections

The only option now other than extinction is stocking hatchery smelt in large numbers in their primary summer-fall habitat, the Low Salinity Zone of the Bay-Delta. Release should be near the 2 ppt (3800 EC) location, commonly referred to as X2, which recently has been moving tidally back and forth between Collinsville and Sherman Island in the Sacramento River channel just downstream of the Emmaton gage (Figures 4 and 5). The X2 location has optimum salinity, water temperatures (<70oF), turbidity, and food for Delta smelt.

Figure 1. Summer Townet collections of Delta smelt 2011.

Figure 2. Summer Townet collections of Delta smelt 2017.

Figure 3. Summer Townet collections of Delta smelt 2018.

Figure 4. Water temperature at Emmaton late August 2018. High tide X2 water is 68-69oF.

Figure 5. Salinity (EC) at Emmaton late August 2018. High tide water is near X2 salinity (3800 EC).

Spring Hatchery Salmon Releases – Feather River

Hatchery fall-run salmon smolts being released into the Sacramento River at the mouth of the Feather River at Verona on May 2, 2018. SacBee photo.

The California Department of Fish and Wildlife released spring-run and fall-run salmon smolts raised at the Feather River Hatchery into the lower Feather River from late March to early May 2018. The initial spring-run releases were accompanied by a flow pulse up to 14,000 cfs into the lower Feather River.1 The early May release2 of fall-run was made without the benefit of a flow pulse.

Past performance of hatchery spring-run smolt releases is shown in Figure 1. The 2011 successful smolt release was accompanied by 8,000-17,000 cfs Oroville Dam flows (Figure 2) and wet year conditions in the Bay-Delta. The 2012 modestly successful smolt release was accompanied by a 3000 cfs flow pulse. The 2007 to 2009 smolt releases also had an accompanying 3000-5000 cfs flow releases, but flows that followed fell to 1000-2000 cfs. There was no flow pulse in 2010.

The early April 2018 flow pulse in the Feather River was followed by falling flows (14,000 cfs in early April down to 1000 cfs flow in late April – Figure 3). The latest release of fall-run smolts on May 2 was made near the mouth of the river because of low Feather River flows. Flows in the Sacramento River were also low (less than 10,000 cfs – Figure 4), and water temperatures were marginal at 65°F. The evidence summarized in Figures 1 and 2 suggests that smolts should be trucked to the Bay in non-wet years without strong flow pulses. Survival would be further increased if the smolts are barged from the mouth of the river.3

We can expect good survival from the earlier releases that were accompanied by flow pulses and poor survival from the early May release without a flow pulse. The latter release should have been trucked to the Bay.

Figure 1. Survival (% return) of spring-run salmon tag-release groups from 2007-2013 spring smolt releases. Source of data: http://www.rmpc.org/

Figure 2. Flow (cfs) in the lower Feather River at Gridley in Apr-May 2007-2013.

Figure 3. Flow (cfs) in the lower Feather River at Gridley in Mar-May 2018.

Figure 4. Flow (cfs) in Sacramento River just below mouth of Feather River at Verona in Mar-May 2018.

More on Coleman Hatchery Salmon Straying

There appears to be little doubt that trucking Coleman (Battle Creek) Hatchery fall run salmon smolts to San Pablo Bay pens for release during the recent 2013-2015 drought provided near five-fold higher survival (and fishery catch) than releases at the hatchery (Figure 1). Standard late April to early May releases to the Bay net pens resulted in returns of about 1%, as compared 0.1-0.3% for releases at the hatchery. With Coleman Hatchery smolt releases at 10-12 million per year, the difference in release strategy amounts to tens of thousands of adult salmon produced in critical drought years.

The problem with Bay releases is it results in considerable straying of returning Coleman hatchery adult salmon to other Central Valley rivers and hatcheries. Comparison of returns from several groups of brood year 2013 releases from Coleman and the Bay is shown in Table 1. A four-to-five- fold higher return to the fisheries is evident for the Bay releases, as is a 90% reduction in Coleman Hatchery returns. The return of Coleman fish to other hatcheries is an added problem in that the Coleman fish returned earlier. This was fortunate for Coleman hatchery, because some of the eggs from these fish were shipped to Coleman. It also indicates there may be some environmentally-derived genetic differences in the fall run of Central Valley rivers.

Table 1.  Comparison of Coleman Hatchery tag recovery numbers from 400,000 smolts released at the hatchery and trucked to the Bay for brood year 2013 fall run salmon.  Data source: http://www.rmis.org/.

RECOVERY LOCATION COLEMAN RELEASES
(400,000 tags)
BAY RELEASES
(400,000 tags)
Nearby San Francisco Ocean 68 279
Central Valley Rivers 25 138
Coleman Hatchery 629 76
Other Hatcheries 3 204

These results beg some real questions.  Can the Coleman Hatchery get enough eggs to meet production goals?  Is the straying to other rivers and hatcheries a problem or perhaps a benefit?  Is the greater return to fisheries from Bay releases worth the effort and problems resulting?  Are there other actions that might resolve some of the problems, and perhaps increase survival to the 3-to-5 % level of wetter years?

It appears that Coleman was able to raise only 6 million fall-un smolts to release in April-May 2018 (normal release is 12 million) because of the shortage of eggs.  These smolts are likely slated for release at the hatchery to minimize future egg shortages.

With the irrigation season starting, storm and snowmelt flows declining, and the arrival of warm, dry weather, these hatchery smolts will need a boost to help them get over two hundred miles from Battle Creek near Redding to the Bay and ocean.  With flows already too low (Figure 2) and water temperatures too high (Figure 3), the young salmon need a pulse of cold Shasta Reservoir water.  There is plenty of water in Shasta Reservoir for this.  Shasta will fill (4.5 million acre-feet) in a few weeks.  It is filling at a rate of more than 10,000 acre-feet per day in mid-April.  A pulse of three thousand added cfs to the Sacramento River for ten days amounts to 60,000 acre-feet.  The added water should be passed through the Delta to the Bay.  I hope this is an element of the plan to recover the Sacramento River fall-run salmon from the 2016-2017 crash.

Figure 1. Survival rates (% return) of Coleman Hatchery smolts (brood years 2012-2014) released at various locations in April-May of 2013-2015 drought. “SPB” denotes San Pablo Bay. Data source: http://www.rmis.org/.

Figure 2. Lower Sacramento River flow at Wilkins Slough (river mile 125), April 12-22, 2018. Flows below 8,000 cfs lead to excessive lower river water temperatures (>65°F).

Figure 3. Lower Sacramento River water temperature at Red Bluff, April 12-22, 2018. The water temperature maximum-daily-average standard at Red Bluff (river mile 243) is 58°F.