How are Delta and Longfin smelt doing after my earlier March and April poor prognoses? As predicted, late April – early May surveys indicated extremely low numbers (Figures 1 and 2), far fewer than the record low numbers of 2013-2014 (Figures 3-6).
In the May 4, 2015 Smelt Working Group meeting1, “Members did make a note of the single Delta Smelt larva from April 23, as well as the three Delta Smelt observed during the primary channel CO2 treatment [at Tracy Fish Salvage Facilities], providing that this is evidence of entrainment. These collections occurred despite at or below minimum exports levels, as defined in the Biological Opinion; OMR flows were also at or close to the most positive flows indicated in the Biological Opinion….Salvage of juvenile Longfin Smelt increased to 52 for the week of April 27 through May 3. Some increase was expected as south Delta water warmed. Between April 13 and 15, four juvenile Longfin Smelt were salvaged at the CVP and 12 at the SWP, at the same time, a single larva was observed in the larval fish samples at the CVP and four larvae at the SWP. During the period of April 17 through 23, seven Longfin Smelt larvae were observed at the SWP and one larva at the CVP in larval fish collections. Continued collections in salvage are expected. Overall, catches in the central and south Delta were not sufficient to reach concern levels based on density or distribution… Longfin Smelt larvae and small juveniles will continue to be detected at the salvage facilities until water temperatures surpass 22 deg C.” The fact that any smelt were collected at the two south Delta export facilities should be a grave warning of a larger and very significant “take” of smelt. As stated many times before, the odds of any young smelt reaching the south Delta export facilities without succumbing along the way are infinitesimal. In addition, no smelt will survive in any part of the Delta where water temperature reaches 25°C.
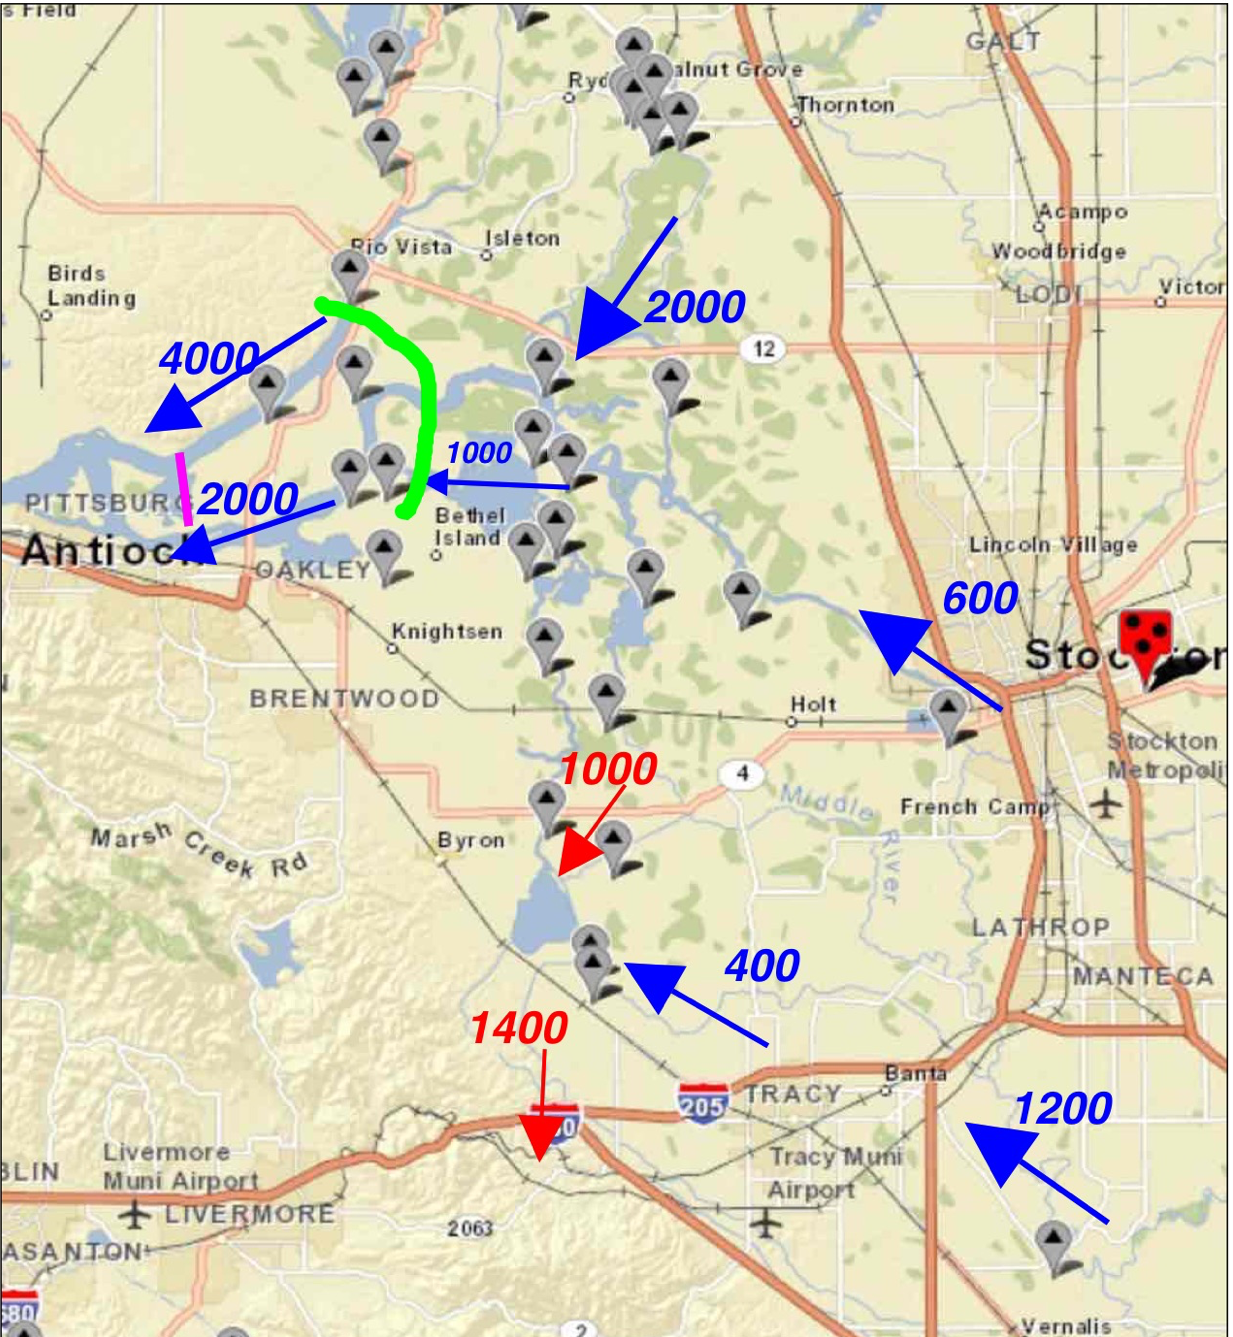
With the prescribed Net Delta Outflow Index at only 4000 cfs and measured outflow nearer to zero, the low salinity zone critical habitat of smelt is in the central Delta. Remaining smelt are being drawn across the Delta from north to south to the export pumps. Under these conditions the first heat wave of late spring will heat the central Delta to lethal 23-25°C levels for smelt. Unless these conditions are changed by increasing outflow and reducing exports, both smelt species may go virtually extinct2 this spring.
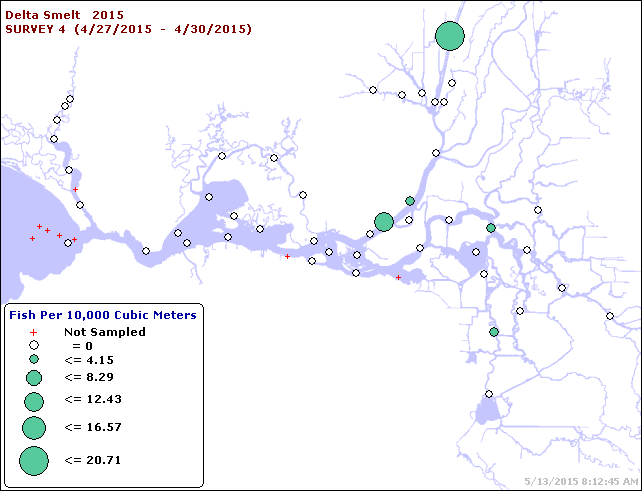
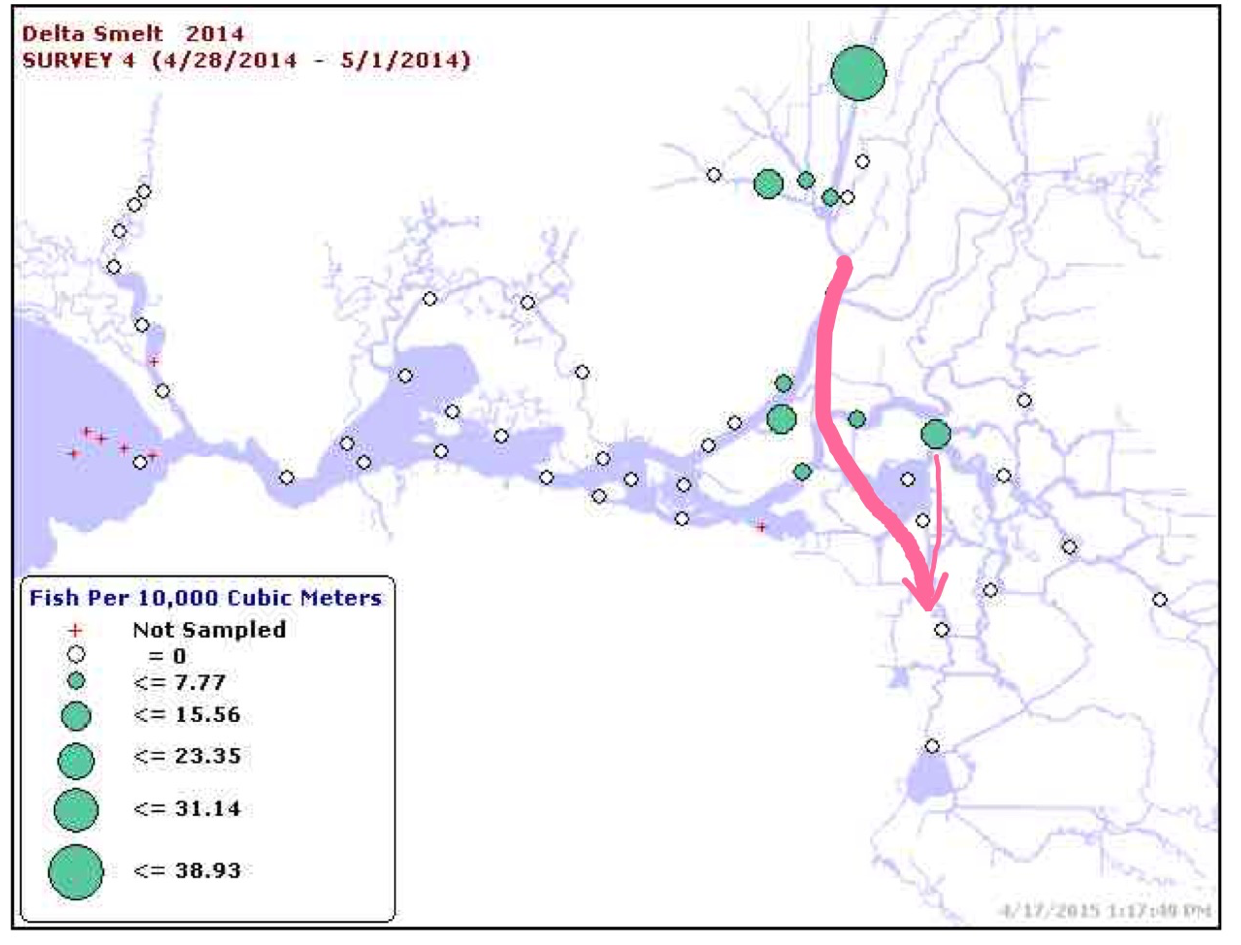
Figure 1. Delta Smelt density distribution in late April 20-mm Survey. Only three were captured in Sacramento Deep-Water Ship Channel, compared to 20 in previous week’s survey.
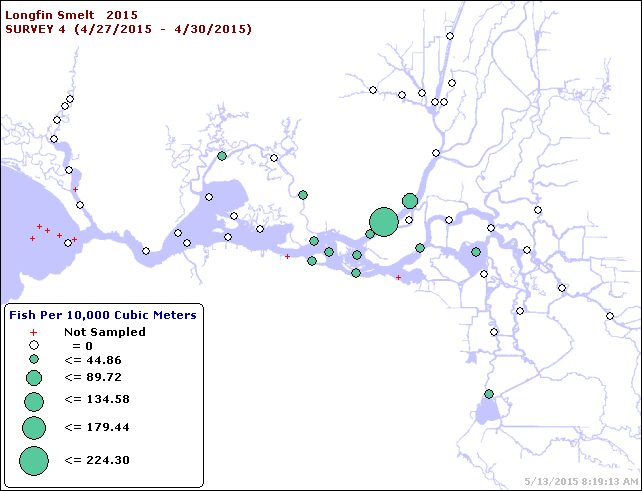
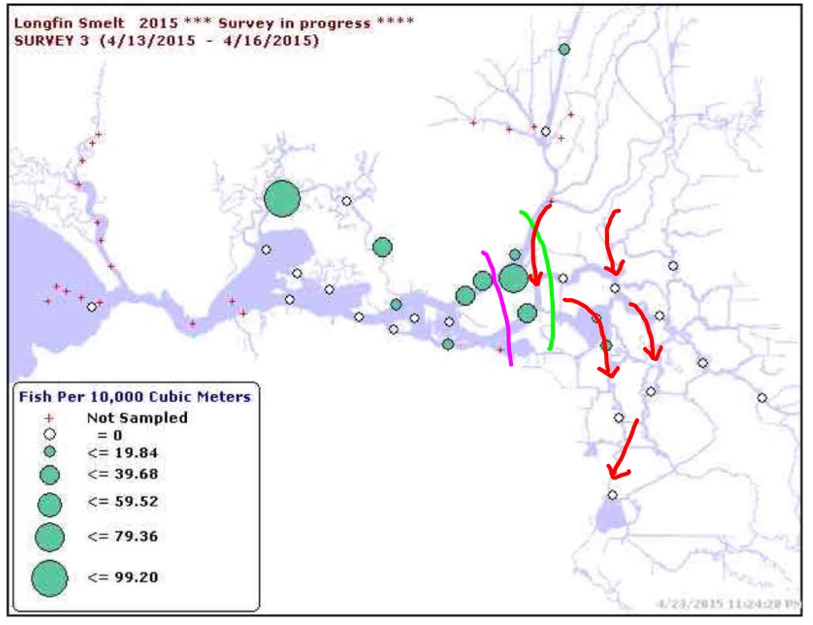
Figure 2. Longfin Smelt density distribution in late April 20-mm Survey
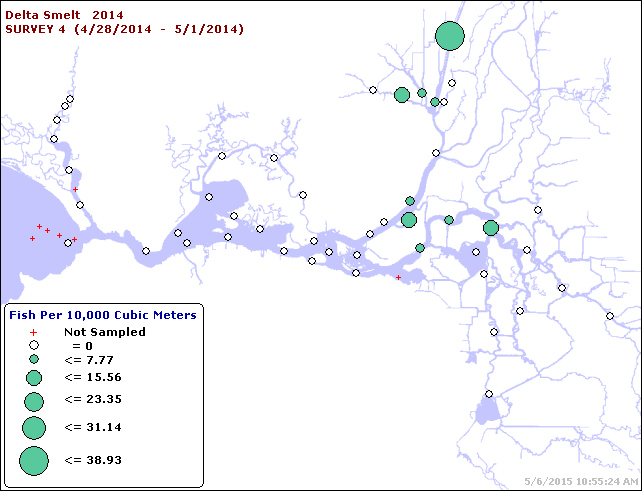
Figure 3. Delta Smelt density distribution in late April, 2014 20-mm Survey.
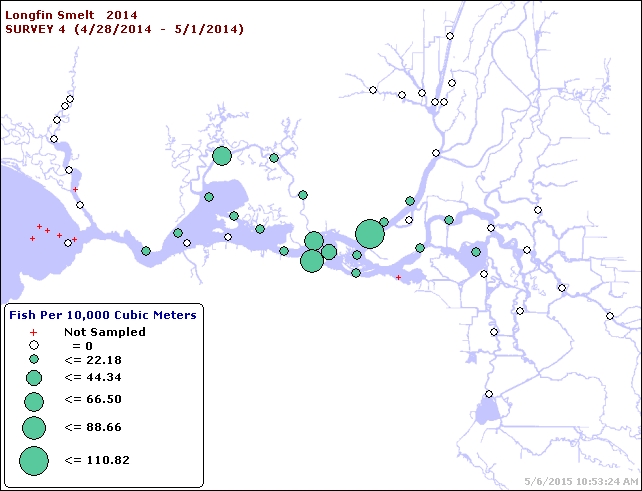
Figure 4. Longfin Smelt density distribution in late April, 2014 20-mm Survey
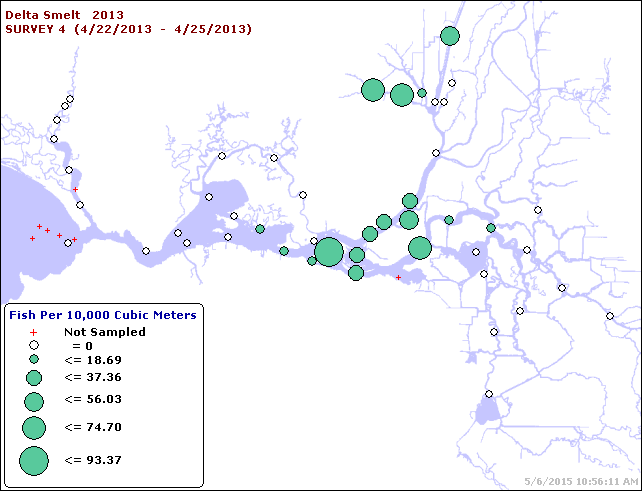
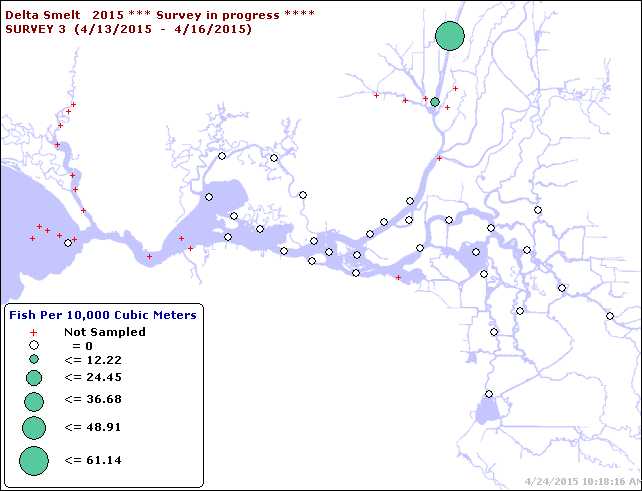
Figure 5. Delta Smelt density distribution in late April, 2013 20-mm Survey.
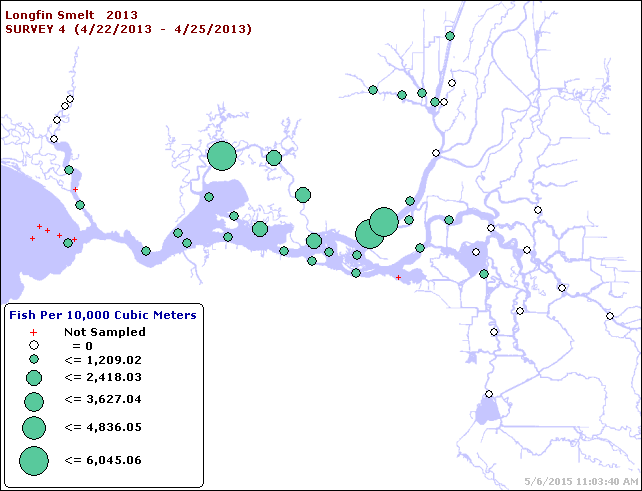
Figure 6. Longfin Smelt density distribution in late April, 2013 20-mm Survey.
- http://www.fws.gov/sfbaydelta/documents/smelt_working_group/swg_notes_5_4_2015.pdf ↩
- Virtually extinct means we should not expect to see any next year. ↩