Phantom Predator – Striped Bass?

In a recent 2020 essay in SAN FRANCISCO ESTUARY & WATERSHED SCIENCE, authors Nobriga and Smith describe striped bass as a “phantom predator” that for a century has been secretly driving down their “naïve prey,” the Delta smelt. The authors hypothesize that Delta smelt were much more abundant that the earliest regular monitoring data would indicate, and that striped bass did most of this damage to the Delta smelt population before there was widespread monitoring of either Delta smelt or striped bass.

The authors’ analyses, interpretations, and conclusions have a major omission. They fail to include the potential role of other native and non-native predatory fish in driving down the population of Delta smelt, regardless of the actual abundance of Delta smelt in the eighty years after stripers were introduced to the Bay-Delta in 1879 and 1882. Dozens of other predatory species also proliferated in the Delta over that past century, especially over the past several decades. Today, those other predatory species are far more abundant than the striped bass, and many are equal if not greater potential predators on young smelt than striped bass. In fact, striped bass are more likely to prey on juveniles and adults of other predator species than on smelt.

The authors are from the US Fish and Wildlife Service, the federal agency bound to protect the Delta smelt under the Endangered Species Act. The authors used “California Department of Fish and Wildlife fish monitoring data to provide evidence for a ‘phantom predator’ hypothesis: that ephemeral but persistent predation by Striped Bass helped to marginalize Delta Smelt before the estuary was routinely biologically monitored.”, The authors argue against “a misinterpretation that Striped Bass had little contemporary effect on Delta Smelt,” and “contend that the Delta Smelt population has declined steadily since Striped Bass were introduced to the estuary, and that has masked a substantial predatory effect of Striped Bass on Delta Smelt.” The article describes and supports a hypothesis that striped bass remain a problem for Delta smelt, despite the precipitous decline in the production of juvenile striped bass over the past century or so.

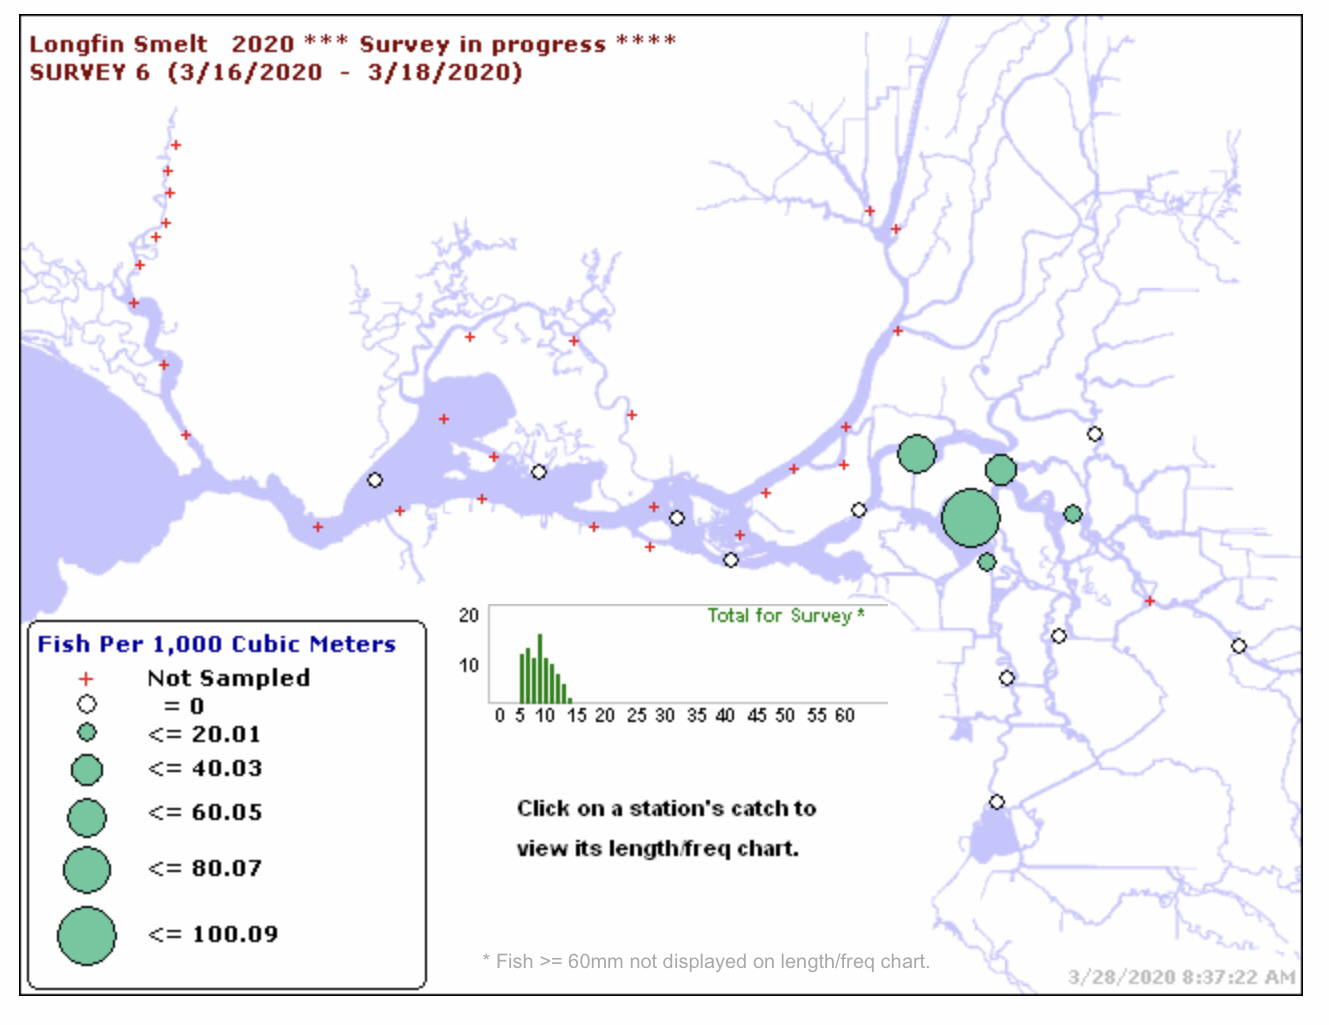
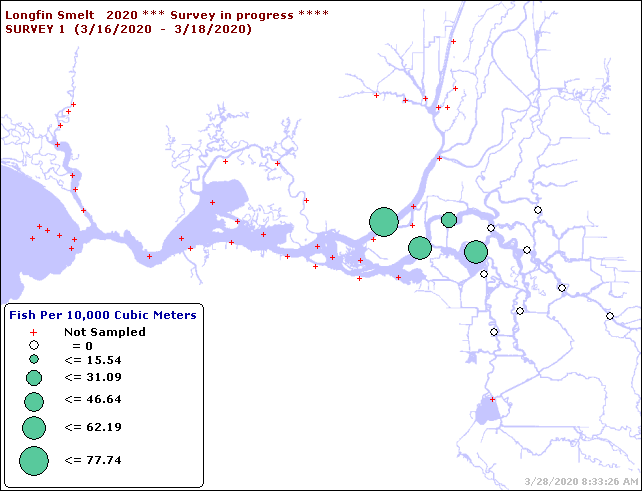
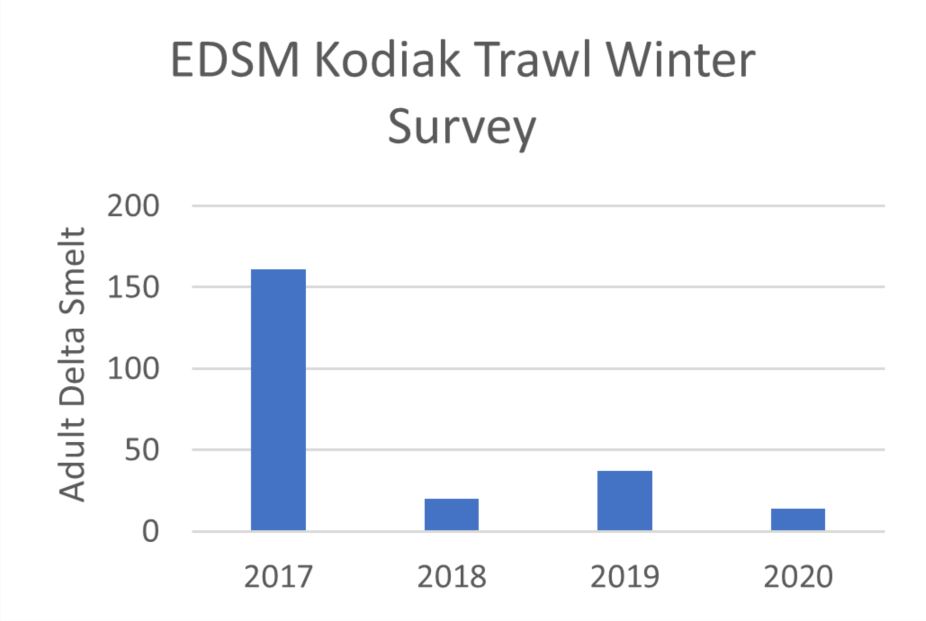
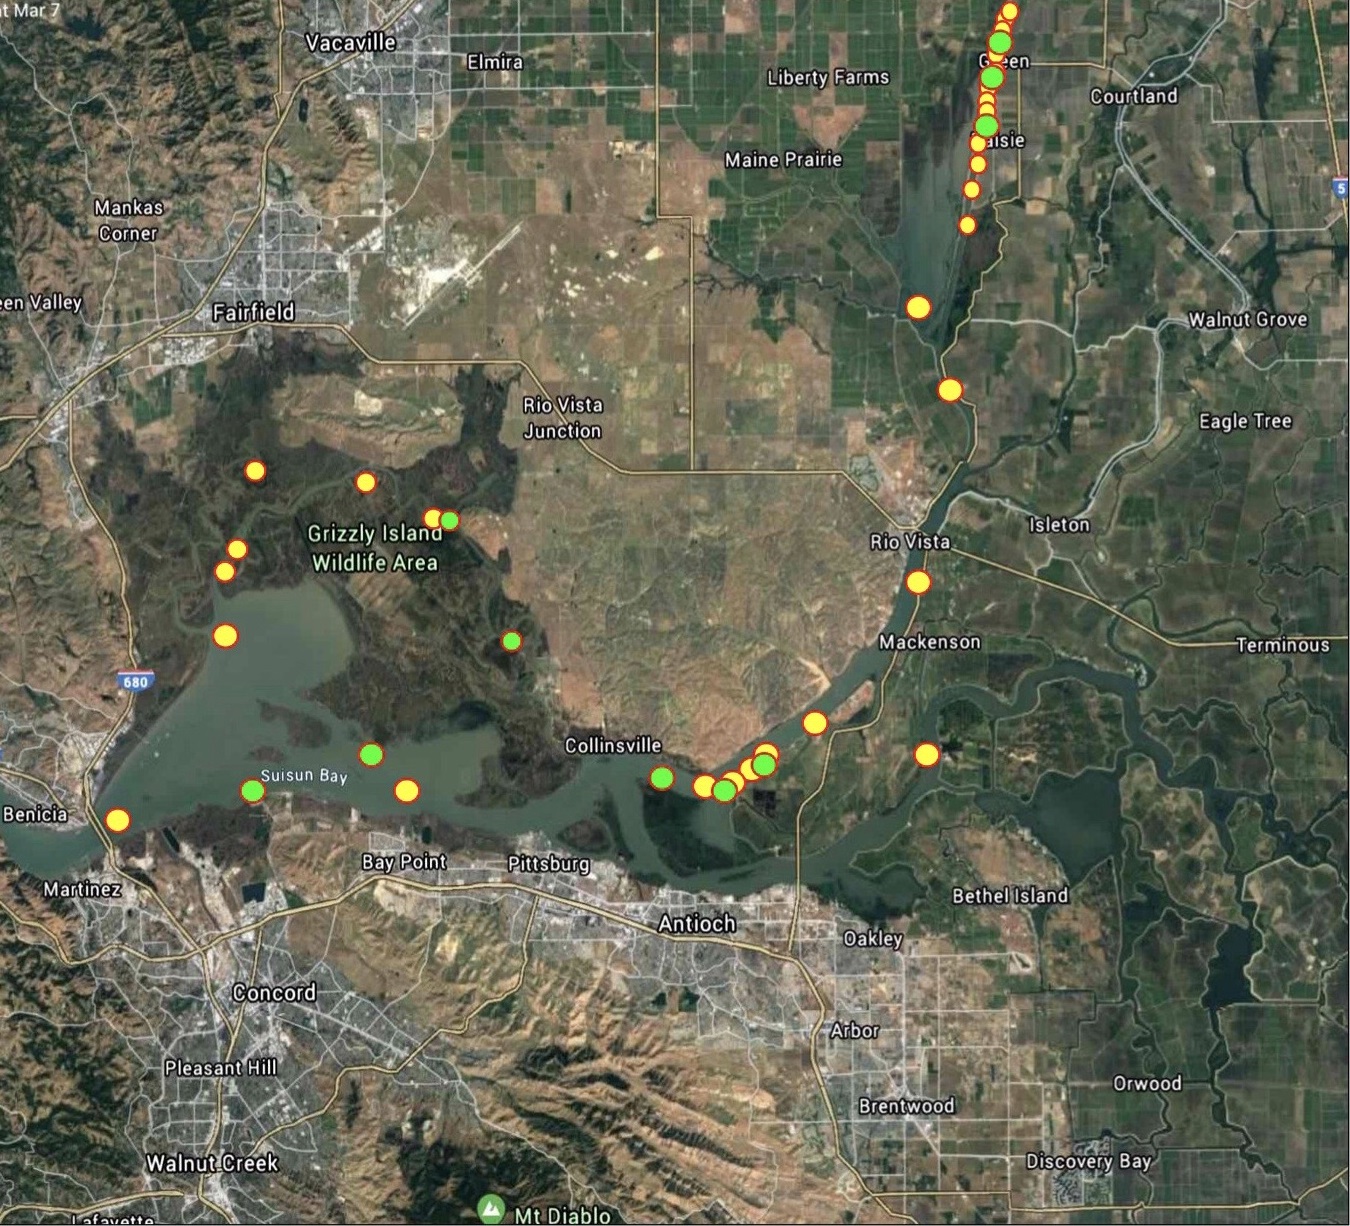
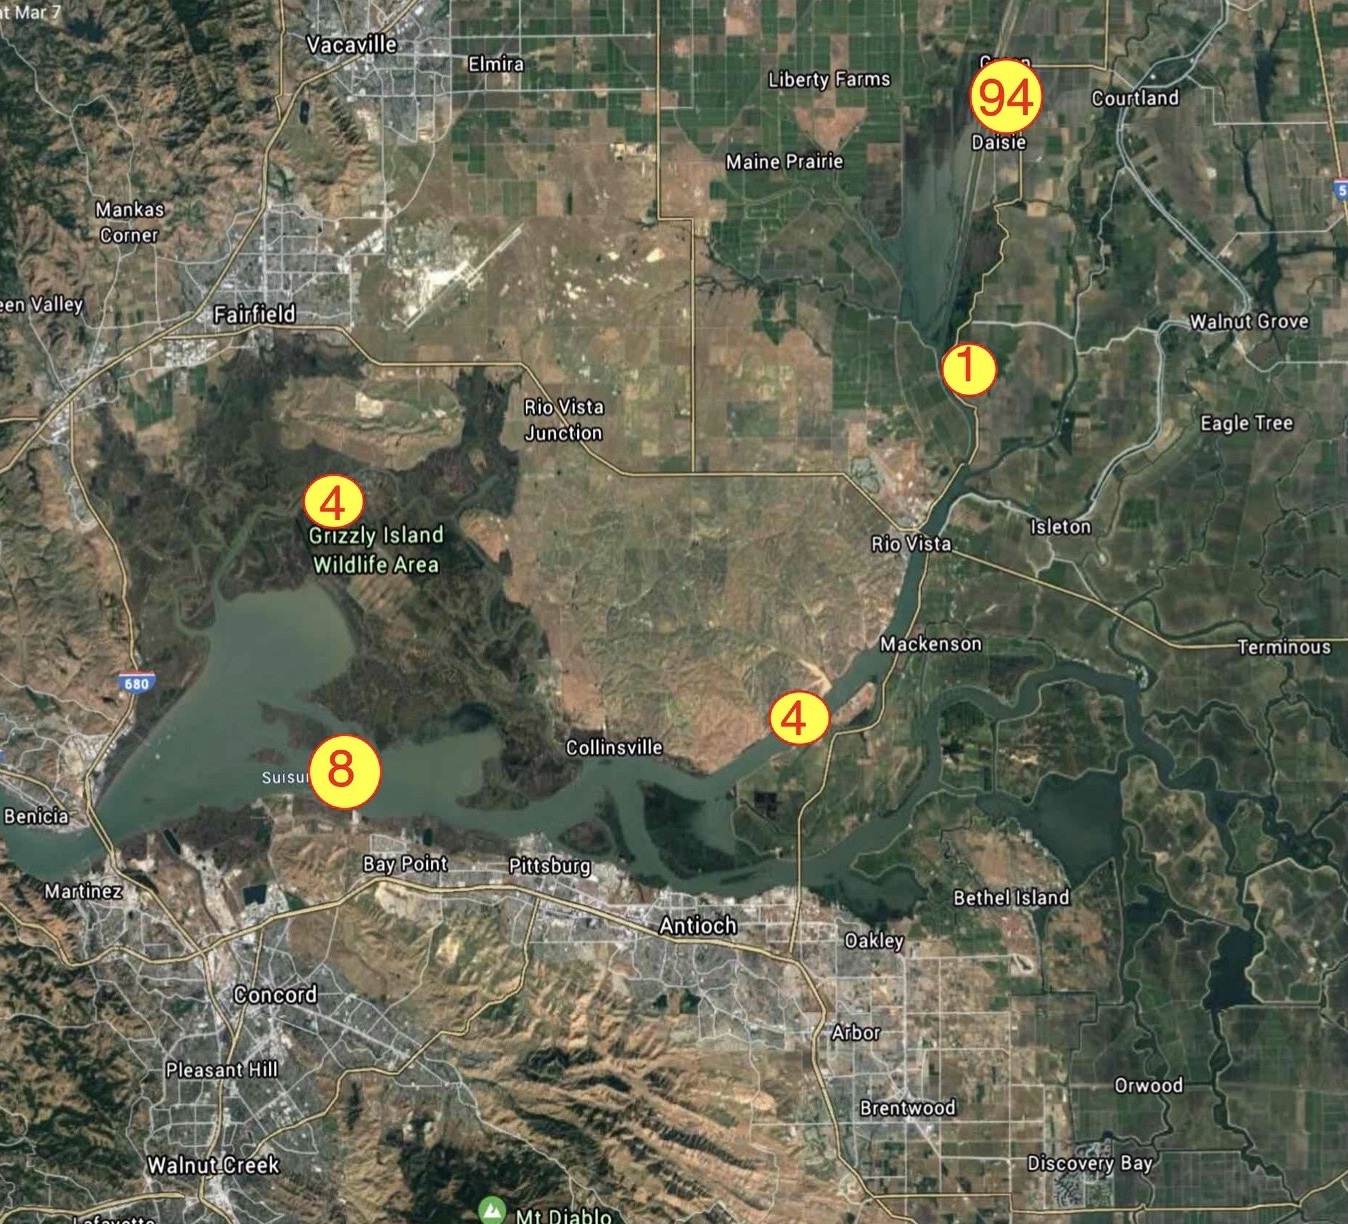
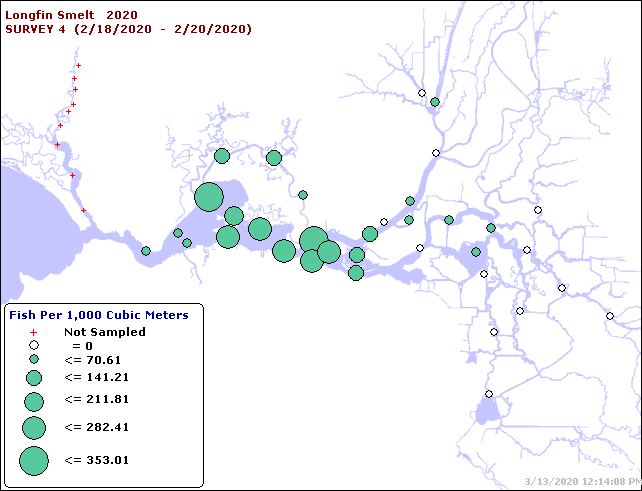
To partially address the hypothesis myself, I analyzed some Interagency Environment Program (IEP) data1 collected over the decade of 2009-2018 from one of the remaining Delta smelt strongholds – the lower Yolo Bypass portion of the Cache Slough Complex of the north Delta (Figure 1). Delta smelt were a common seasonal resident of the area (Figure 2). Striped bass, as expected, were very abundant in all age groups over much of the survey periods (Figure 3). But so were many species of invasive non-native catfish, sunfish, crappie, gobies, minnows, tule perch, black bass, and shad, most of which have been present in the Delta as long as striped bass.

Black crappie alone make up an equivalent or greater predator force on Delta smelt (Figure 4). In addition, black crappie as well as many of the other abundant predators compete with Delta smelt for their common zooplankton food supply. Not one of these potential other sources of predation or competition is mentioned in the essay.

Nobriga and Smith do acknowledge: “A generalist predator like Striped Bass, however, could suppress Delta Smelt competitors in addition to Delta Smelt, leading to non-linear and counter-intuitive community dynamics” – a theory that once-abundant striped bass have been suppressing other non-native predators and competitors of Delta smelt. So how long has that dynamic been functioning? Was it functioning in the hypothesized epoch of “phantom” predation? Did striped bass accelerate the decline of Delta smelt or, by eating and consuming other predators, slow it down? And assuming that Delta smelt really were much more abundant than previously believed prior to widespread monitoring in the Delta, to what degree was predation a factor in that decline?

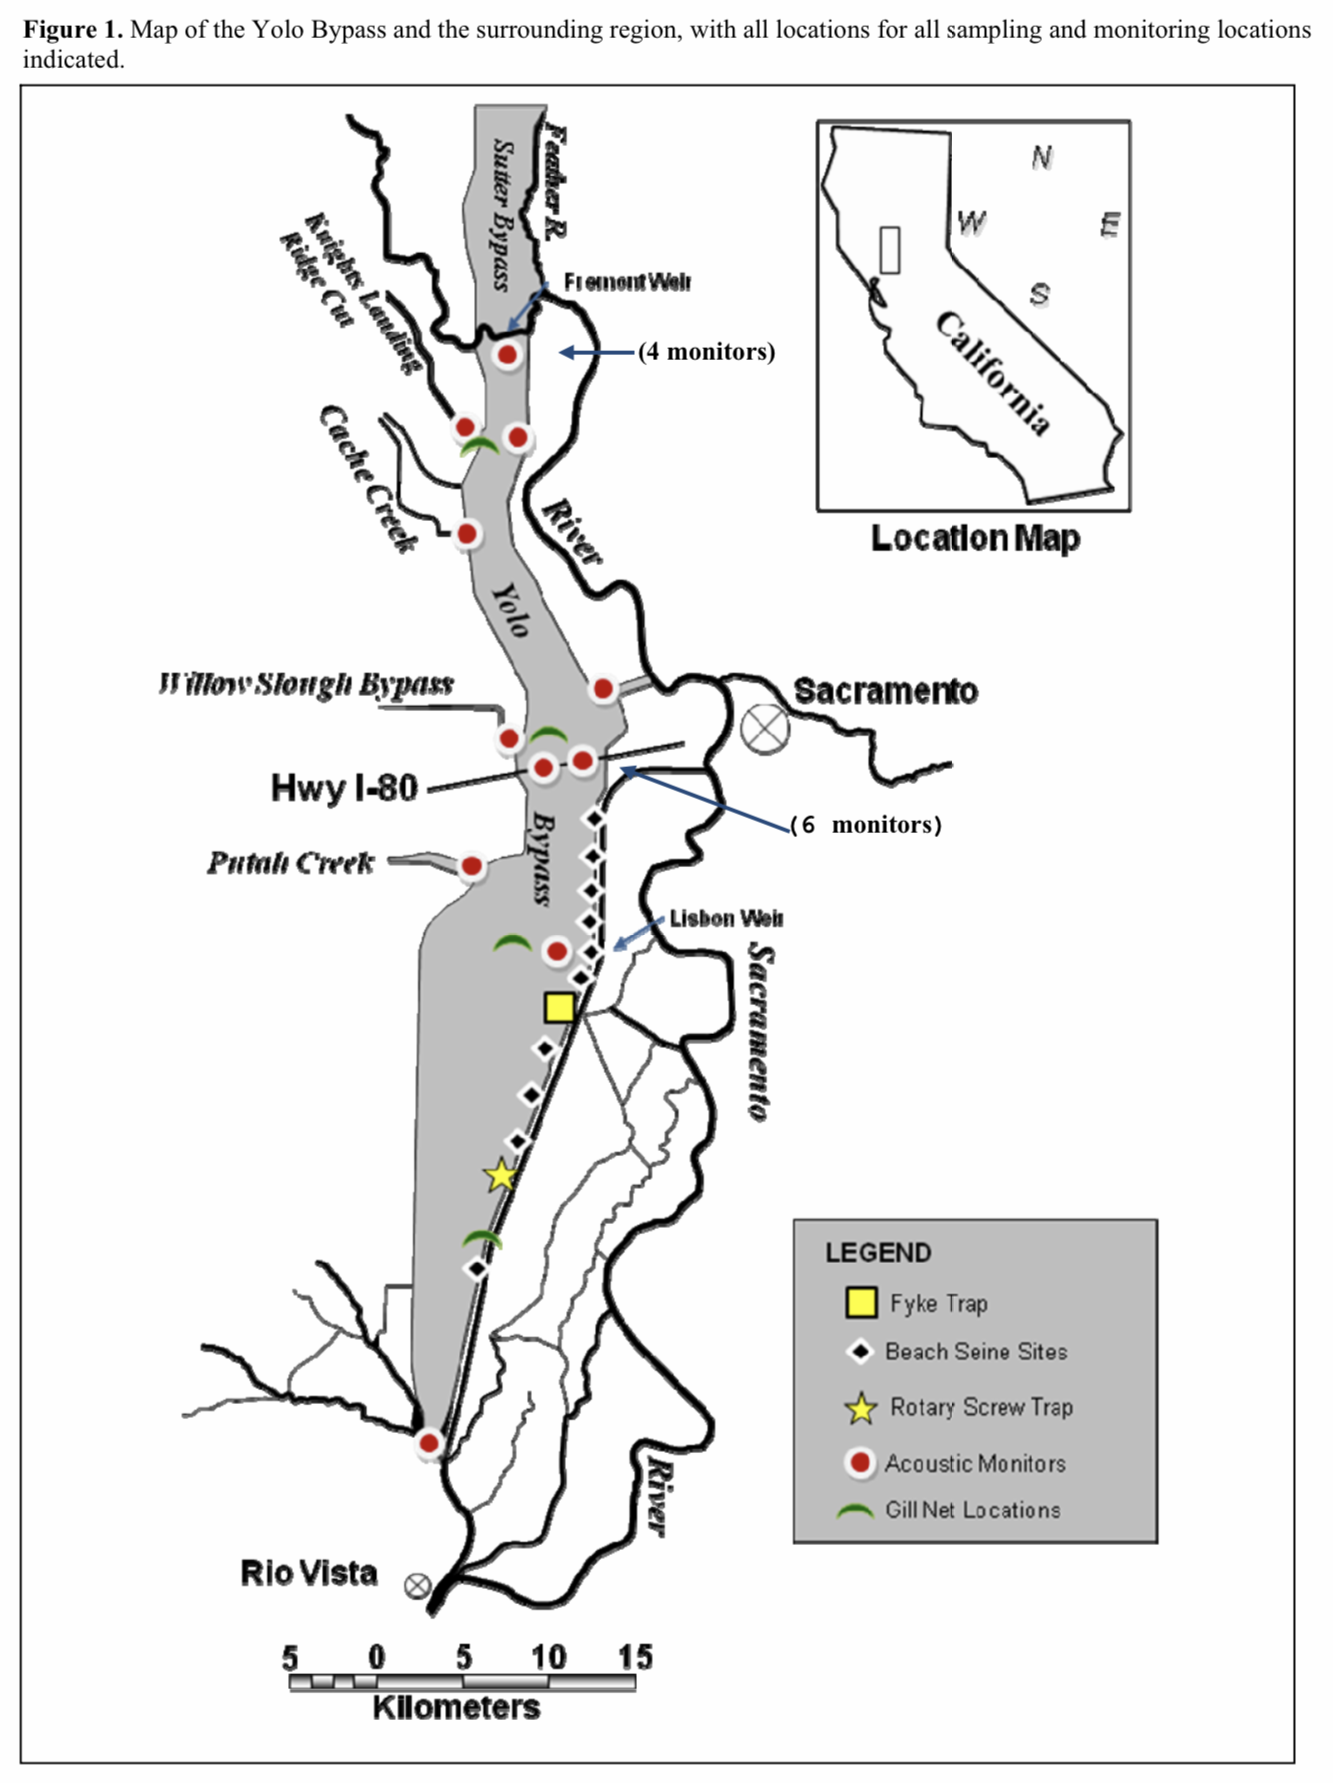
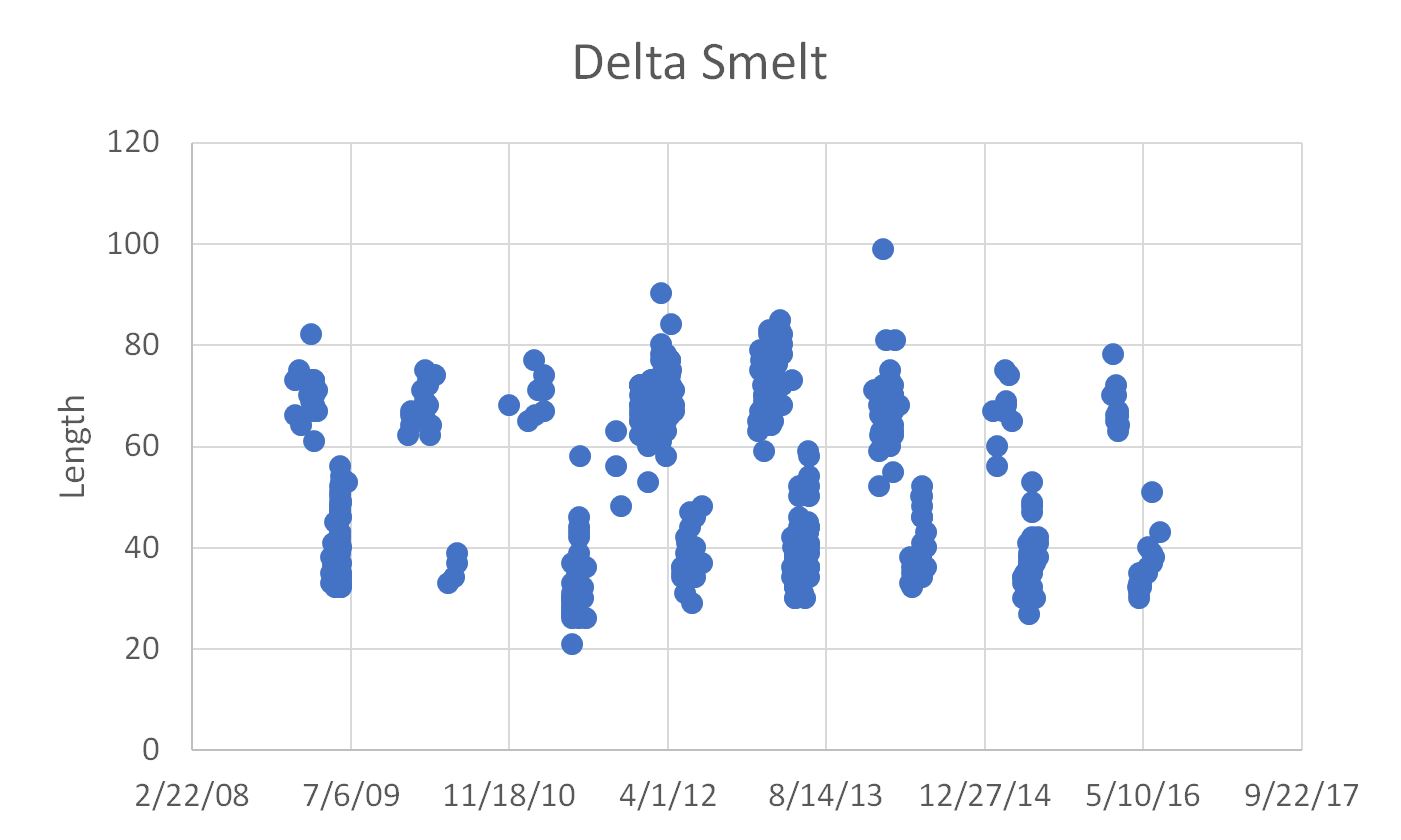
Figure 2. Lengths of Delta smelt collected in fish surveys in lower Yolo Bypass 2009-2018. Note that up to 70% of the smaller young 20-60 mm smelt were later genetically identified as Wakasagi.

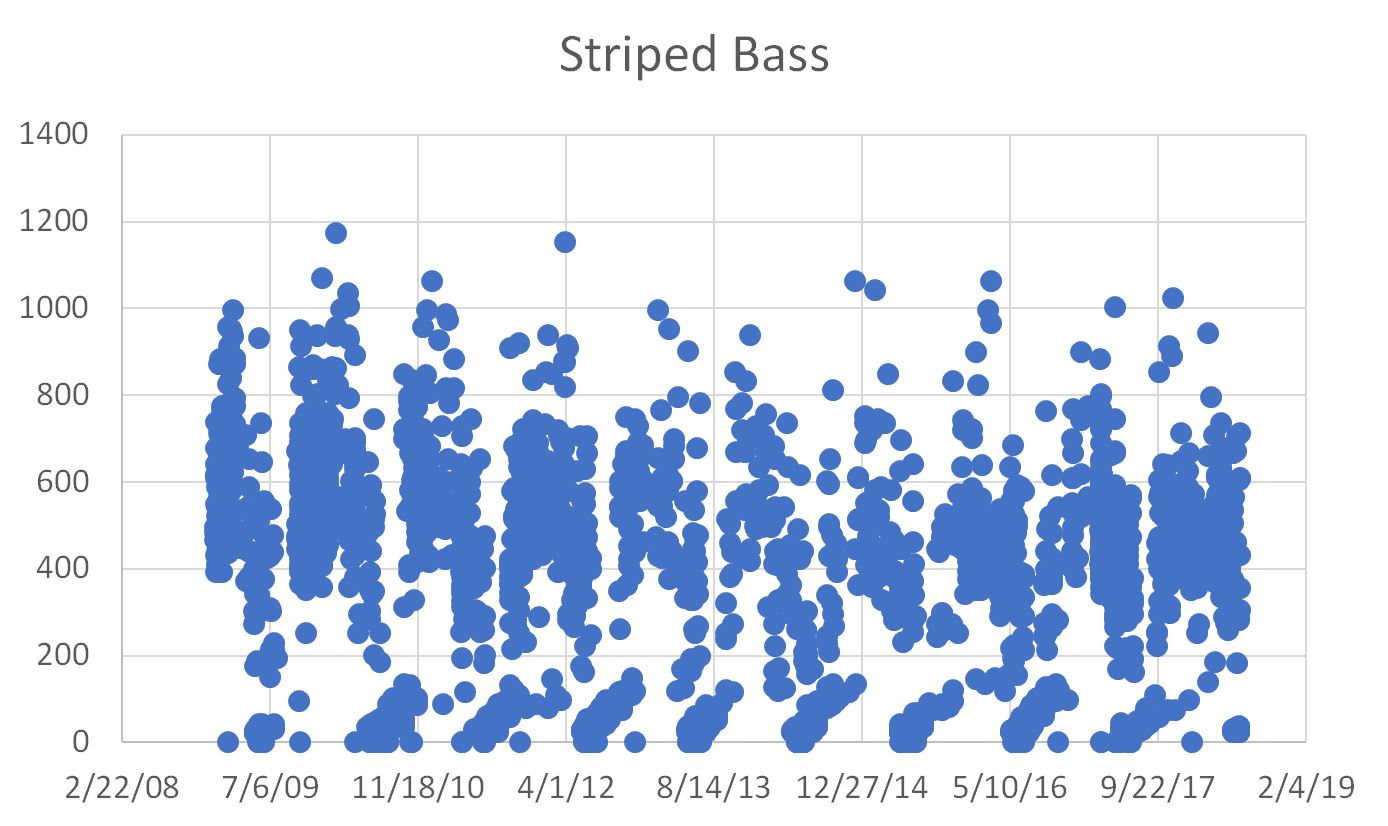
Figure 3. Lengths of striped bass collected in fish surveys in lower Yolo Bypass 2009-2018.

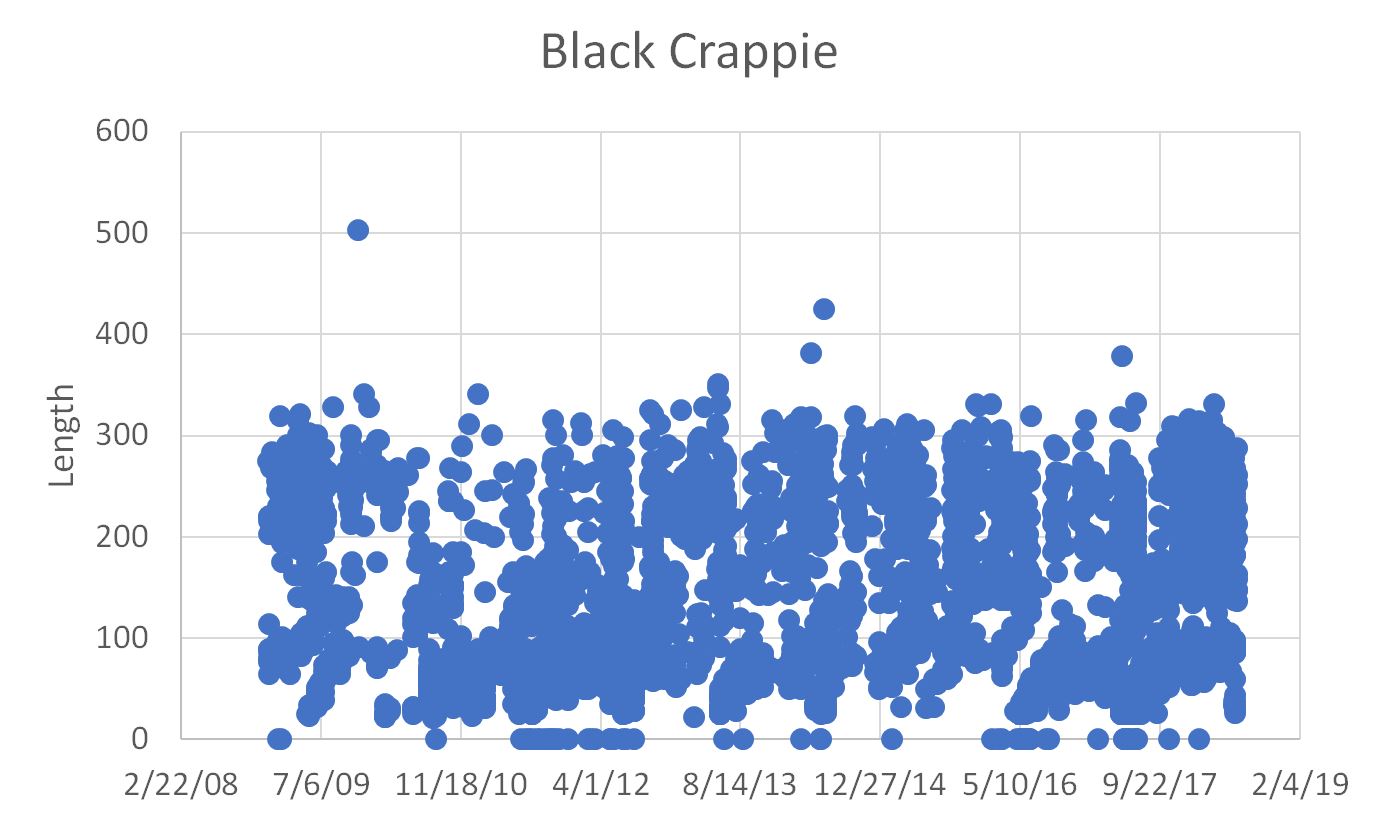
Figure 3. Lengths of black crappie collected in fish surveys in lower Yolo Bypass 2009-2018.

Delta Smelt Recovery Strategies – Winter 2020 Update

The Delta smelt are in trouble. The state and federal programs to help smelt recover are failing to meet their goals. The Delta Smelt Resilience Strategy adopted in 2016 is the State’s program to save Delta smelt. The State Strategy is not working, and has perhaps even made things worse in the four below normal and wet years that the state strategy has been applied since the 2013-2015 drought. This failure may explain why the strategy document is stored as a “legacy” file on the California Natural Resources Agency’s website.

The State’s Strategy consists of a number of action programs to help smelt:

  • Aquatic Weed Control
  • North Delta Food Web Adaptive Management Projects
  • Delta Outflow Augmentation
  • Reoperation of the Suisun Marsh Salinity Control Gates
  • Sediment Supplementation in the Low Salinity Zone
  • Spawning Habitat Augmentation
  • Roaring River Distribution System Food Production
  • Coordinate Managed Wetland Flood and Drain Operations in Suisun Marsh
  • Adjust Fish Salvage Operations during Summer and Fall
  • Stormwater Discharge Management
  • Rio Vista Research Station and Fish Technology Center
  • Near-term Delta Smelt Habitat Restoration
  • Franks Tract Restoration Feasibility Study

When the Delta Stewardship Council last took a close look on progress of the State Strategy in 2019 it found little that was encouraging. It identified two actions that showed promise: hatchery supplementation of Delta smelt and the operation of the Suisun Marsh Salinity Control Gates (SMSCG). More recently, the State has stated in its February 20, 2020 lawsuit against the Bureau of Reclamation that the Delta smelt hatchery program is not reasonably certain to have positive benefits.

The Federal Strategy shows even less progress and little future promise. The Federal Strategy consists of a number of action programs to “help” smelt while further reducing water allocated to their recovery:

  • Delta Smelt Outflow Action
  • Operations of the Suisun Marsh Salinity Control Gates
  • Directed Outflow Project (DOP)
  • Mesocosm (Cage) Studies – cultured smelt raised in cages
  • EDSM: Endangered Delta Smelt Monitoring is a year-round weekly sampling program administered by the Service and voluntarily funded by Reclamation.
  • Drivers of Delta Smelt Health Study
  • The Salinity and Growth History of Delta Smelt Study
  • The Delta Outflow Augmentation Modeling Study
  • Roaring River Distribution System Restoration: Experimentally produces food through wetland management in the Suisun Bay and Marsh.
  • Sacramento Deepwater Ship Channel nutrient manipulation involving experimentally seeding nutrients in the Deepwater Ship Channel to enhance productivity in Cache Slough.

It is worth noting that while both the State and federal programs point to the importance of Delta outflow, the latest State and federal operating plans for the Delta both propose to reduce outflow compared to recent past operations. Reducing outflow requirements leads to higher Delta exports.

Below, I summarize results of two experiments to increase north Delta smelt food production in 2019.

In a prior update in October 2018, I opined that the benefits of 2018 north Delta food actions were questionable, despite optimism by the state and federal programs. The actions were applied again in 2019, with results similar to those in 2018. During September 2019, approximately 600-800 cfs of river and ag-return water (Figure 1) was routed down the Colusa Basin Drain and through the Yolo Bypass into the north Delta at Cache Slough near Rio Vista. As in 2018, the Lisbon gage indicated depressed levels of dissolved oxygen (Figure 2), reflecting the high organic load in drain water from the agricultural Colusa and Yolo Basins carried in the Colusa Basin Drain. Though the organic load was higher in 2019, the level of chlorophyll (algae) was lower at the Lisbon gage (Figure 3) and in the north Delta (Figure 4). The organic load was accompanied by an increase in nutrient and mineral components (salts) (Figure 5). Normally, higher dissolved oxygen depressing organic loads and higher salt levels are considered pollution; however, in this case, high levels are designated as “fertilizer” with the ascribed benefit of producing more food for smelt in the Delta.

Reclamation’s attempt to stimulate food production by “fertilizing” the Deepwater Shipping Channel adjacent to the lower Yolo Bypass involved dispersal of 6 tons of nitrate salts via crop dusters (Figure 6) in August 2019. There may have been some limited stimulus of chlorophyll production in the Sacramento channel near Rio Vista (Figure 4) and in the lower Ship Channel (Figure 7). However, the chlorophyll concentrations in the middle (Figure 8) and upper (Figure 9) Ship Channel showed little or no response to the “fertilizing” effort.

In conclusion, the state and federal strategies to help recovery of Delta smelt either lack progress or show little if any benefit in terms of smelt food production and smelt reproduction. The federal Enhanced Delta Smelt Monitoring Program’s (EDSM) intensive survey of adult Delta smelt over the past four winters indicates further declining numbers (see chart immediately below).

Figure 1. Flow in tidal lower Yolo Bypass at Lisbon Weir gage near I-80 causeway in summer 2019.

Figure 2. Dissolved oxygen levels at Lisbon gage in the lower Yolo Bypass in summer 2019.

Figure 3. Chlorophll levels at Lisbon gage in the lower Yolo Bypass in summer 2019.

Figure 4. Chlorophyll concentrations in the north Delta channel of Sacramento below the mouth of Cache Slough near Rio Vista in summer-fall 2019.

Figure 5. Electrical conductivity recorded in the lower Yolo Bypass near Liberty Island in summer 2019.

Figure 6. Crop dusting fertilizing in Ship Channel August 2019. Reclamation photo.

Figure 7. Lower Ship Channel chlorophyll concentrations summer-fall 2019.

Figure 8. Middle Ship Channel chlorophyll concentrations summer-fall 2019.

Figure 9. Upper Ship Channel chlorophyll concentrations summer-fall 2019.

No Miracle March for Delta Fish

A nice spurt of Delta inflow and outflow occurred during mid-March 2020 (Figure 1). In past dry winters, this would have been a life saver for many juvenile salmon and smelt in the Delta. But this March brought no miracles for Delta fish. Without new rules for the State Water Project (SWP), the Project’s Banks pumping plant in the south Delta maxed out exports (Figure 2), just like the SWP did after last December’s storms.1  March exports have been just below the maximum export-to-inflow (E/I) ratio allowed by the State Water Board (35%). From 2009 through 2019, the state’s incidental take permit (ITP)2 limited exports by restricting negative flows in Old River and Middle River (OMR restrictions) to protect the state-listed longfin smelt and Delta smelt. Not so in the winter of 2020.

Longfin smelt need more protection. See Figures 3-7. In the past, March 2020 conditions would have been termed high risk by the Smelt Working Group. But the Smelt Working Group disappeared while the new federal Biological Opinions for Delta operations were making their entrance in late 2019. Although managers often ignored the recommendations of the Smelt Working Group, there was at least some outside technical documentation and accountability.

Meanwhile, the state’s soon-to-be-released new ITP looks like it will divert the discussions that the Smelt Working Group used to have to an in-house colloquy between the Department of Water Resources and the Department of Fish and Wildlife. The ITP also has provisions to allow more negative OMR’s and thus higher levels of exports during storm events. This will make fish in the Delta more dependent on miracles even as miracles become harder to come by.

Figure 1. March 2020 calculated Delta outflow. Source: CDWR.

Figure 2. March 2020 Delta exports. TRP = Federal Tracy Plant. HRO = state Harvey Banks Plant.

Figure 3. Early March 2020 Larval Survey for Longfin Smelt. Yellow denotes X2 location. Blue arrow denotes positive downstream Sacramento River channel flow. Red arrows denote interior Delta net flow direction. Pattern indicates risk to Longfin Smelt.

Figure 4. Mid March 2020 CDFW Larval Survey – partial survey results for longfin smelt.

Figure 5. Mid March 2020 CDFW 20-MM Survey – partial survey results for longfin smelt.

Figure 6. March 2020 Old and Middle River combined daily average flows in Central Delta. Source: USBR.

Figure 7. March 2020 tidally-filtered flows at three Delta locations that represent net Delta outflow. Note mid-March outflow (sum of three) was negative for several days. Source: USGS.

How many Delta Smelt Remain?

Because Delta smelt are now rarely being captured in regular CDFW fish surveys, the US Fish and Wildlife Service began the Enhanced Delta Smelt Monitoring Program (EDSM) in 2017.  Results for the first four years show adult Delta smelt are still around in winter spawning season – barely (Figure 1).  They continue to be found throughout the northern Delta and Suisun Bay/Marsh (Figure 2).  Hotspots (likely spawning concentrations) were in west Delta near Rio Vista and the Deepwater Ship Channel.  Juveniles continue to show up in EDSM summer surveys in the usual places (Figure 3).  There may be a few thousand adult Delta smelt left as of 2019/2020 based on US Fish and Wildlife Service estimates.

Figure 1. Catch of adult Delta smelt in winter EDSM Kodiak trawl surveys 2017-2020.

Figure 2. Locations where Delta smelt adults were captured in EDSM surveys in winter 2019 (yellow dots) and 2020 (green dots).

Figure 3. Locations where Delta smelt young were captured in EDSM surveys in July 2019. Circles represent regions. Numbers are total July catch in region. The 94 represents the young smelt captured in the Deepwater Ship Channel.


Delta Exports Reduced in Winter 2020 to Protect Salmon and Smelt

One of the ramifications of dry conditions in winter 2020 has been the need to cut Delta exports to protect salmon and smelt listed under the state and federal endangered species acts. Lack of rain has led to reduced Delta inflow and outflow (Figure 1), which in turn has required reductions in south Delta exports (Figure 1), per the state’s 2009 incidental take permit and the 2019 federal biological opinions.1

The state permit requirement is prescribed to protect longfin smelt, which need protection under the present circumstances (Figures 2 and 3). The permit’s mitigation prescription (Figure 4) is to limit exports by limiting how negative flows in Old and Middle River (OMR) in the central Delta can get. Under the permit, negative OMR flows have generally been limited as early in the year as February in dry years like 2020; this limits exports and maintains Delta outflow. OMR flows were limited this winter (Figure 5). The mid-February survey (Figure 6) indicated a continuing risk that smelt larvae would be drawn into the central Delta if exports were increased. Exports have in fact increased (Figure 1) and OMR flow has become more negative (Figure 5) in March, increasing the risk to smelt despite being within limits set (Figure 4). March surveys should portray the effect of the increased risk factors.

The new federal take permits (BOs) are supposed to protect listed winter-run and spring-run salmon, Delta smelt, and steelhead, as well as the essential habitat of all the salmon, whose young are found in large numbers in the Delta in winter (Figure 7). Protections for these fish under the new BOs are vague at best.

Meanwhile, the state is in the process of developing a new incidental take permit that will cover winter-run and spring-run Chinook salmon and Delta smelt as well as longfin smelt. The risks to Delta fish are real. To be effective, the new ITP at minimum should not let spring outflow from the Delta fall below 10,000 cfs, and it should require maintaining February OMR levels during periods of low Delta inflow at the levels they were in February 2020 (Figure 5). This greater level of export restrictions should be required in each year with low Delta inflows until such time as the longfin smelt have grown out of the larval stage and moved downstream into the Bay. Even this level of protection may not protect the population from significant losses.

Figure 1. Delta outflow and exports in winter 2020. TRP=federal exports , HRO=state exports, DTO=outflow, FPT=Freeport Sacramento River inflow.

Figure 2. The catch density distribution of longfin smelt larvae in early February 2020 Smelt Larva Survey. Red arrow denotes direction of net flow in central and south Delta toward south Delta export pumping plants during survey period.

Figure 3. The catch density distribution of longfin smelt larvae in early February 2012 Smelt Larva Survey. Red arrow denotes direction of net flow in central and south Delta toward south Delta export pumping plants during survey period.

Figure 4. Permit Condition #5.2 from 2009 state longfin smelt incidental take permit.

Figure 5. Combined Old and Middle River flows in winter 2020.

Figure 6. The catch density distribution of longfin smelt larvae in mid-February 2020.
Source: Smelt Larva Survey.

Figure 7. Daily Catch of juvenile salmon upstream of Delta at Knight’s Landing fall-winter of water year 2020.