The Smelt Working Group in its April 13 meeting notes1 confirmed that the Spring Kodiak Trawl Survey has recorded record low numbers of adult Delta Smelt in both its March and April surveys. The record lows are consistent with the record low 2014 Fall Midwater Trawl Index. The Group also noted few young Delta Smelt have been collected in the April Smelt Larval and 20-mm surveys. No fisheries agency has objected to State Water Board’s April 6 Order in which the Board reduced the spring Delta outflow standard to 4000 cfs, reduced San Joaquin flow to 200-300 cfs, and moved the salinity standard location for X2 upstream to Threemile Slough provided South Delta exports are held to 1500 cfs.
Given the present state of the smelt populations, the expected habitat conditions this spring and summer will be extremely stressful to the minimal population of this year’s brood of young smelt. As was the case last year, young smelt will be confined to western, central, and northern Delta portions of the lower Sacramento River, lower San Joaquin River, Cache Slough, and Threemile Slough. Exports of 1500 cfs may be insignificant when Delta inflows are 20,000 cfs, but they are not insignificant when inflows are only 6000 cfs. In low inflow conditions, exports pull warm water into the Low Salinity Zone (LSZ), which along with its upstream position leads to lethal or near lethal water temperature (>23C) by the end of spring. Already, May water temperatures will reach or exceed 20°C. The exports also reduce the food productivity of the LSZ through the export of nutrients and plankton.
Mid-April conditions were not extreme (Figure 1) because a mandated San Joaquin River pulse flow kept flows moving in a general downstream direction. However, as the pulse flow ended in late April and the State Board Order took full effect, conditions for Delta Smelt deteriorated quickly (Figure 2). There were three primary negative effects:
- Reduced Delta outflow, which results in X2 and LSZ moving upstream. (Magenta arrow in Figure 2.)
- Negative net flow in Threemile Slough, which pulls Delta Smelt into the central Delta from the north Delta. (Red arrow located just south of Rio Vista in Figure 2.)
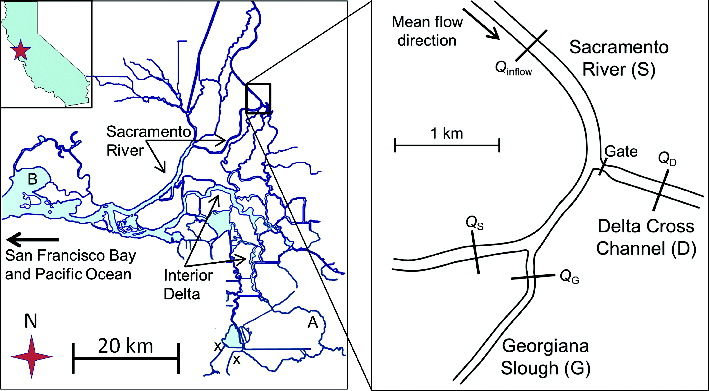
- Net flow from the north and central Delta toward south Delta export pumps (Figure 3).
Spring Actions
The following actions would reduce the negative effects on Delta Smelt:
- Increase Delta outflow by 1000-2000 cfs, at least during “spring tides”.
- Open the Delta Cross Channel during the daytime to increase inflow into the central Delta from northeast by 1000 cfs. (This would reduce net negative flows from north Delta to central Delta via Threemile Slough). Any effect on migrating Sacramento River salmonids can be largely mitigated by keeping the DCC open only in daytime.
Install Head-of-Old-River Barrier near Vernalis to limit movement of San Joaquin River salmonids into the south Delta. - Install False River Barrier to eliminate tidal pumping of LSZ and young Delta Smelt from Jersey Point into Franks Tract/Old River via False River (slough just north of Bethel Island).
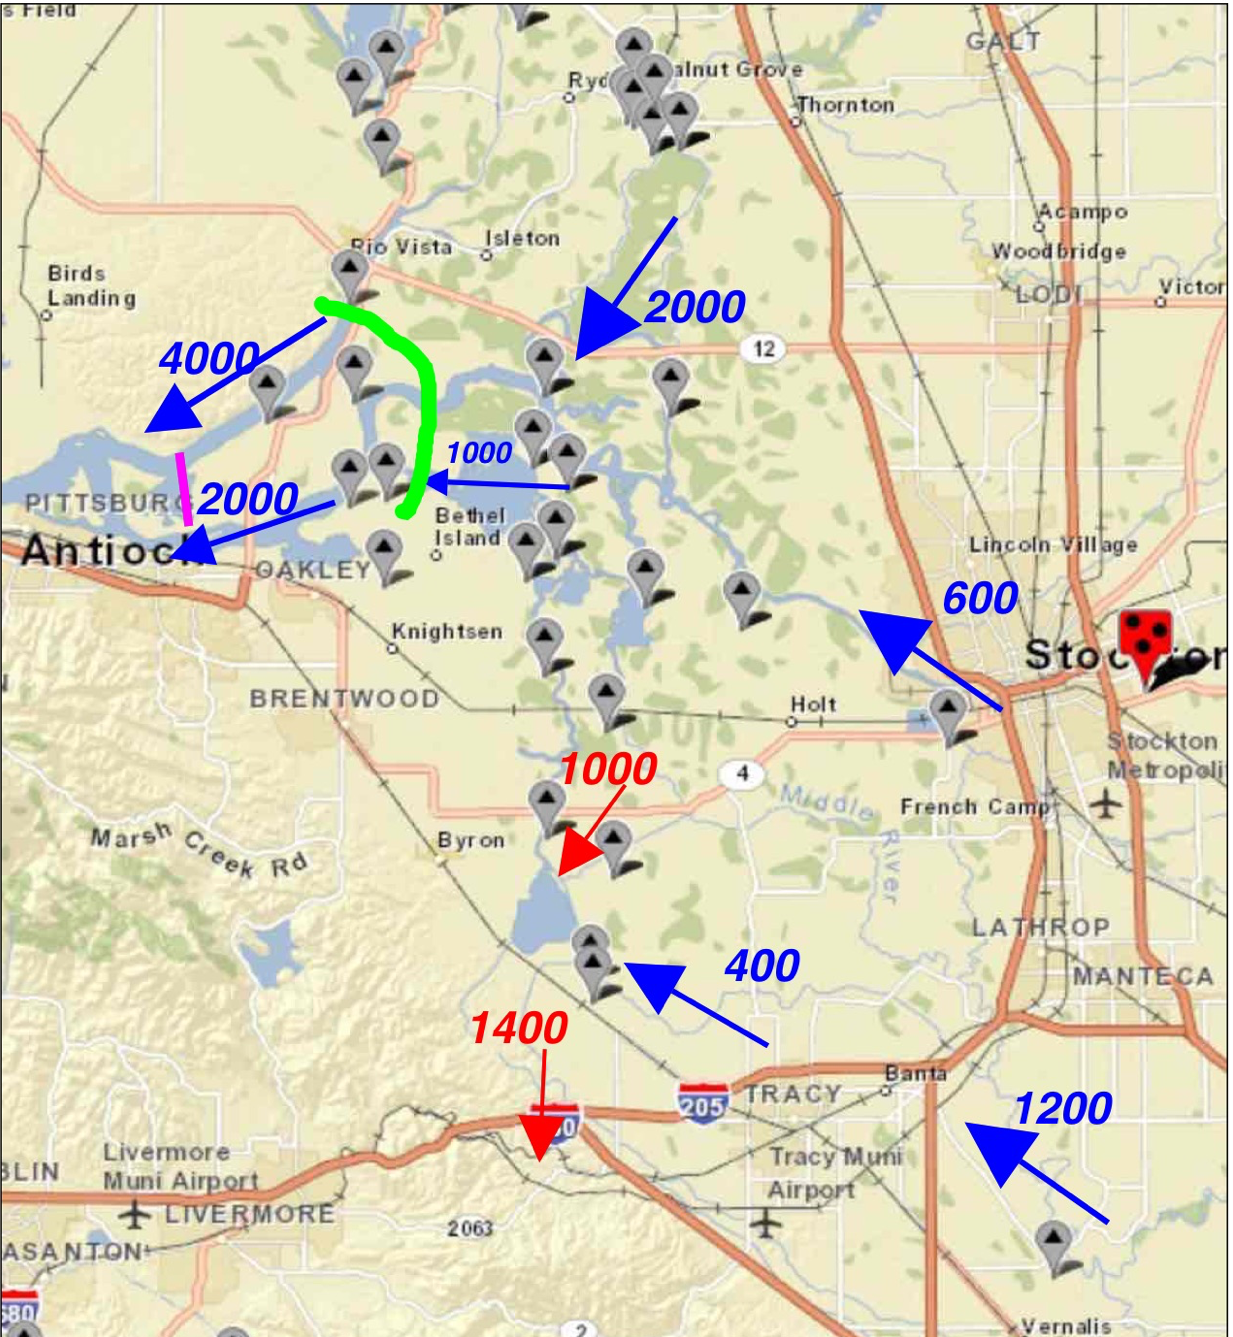
Figure 1. Mid-April 2015 approximate hydrology conditions in Delta. Blue arrows depict flow (cfs) in positive downstream direction. Red arrows depict OMR and export flows. Green line depicts location of head of Low Salinity Zone (500 EC) at low tide. Magenta line depicts average daily location of X2 (2700 EC). Delta Smelt young generally concentrate between the magenta and green lines in spring. (Map source: USGS with monitoring stations)

Figure 2. Expected late-April through May 2015 approximate hydrology conditions in Delta. Blue arrows depict flow (cfs) in positive net downstream direction. Red arrows depict OMR and export flows. Green line depicts location of head of Low Salinity Zone (500 EC) at low tide. Magenta line depicts average daily location of X2 (2700 EC). Delta Smelt young generally concentrate between the magenta and green lines in spring.
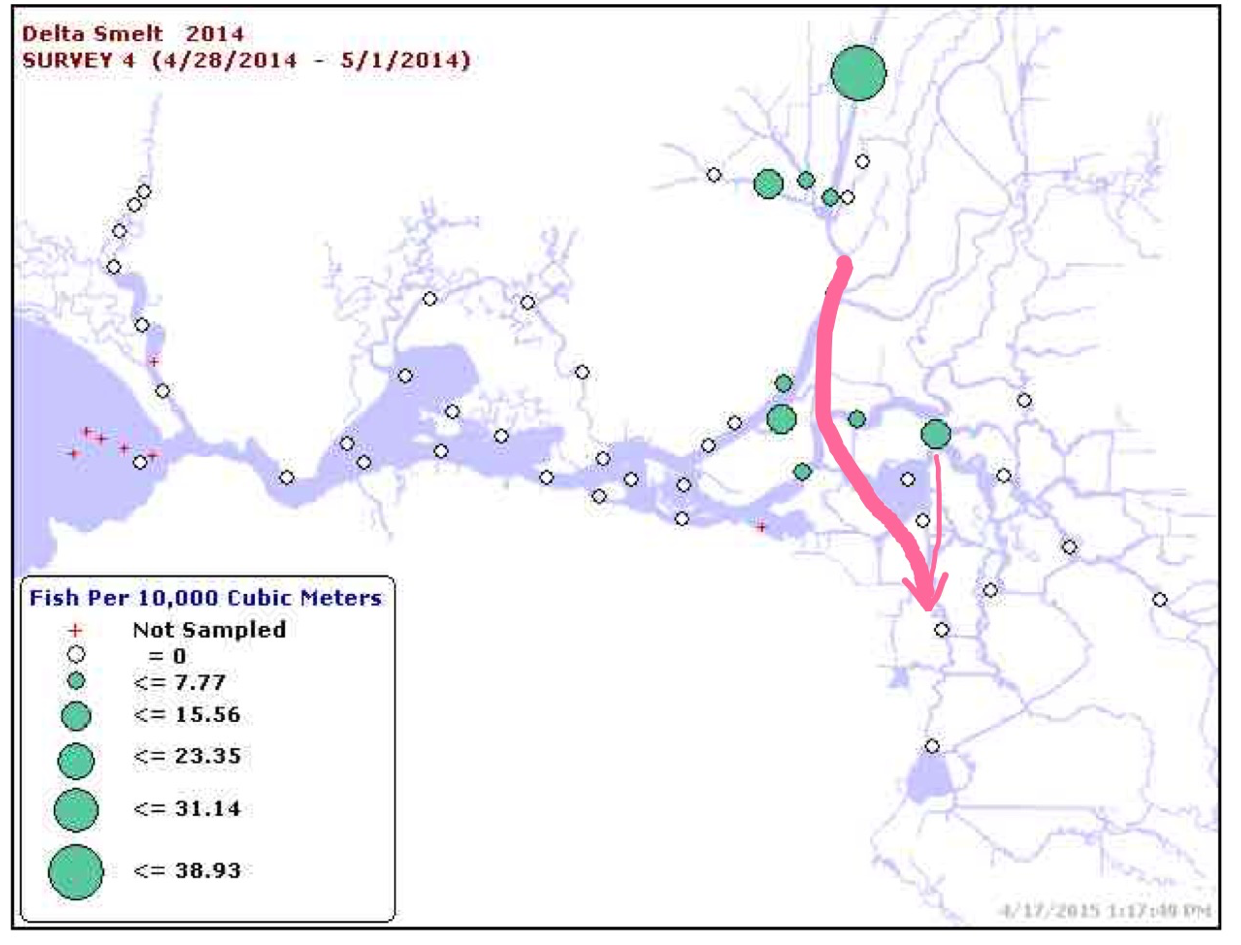
Figure 3. Location of Delta Smelt larvae in late April – early May 2014 from Smelt Larvae Survey. Arrows indicate primary net flow routes of larval smelt from North and Central Delta to South Delta.
- http://www.fws.gov/sfbaydelta/documents/smelt_working_group/swg_notes_4_13_2015.pdf ↩