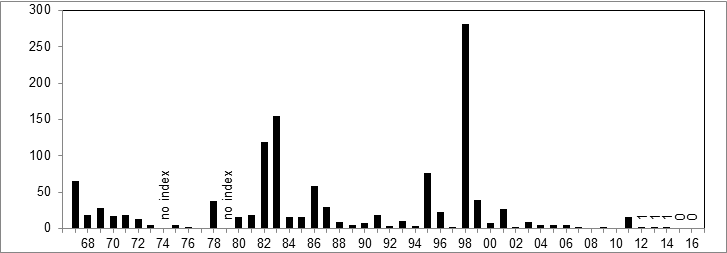
The prognosis for winter-run Chinook salmon is not good following very poor survival of the 2014 and 2015 spawns in the Sacramento River below Shasta Dam. The run had been recovering after the 2007-2009 drought (Figure 1). However, year class production suffered in the 2012-2015 drought, culminating with the year class (spawn) failures in 2014 and 2015 (Figure 2) caused by egg stranding and high water temperatures. Run size and juvenile production/survival estimates for 2016 are as yet incomplete, but production of juveniles as estimated from Red Bluff rotary screw trap data indicates some improvement over 2014-2015.1 The somewhat higher number of recruits produced in 2013 likely boosted the spawning run in 2016.
With water year 2017 starting out as a wet year with considerable flooding, conditions for the emigration of the 2016 year class should be optimal. If wet conditions persist, spawning and rearing this spring and summer for the 2017 year class should also be optimal. Planned release of 600,000 winter-run hatchery smolts in the coming weeks coincident to high Sacramento River flows also bodes well for the 2016 spawn and the future 2019 run. However, the prognosis for the 2017 and 2018 runs remains in doubt because of the above-mentioned 2014 and 2015 year class failures.
Additional insight into the future is possible by taking a closer look at the population’s spawner-recruit relationship that I prepared for the past four decades (Figure 3). Recruitment appears to be a function of both the number of spawners three years prior to any given year and environmental conditions between spawning and emigration in a given year. (Other factors such as ocean conditions may also add to variability in the data.) The recruits-per-spawner ratio is higher three years after wet years than three years after dry years. The runs in 2017 and 2018 are likely to be severely depressed because of extremely poor 2014 and 2015 recruitment, and may possibly be as low as those produced after the 1987-91 drought (only 100-200 wild spawners).
For further reading on winter-run status see:
- http://deltacouncil.ca.gov/sites/default/files/2015/11/Vogel%20White%20Paper-%20Potential%20effects%20of%20CVP %20Ops%20on%20winter%20run%20Chinook%20egg%20incubation%202015.pdf
- http://www.westcoast.fisheries.noaa.gov/stories/2015/23_12232015_winter_chinook_math.html
- http://www.nmfs.noaa.gov/stories/2015/09/spotlight_chinook_salmon.html
- http://mavensnotebook.com/2015/12/15/conserving-chinook-salmon-at-the-southern-end-of-their-range-challenges-and-opportunities/
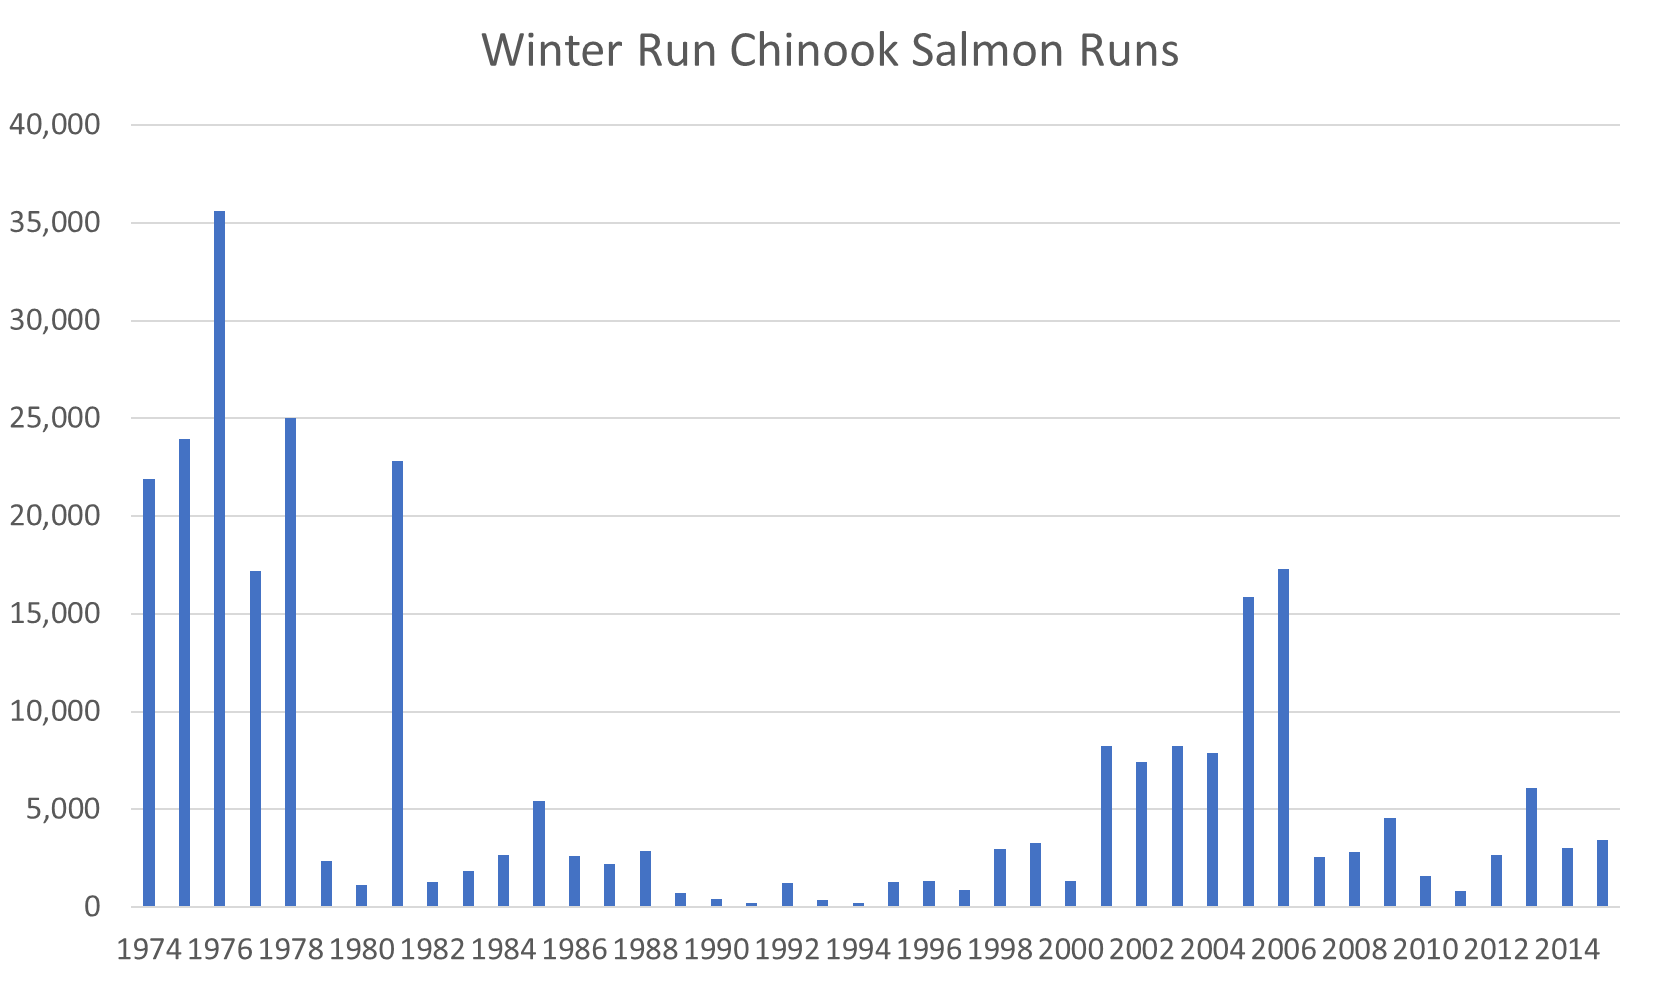
Figure 1. Winter-run Chinook salmon escapement (run size) into upper Sacramento River near Redding, CA from 1974-2015. (Data Source: http://www.dfg.ca.gov/fish/Resources/Chinook/CValleyAssessment.asp)
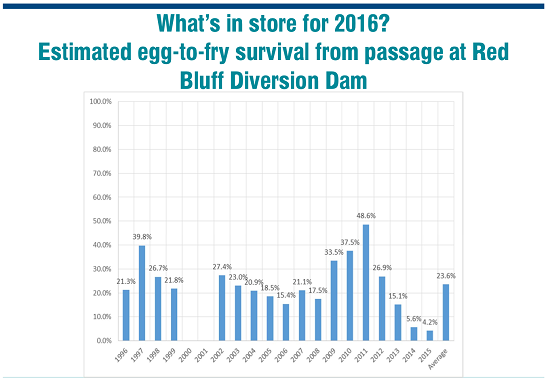
Figure 2. Survival of winter-run year classes below Shasta Dam from 1996-2015. The water temperature standard for the Sacramento River near Red Bluff was weakened during 2012-2015 drought. The severely weakened water quality standard in 2014 and 2015 led to poor survival and virtual loss of two year classes. (Source: http://www.waterboards.ca.gov/waterrights/water_issues/programs/drought/sacramento_river/docs/nmfs_yip_03182016_ppt.pdf)
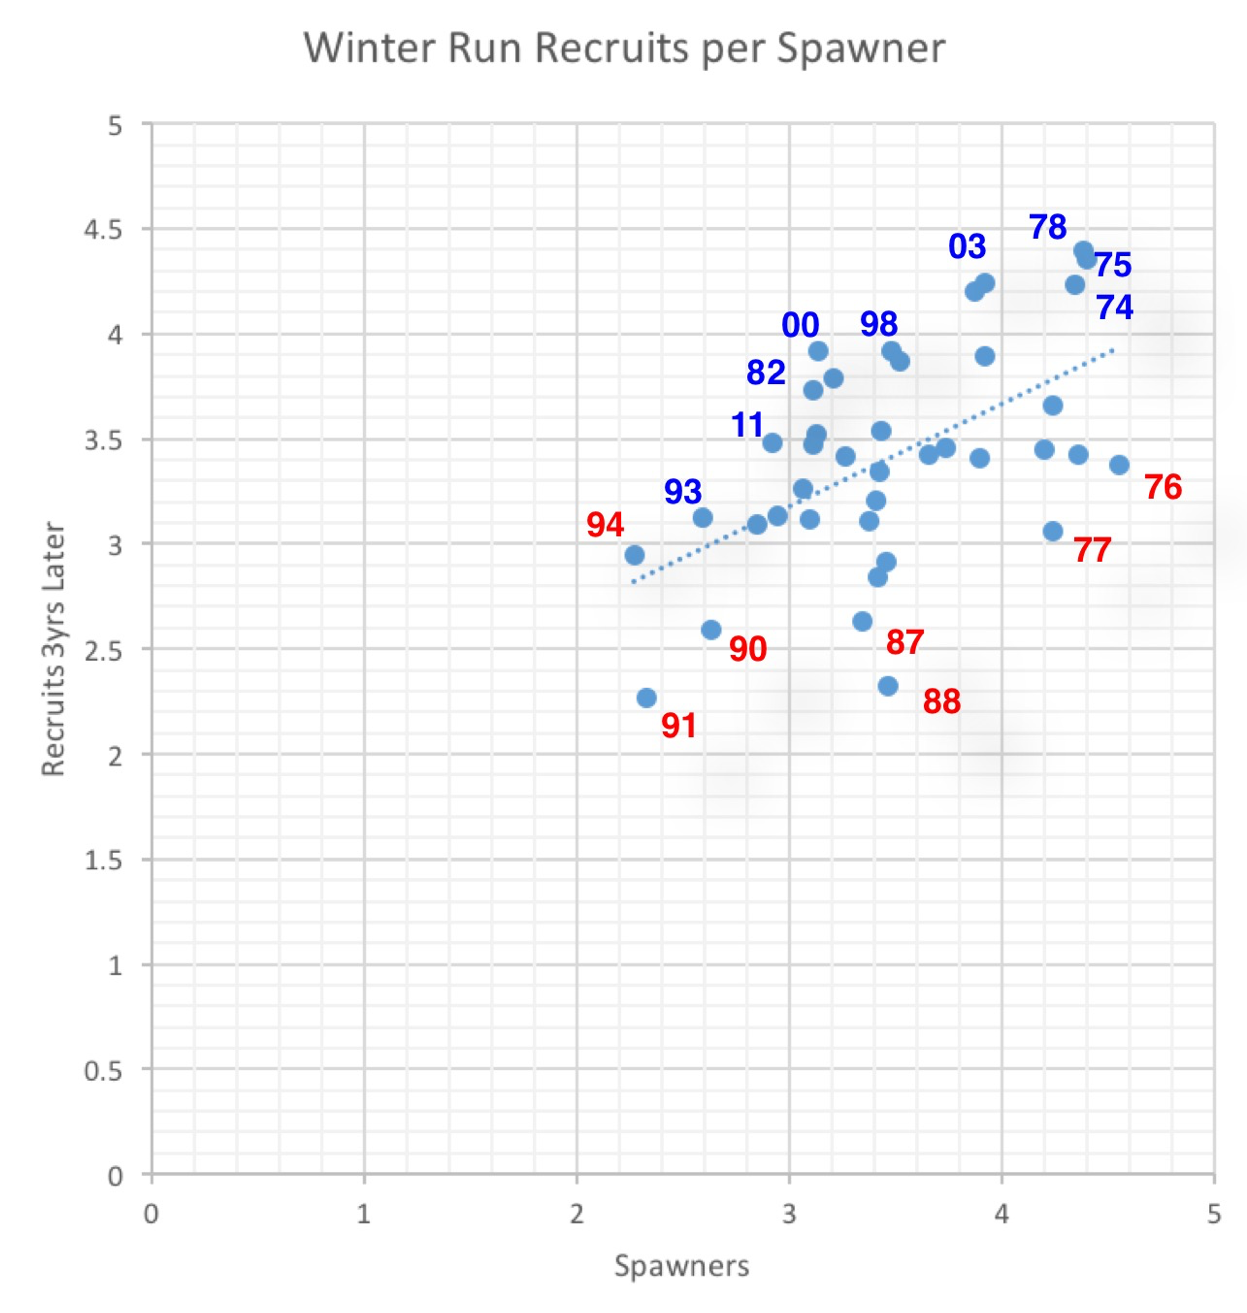
Figure 3. Winter-run Chinook spawners versus number of spawners three years later (recruits) for years 1974 through 2012. Selected wet year spawn dates shown in blue. Selected dry year spawn dates shown in red.
(Data source: http://www.dfg.ca.gov/fish/Resources/Chinook/CValleyAssessment.asp)


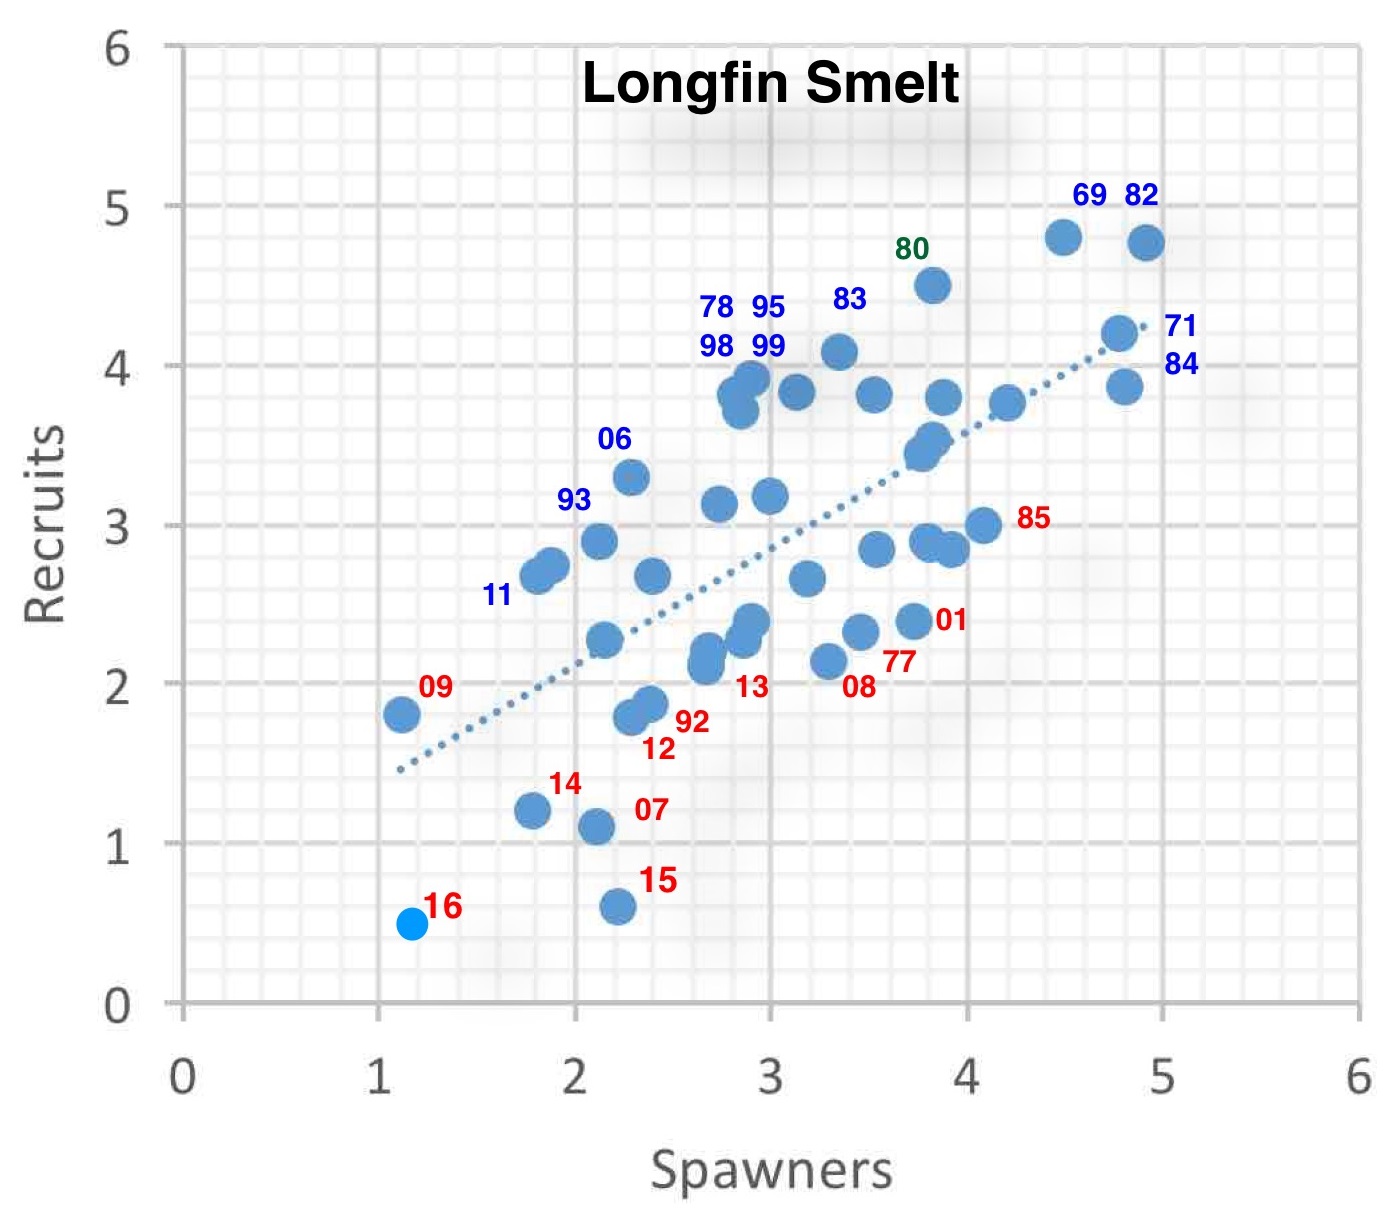
![Figure 5. Striped bass Fall Midwater Trawl Survey Index (log10[index+1]) versus prior Summer Townet Index (log10). Select years labeled, with color of number showing year type: blue=wet, green=normal, and red=critically dry.](http://calsport.org/fisheriesblog/wp-content/uploads/2017/01/figure-5.png)