
Delta outflow has been estimated by state and federal agencies for over 50 years. The Department of Water Resource’s Delta Total Outflow is a daily-average algorithm calculated in cubic feet per second (cfs) for Station DTO, a hypothetical location near Chipps Island in Suisun Bay. The federal Bureau of Reclamation’s Delta Outflow estimate is calculated similarly and presented as a daily average flow in cubic feet per second on Reclamation’s website.
Now a third estimate of Delta Outflow is available from the federal US Geological Survey on one of its websites (https://waterdata.usgs.gov/nwis/inventory?agency_code=USGS&site_no=380245121532301). This site has daily average estimates for a “gage” near Chipps Island since summer of 2016. The estimate is from tidally filtered flow/stage data.
A comparison of the DWR and USGS estimates is shown below in Figures 1 and 2. The two estimates are very similar. A closer comparison during the low-flow summer periods of 2018 (Figure 3) and 2019 (Figure 4) indicates significant differences, or at a minimum a modicum of uncertainty in one or both of the estimates. The average flow in the DWR data for 2018 data is about 10% higher over the period than the USGS data. The role of tides or tidal filtering in the USGS estimate is a likely factor in the difference. Under high seasonal tide periods (termed spring tides), outflows can fall to near zero, with major ramifications to salinity and water over the entire Bay-Delta, especially in the high export summer season.
The state’s current water quality control plan for the Delta includes objectives for Delta outflow (Figure 5). The objectives are stated as a monthly average. The low level of the objectives 3000-8000 cfs should give one pause as to the level of protection that these objectives provide to public trust resources like fish. The Water Resources Control Board is in the process of updating its plan and water quality objectives.
In past posts, I have advocated for daily salinity standards for the Delta rather than bi-weekly or monthly objectives for outflow, flow, export, and salinity. Such daily standards could be readily planned for, managed, monitored, and assessed for effectiveness.
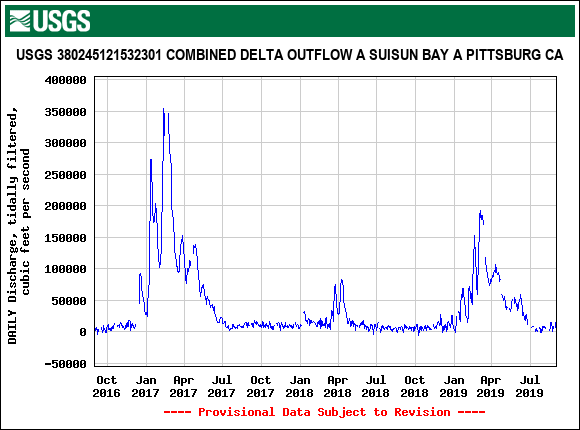
Figure 1. USGS estimate daily Delta outflow Sep 2016 to Sep 2019.
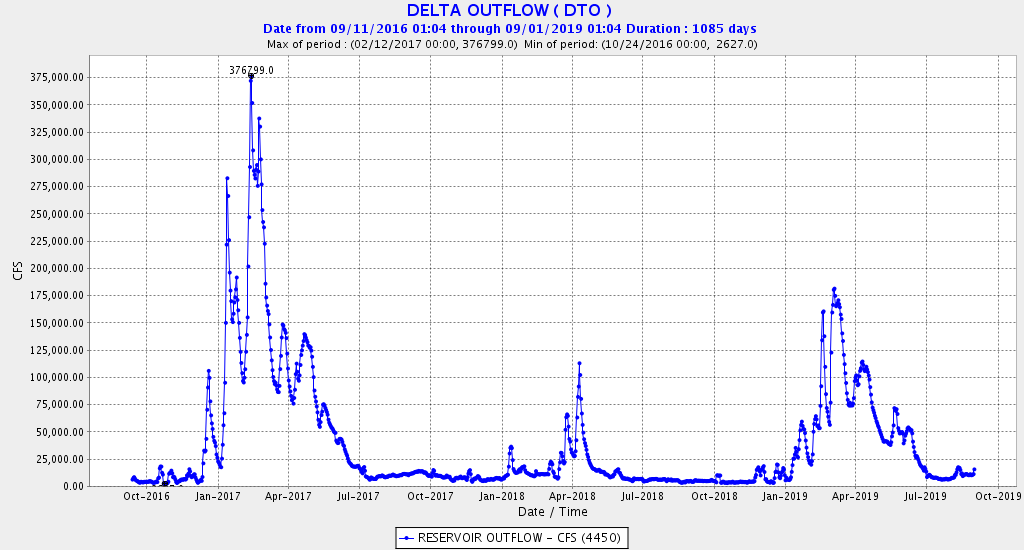
Figure 2. DWR estimated daily Delta outflow Sep 2016 to Sep 2019.
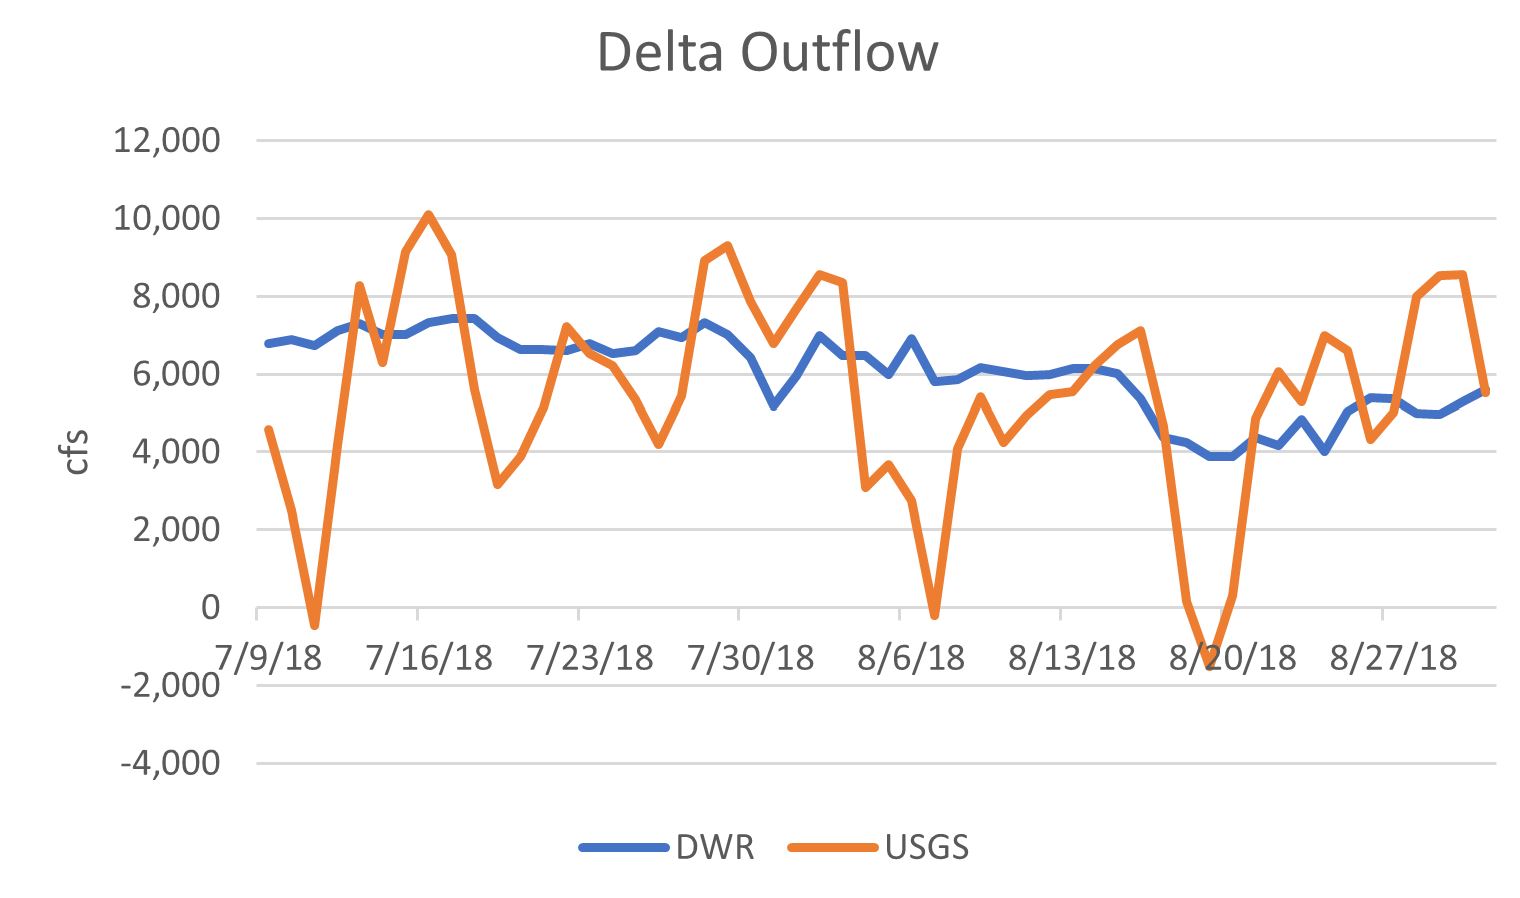
Figure 3. Estimated daily outflow by DWR and USGS summer 2018.
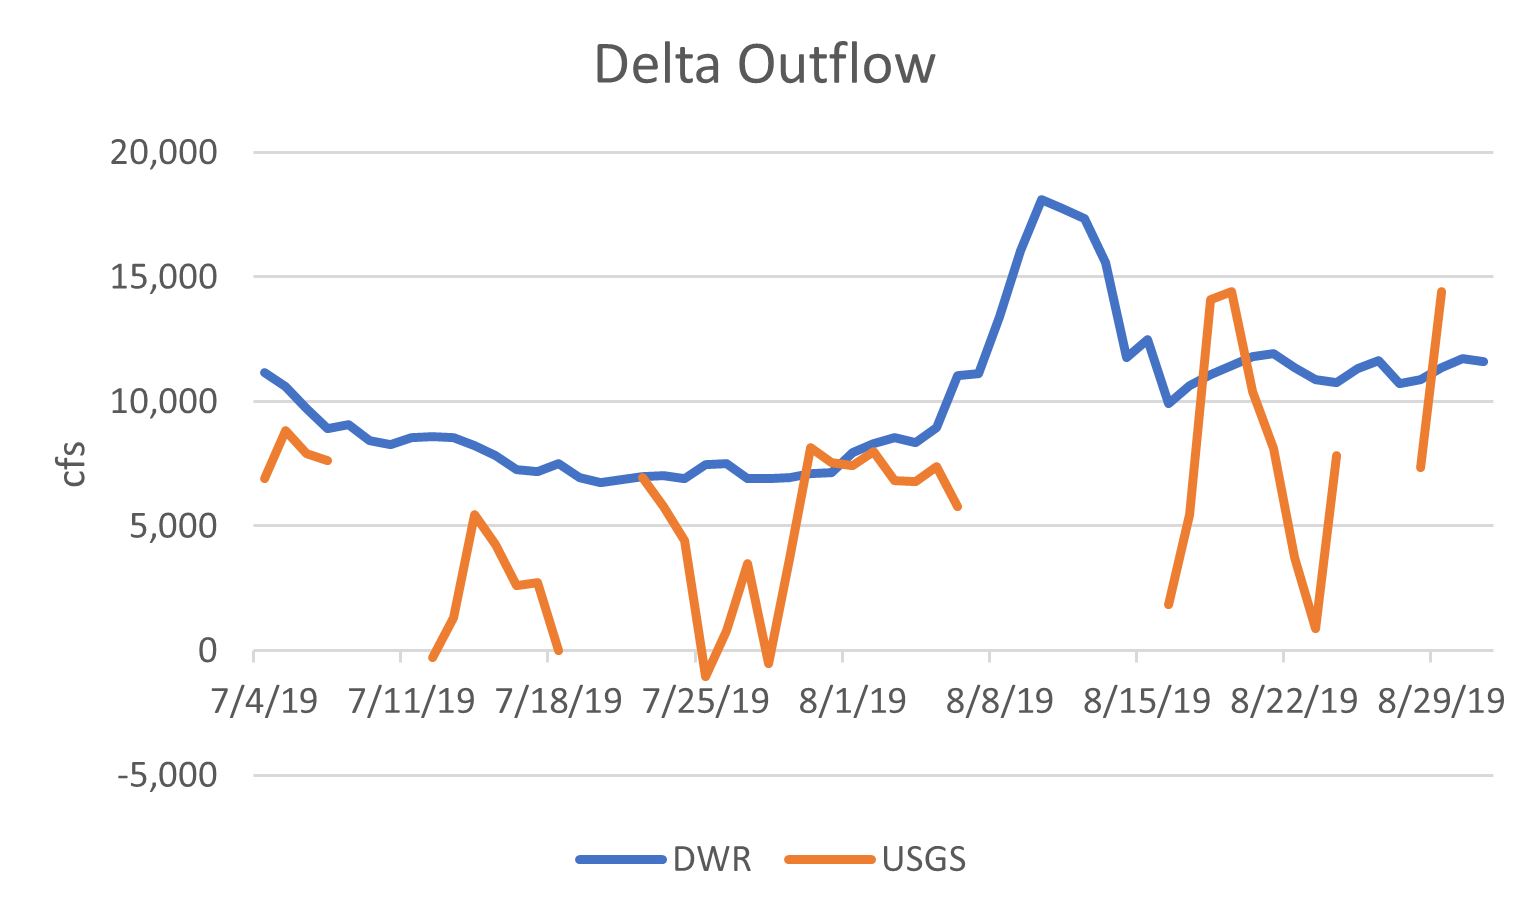
Figure 4. Estimated daily outflow by DWR and USGS summer 2019.
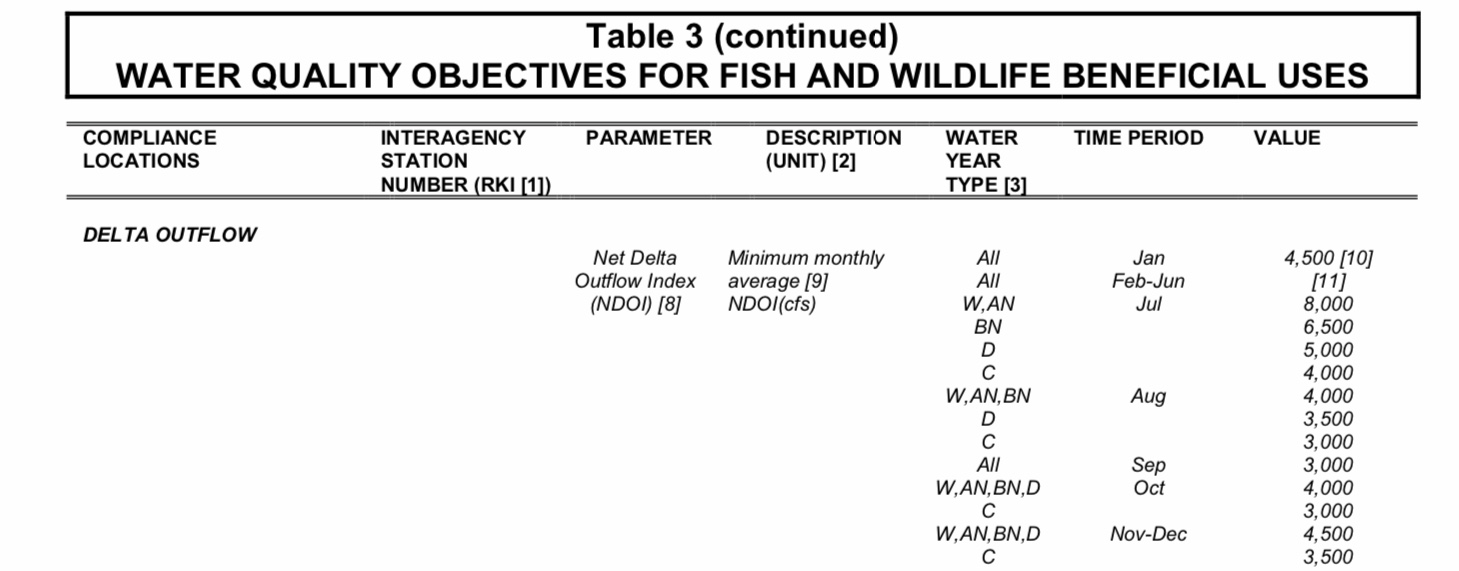
Figure 5. Delta outflow objectives in state’s water quality control plan.