 After the 2013-2015 drought, the National Marine Fisheries Service (NMFS) took a deep dive into “lessons learned” to help guide future regulatory permit processes, especially those that address the effects of future Shasta Reservoir operations on endangered winter-run Chinook salmon. The drought proved to be a comprehensive adaptive management experiment on the effects of the US Bureau of Reclamation’s (Reclamation) operation of its Shasta-Trinity Division on Sacramento River and Bay-Delta fish populations. Though the specific lessons learned focused primarily on one listed species, winter-run salmon, the effects manifested in different ways on other listed or special-status native fish species in the Central Valley and Klamath-Trinity rivers, including other runs of salmon, steelhead, sturgeon, and smelt, and even orca in the ocean.
In upcoming posts, I will discuss the ramifications of the “lessons” and their relevance to fish populations and water supply issues. The focus will be on Sacramento Valley salmon and how Reclamation can adjust the operations of the Shasta-Trinity Division to help salmon and other fish populations recover.
March 2021 is a critical stage of decision making in managing resource allocation during what could be another dry year like water year 2020. Reservoir storage levels are low (Figures 1-3), and Shasta’s cold-water supply (Figure 4) is low after a dry year. Water year 2021 is dry so far. The lessons learned need to be applied to avoid the fisheries disasters of the last drought. Will the warnings and lessons be heeded?
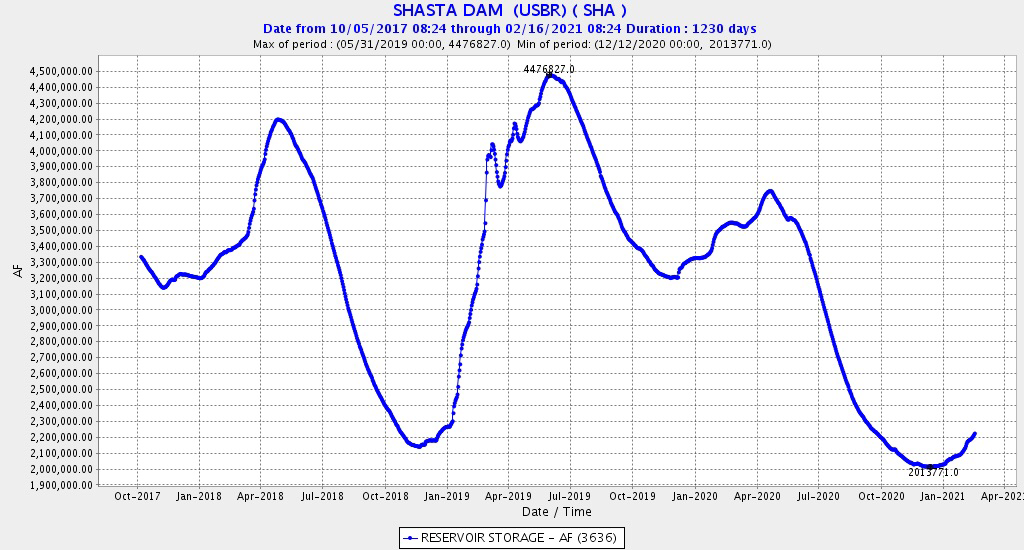
Figure 1. Shasta Reservoir water storage for water years 2018-2021. Note reservoir refilled in wet year 2019 but not in below normal 2020, and storage enters 2021 at a low level.
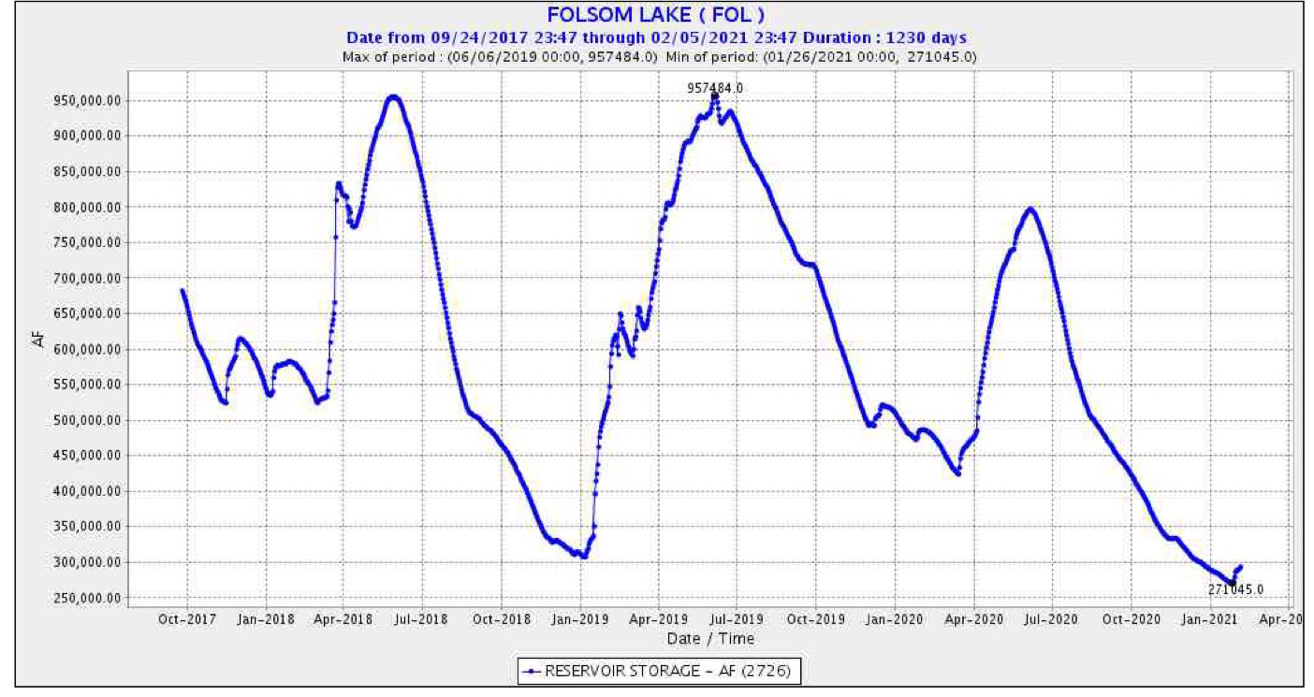
Figure 2. Folsom Reservoir water storage for water years 2018-2021. Note storage entered water years 2020 and 2021 at lower levels, which does not bode well if water year 2021 is dry.
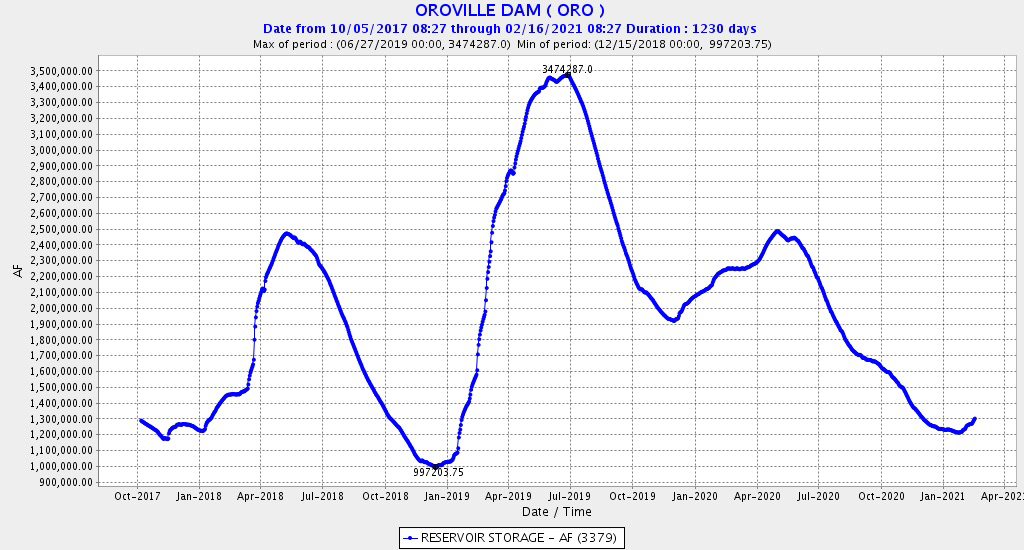
Figure 3. Oroville Reservoir water storage for water years 2018-2021. Note reservoir storage was poor after wet water year 2017 because of 2017 spillway failure.
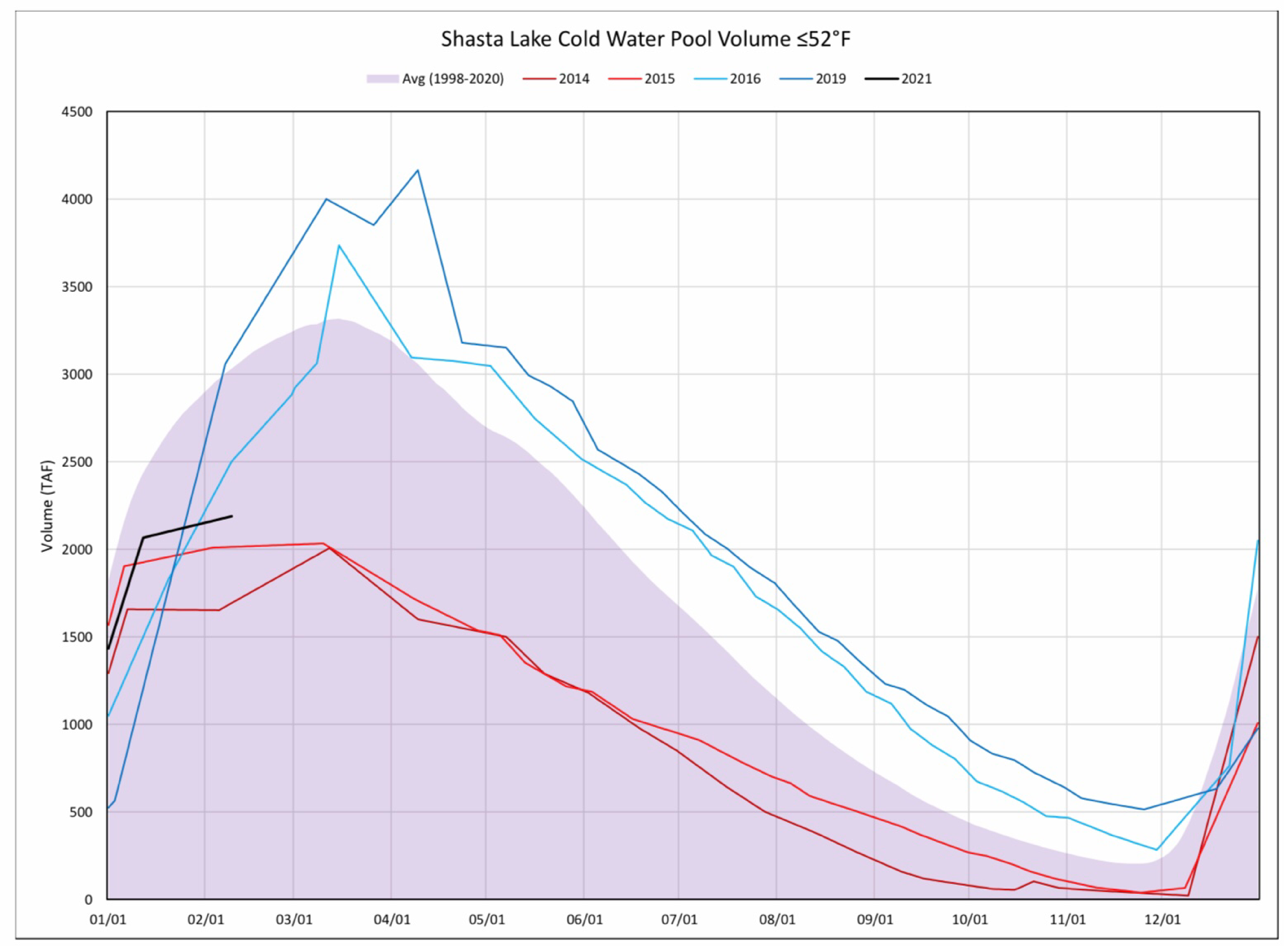
Figure 4. Shasta Reservoir cold-water pool supply in calendar years 2014-16, 19, and 21. Note 2021 (black line) is beginning to trend toward drier year levels.