
In a recent post, I summarized the population dynamics of Delta smelt using the Summer Townet Index and Fall Midwater Trawl index relationships. Since then, the California Department of Fish and Wildlife updated the Fall Midwater Trawl Index for 2017. In turn, I update the relationships in Figures 1 and 2 below. As I predicted in another post last fall, there was no uptick in the 2017 index, despite it being a wet year. News articles on the subject suggest “no easy answers.” To me it is obvious that the water project managers went out of their way to short smelt in 2017. The prognosis for Delta smelt remains grim.
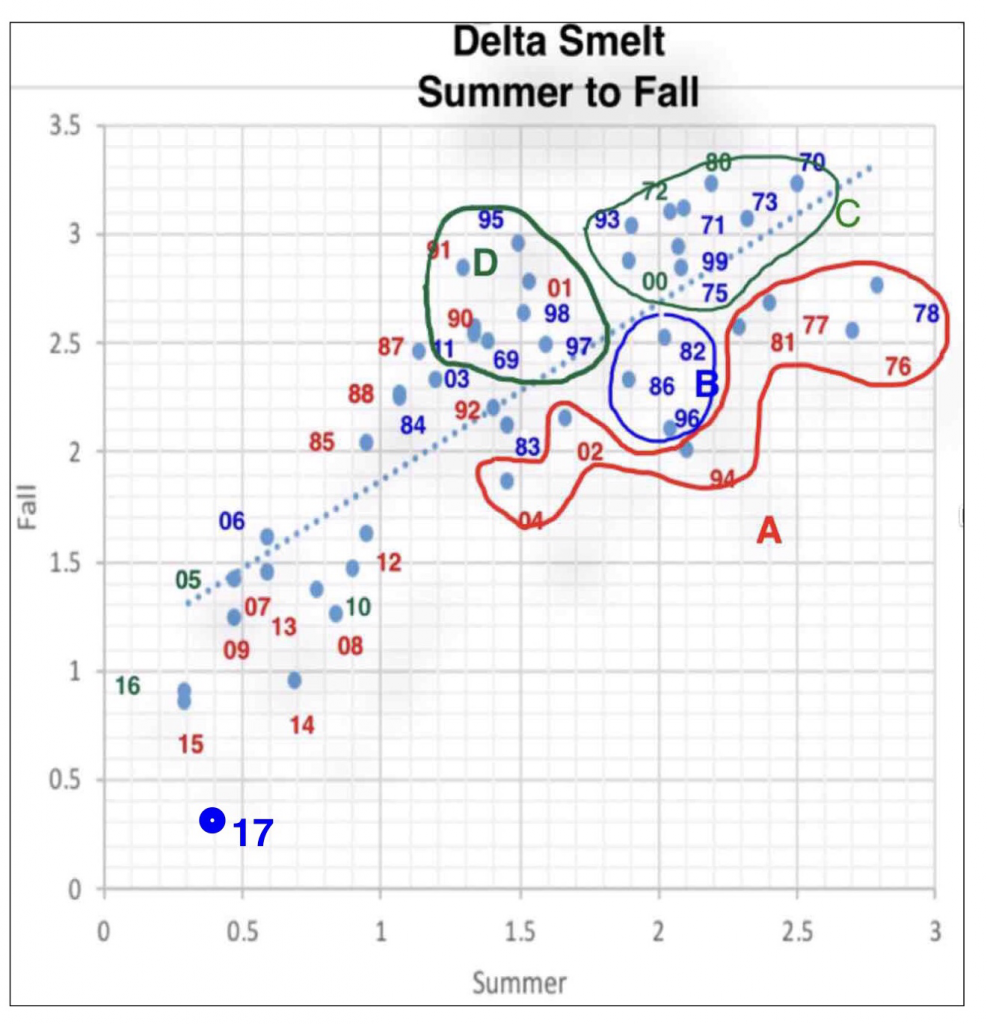
Figure 1. Log vs Log plot of fall FMWT Index of Delta smelt as related to the prior summer STN Index of abundance for that year. Blue years are wet water years (Oct-Sept). Green years are normal water years. Red years are dry and critical water years. Year types are as determined by the California Department of Water Resources for the Sacramento River runoff to the Bay-Delta Estuary (http://cdec.water.ca.gov/cgi-progs/iodir/WSIHIST).
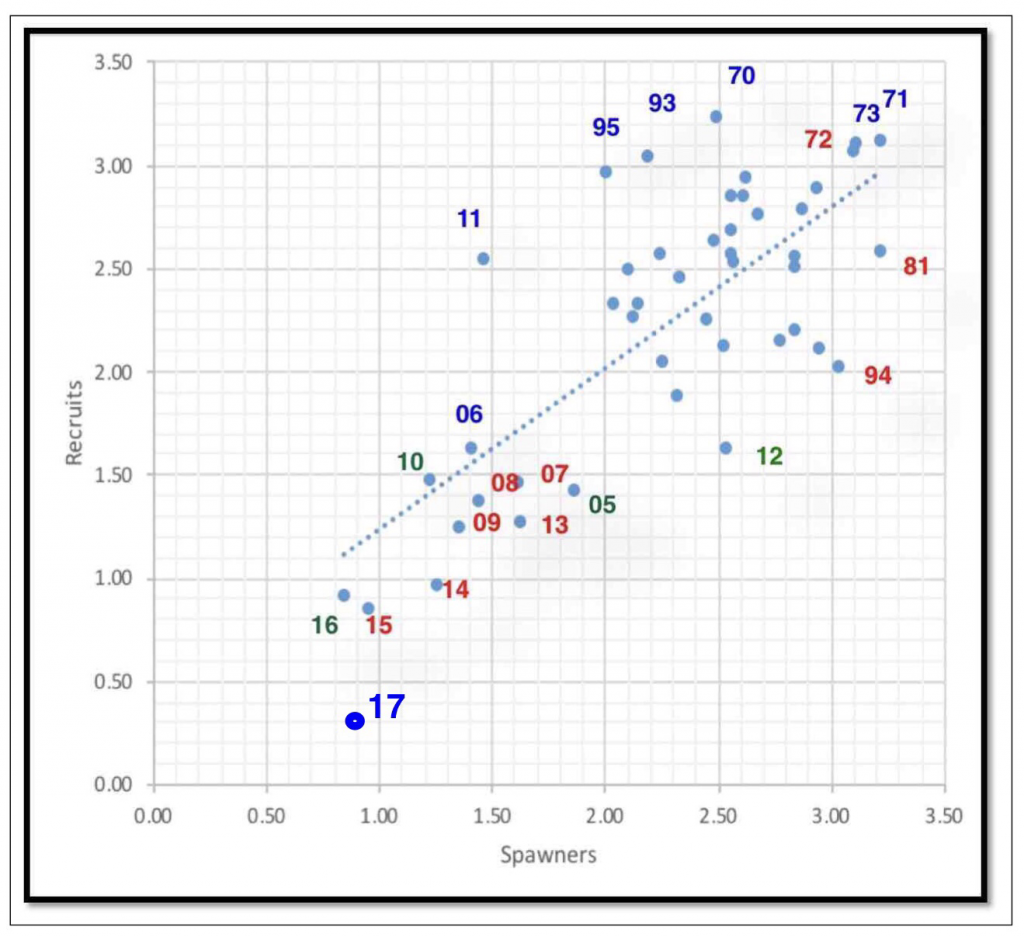
Figure 2. Log vs Log plot of fall FMWT Index of Delta smelt (recruits) vs previous fall index (spawners). Blue years are wet water years. Green years are normal water years. Red years are dry and critical water years. Year types are as determined by the California Department of Water Resources for the Sacramento River runoff to the Bay-Delta Estuary (http://cdec.water.ca.gov/cgi-progs/iodir/WSIHIST).