
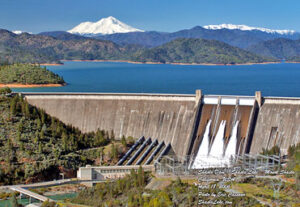
 In the evening of 4/10 and early morning hours of 4/11, the Bureau of Reclamation began releasing warm surface water from Shasta Reservoir through the upper river outlets to the dam spillway (see inset at right), bypassing the Shasta Temperature Control Device (TCD) and the Shasta powerhouse, forgoing power production.
Figure 1 shows the warm water beginning at 20:00 4/10 and continuing to 8:00 4/11. Reclamation changed the recent pattern of midnight releases, raising releases from about 3000 cfs releases to about 6000 cfs (Figure 2). This was possible due to the available capacity of the upper-level river outlets on the dam spillway. Reclamation also curtailed peaking power releases through the TCD and penstocks on the evening of 4/10. The 55ºF temperature in Figure 1 immediately downstream of Shasta Dam reflects the temperature of the lake’s surface water at the upper level outlets (Figure 3).
During and after the experiment, water temperatures in the Sacramento River downstream increased less than 1ºF, both immediately below Keswick Dam (Figure 4) and 10 miles further downstream at the Clear Creek gage (Figure 5).
Overall, the experiment shows that forgoing some peaking power by bypassing penstocks and releasing warmer upper-level lake water in April can save cold-water-pool volume, although with a small increase (0.5ºF in this case) in downstream water temperatures under these specific conditions.
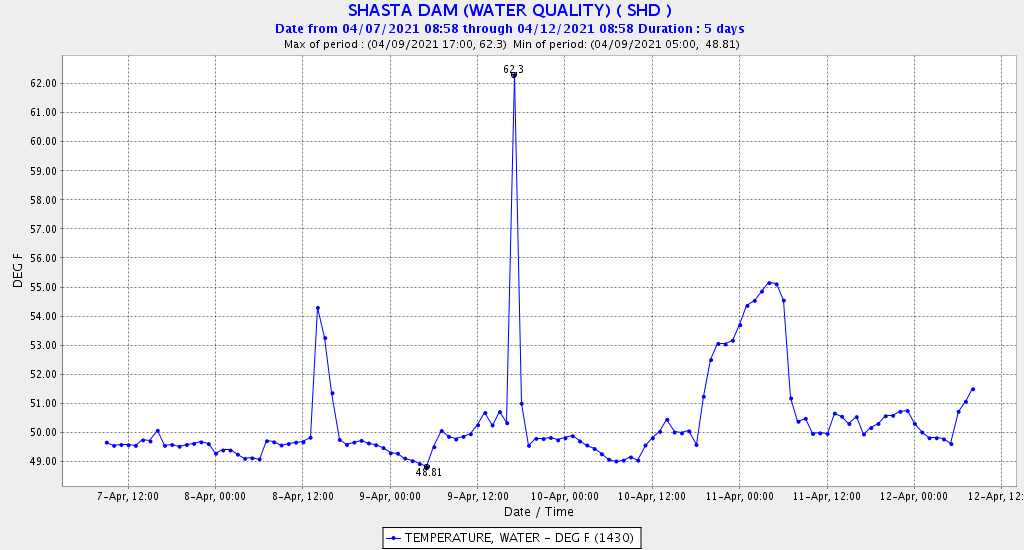
Figure 1. Water temperature immediately below Shasta Dam at gage SHD 4/7-4/12, 2021. Note substantial increase from 20:00 4/10 to 06:00 4/11 during Exp #1.
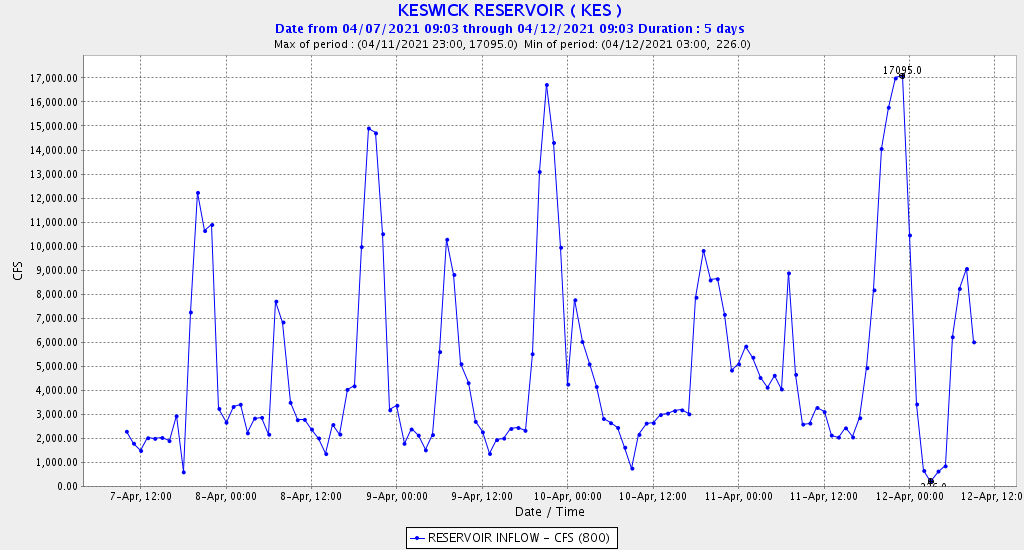
Figure 2. Inflow to Keswick Reservoir from Shasta Dam 4/7-4/12, 2021. There was also 400-750 cfs of Trinity water entering Keswick from Spring Creek Powerhouse.
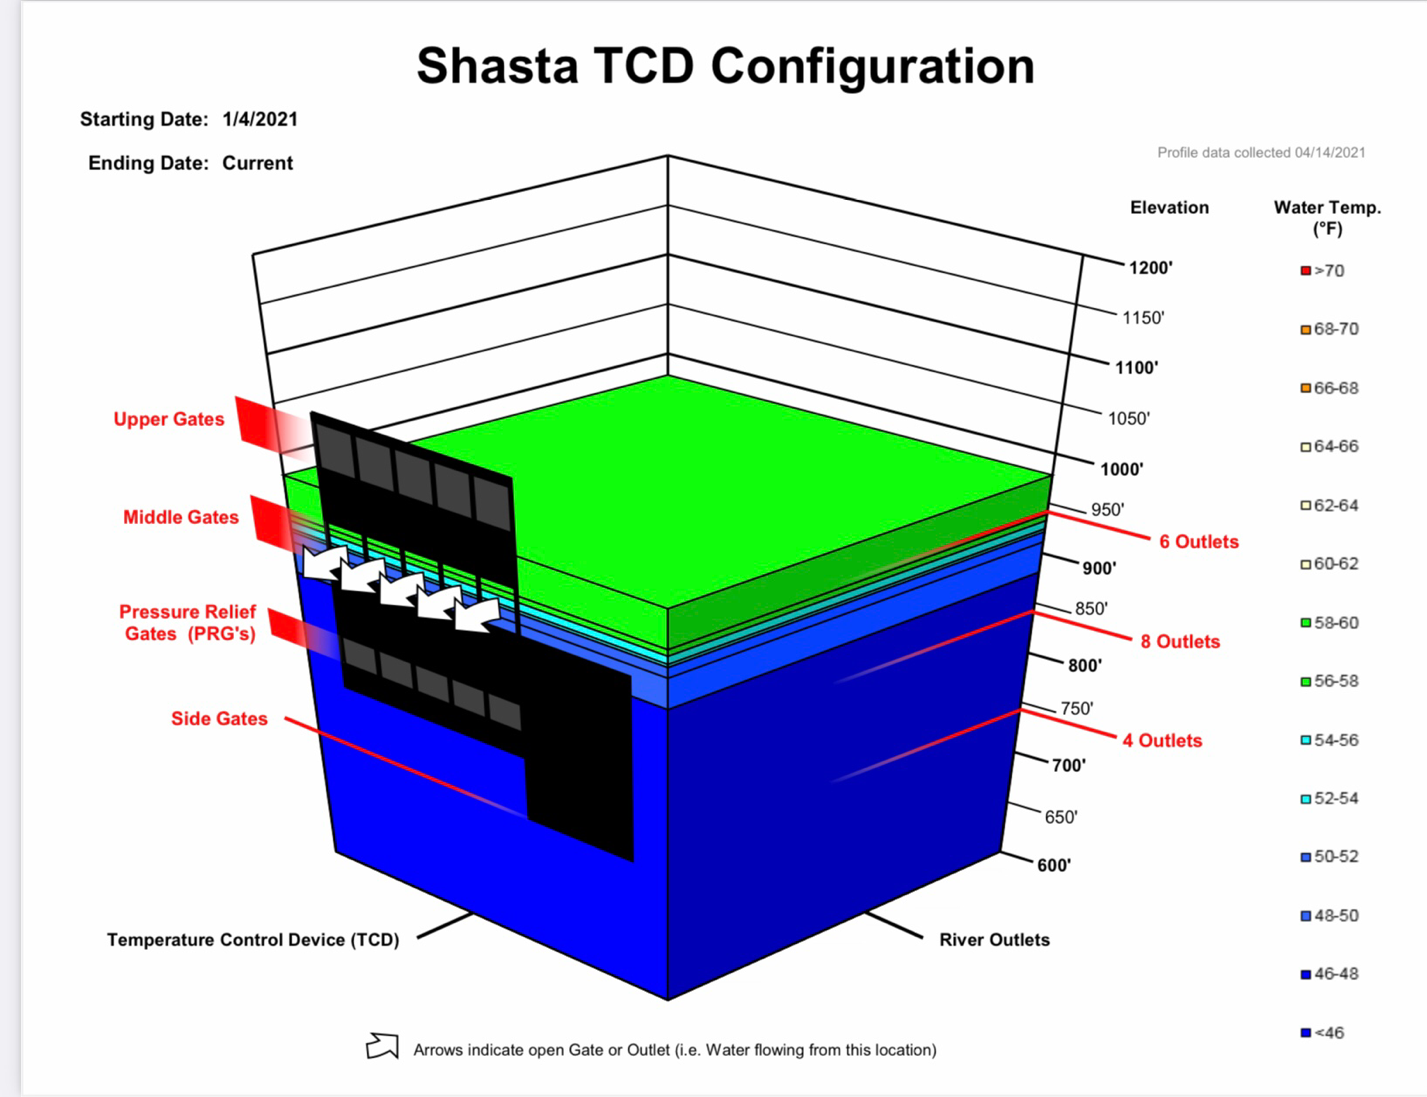
Figure 3. Water temperature profile in lake at Shasta Dam on 4/14/2021. Note water temperature in mid-50s at level of the upper six outlets to the spillway, in contrast to the cooler 50ºF water entering the penstocks via the middle gates of the TCD.
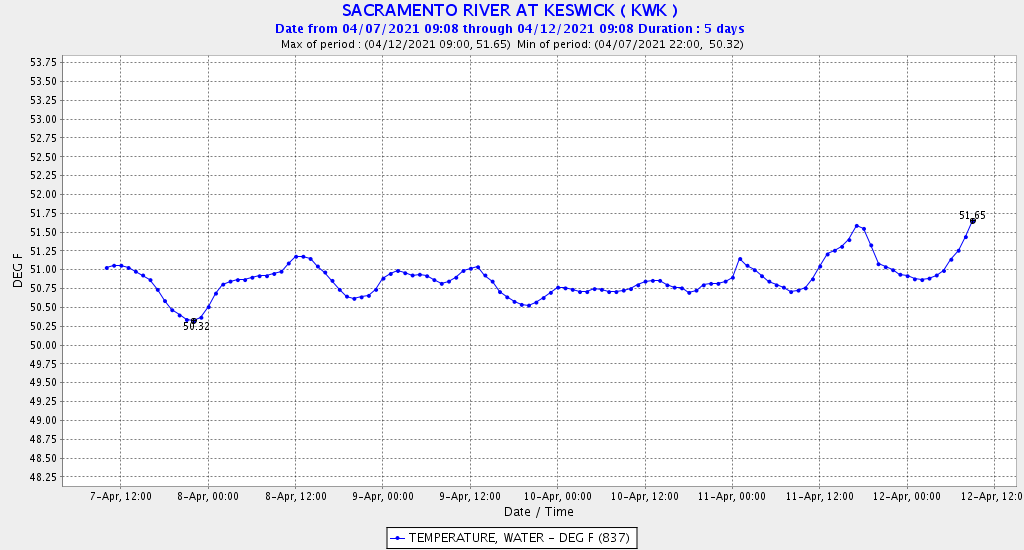
Figure 4. Water temperature of water released from Keswick reservoir 4/7-4/12, 2021. Note temperature increased up to 0.5-0.8ºF during and after the experiment.
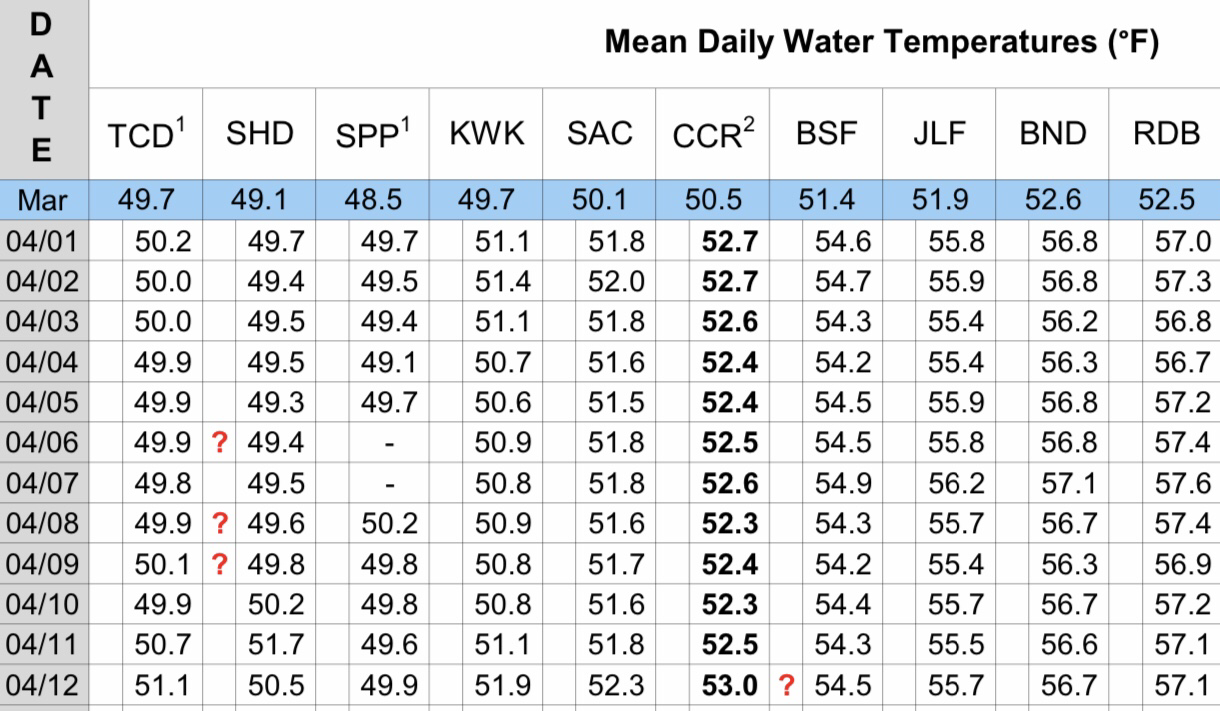
Figure 5. Daily average water temperatures at selected gages 4/1-4-12, 2021. Note temperatures at Clear Creek confluence (CCR, in bold), with little increase on 4/10-4/11.