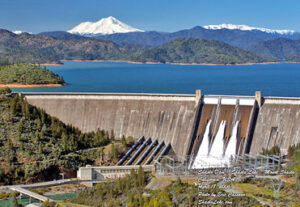
 In early April 2021, the Bureau of Reclamation began a series of tests to determine if releases of water that bypass the powerhouses at Shasta Dam could help save Shasta’s cold-water pool through the summer and fall and thus help sustain salmon spawning in the Sacramento River below Shasta. This post describes the third experiment in the series.
Experiments or tests of the powerhouse bypass continued at Shasta Dam from 4/19-4/24, 2021. But the apparent goal of conserving cold-water pool volume for later in summer seems to have morphed into an acute operational phase of releasing a lot of water for contractor deliveries early in a critical drought year. This higher release volume shows little regard for this year’s production of endangered winter-run salmon. This unprecedented federal operational regime has not been approved by the California State Water Resources Control Board, nor has it been endorsed by the federal National Marine Fisheries Service, which is charged with protecting endangered salmon.
What was billed as a power turbine bypass at the federal Shasta Dam to save cold water storage has turned out to be a unique way to release a lot of Shasta’s remaining critical dry year storage (as well as cold-water pool supply) to Sacramento Valley water contractors. The approach is both ingenious and insidious, and is likely a leftover planned action by the previous federal administration, whose goal was to maximize water deliveries to Central Valley farmers without regard for an already fragile and weakened ecosystem.
The approach entails releasing warm water from the surface of the reservoir into the upper river outlets (as in the above photo) instead of through the deeper cold water through the power penstocks and powerhouse (five penstocks and powerhouse are to left of spillway in above photo). 1
The problem is that too much warm water is being released, so cold water must also be released to overcome the release of relatively warm surface water (Figure 1), via mixing in downstream Keswick Reservoir before ultimately being discharged into the Sacramento River downstream of Keswick. Total releases reached 12,000 to 16,000 cfs in the afternoon peak-power-demand periods from 4/19-4/24 (Figure 2). Water temperatures topped out at 56-58ºF in the non-peak hours (Figure 3), when releases were dominated by spillway releases (Figure 4). Shasta Reservoir storage dropped approximately 30 TAF (from 2,360 TAF) during the four-day period. Downstream water temperatures increased up to several degrees during the four-day period (Figures 5-7). Downstream water deliveries to contractors increased as well, based on differences in gaged flow between the upper and middle river (Figure 8).
In summary, power bypass releases from Shasta reservoir occurred in this critical drought year, resulting in higher downstream river water temperature, no cold-water pool saving, lower reservoir storage, and higher contractor deliveries. The higher water temperatures (>56ºF) exceed state water quality standards and existing water temperature targets for the upper Sacramento River.

Figure 1. Shasta Dam and reservoir schematic depicting late April 2021 release regime. Warm surface water is released through six upper outlets. Colder layered water is released through five middle gates of the Temperature Control Device (TCD) outlet tower on the face of the dam to the powerhouse via the five penstocks.

Figure 2. Shasta reservoir storage hourly release pattern 4/19 – 4/24, 2021. The graph shows total combined powerhouse and spillway releases. Note powerhouse peaking-power releases generally occurred only in late afternoon or early evenings or mornings. Spillway releases appear to have been continuous: 4,000 cfs on 4/21-22, and 6,000 cfs on 4/23-24

Figure 3. Shasta Reservoir hourly release water temperature pattern 4/19 – 4/24, 2021. The water temperature is that of water below the dam made up of blended spillway and powerhouse releases. Comparison with Figure 2 shows that minimum water temperatures occur during power peaking events that draw from cold-water pool in Shasta Reservoir.

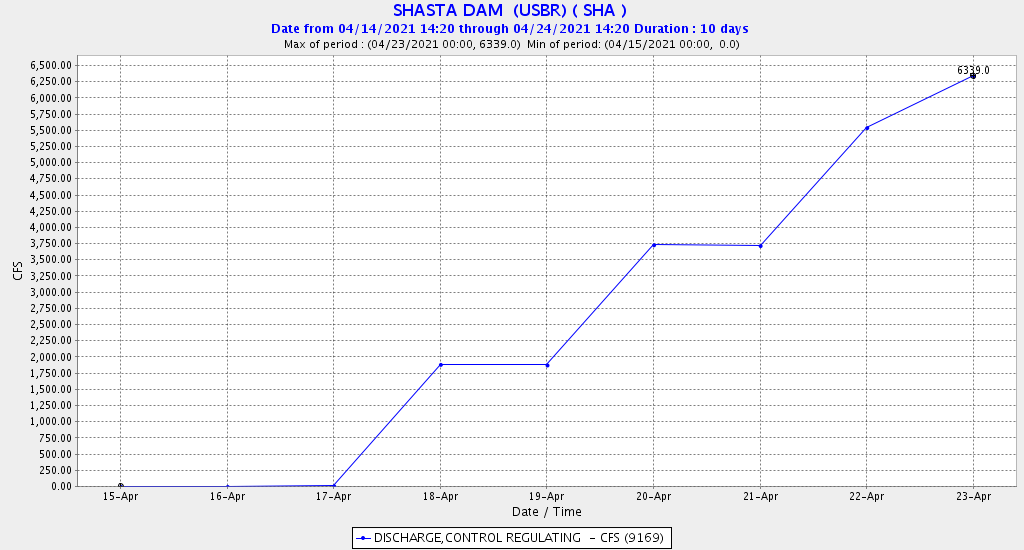
Figure 4. Daily average releases (cfs) from Shasta Dam river outlets to spillway bypassing power house, showing releases from 4/18-4/23.

Figure 5. Water temperature below Keswick Dam 4/19-4/24, 2021. Note gradual increase in water temperature from increasing spillway releases during period.

Figure 6. Water temperature above mouth of Clear Creek ten miles below Keswick Dam 4/15-4/24, 2021. Note increase from increasing spillway releases beginning on 4/19. Note existing target temperature for this gage is daily average 56ºF.

Figure 7. Daily average water temperatures in the lower Sacramento River 4/1-4/24, 2021. Note RDB (Red Bluff) is lowermost gage. Note sharply higher water temperatures during the 4/19-4/24 test period. See Figure 9 for location map.

Figure 8. Daily average river flows in the lower Sacramento River 4/19-4/24, 2021. Note the difference between WLK and KWK gages represent approximate water deliveries to contractors. Note VON (Verona) is lowermost gage and is influenced heavily by Feather River inflows. See Figure 9 for location map.

Figure 9. Gage locations
