The Endangered Species Act (ESA) directs all federal agencies to work to conserve endangered and threatened species and to use their authorities to further the purposes of the Act. The purpose of the Act is to protect and recover imperiled species and the ecosystems upon which they depend. Protect means to not allow “take” of listed species. If some take occurs despite best efforts, then “reasonable and prudent” alternatives (RPAs) may be needed to protect the threatened or endangered species.
The US Bureau of Reclamation and its partner the California Department of Water Resources (permittees) operate the federal Central Valley Project (CVP) and the State Water Project (SWP) under federal and state ESA “take” permits issued in 2008-2009 biological opinions that included RPAs. The RPAs constrained water supply deliveries and other project operations during the past decade to protect listed salmon, smelt, sturgeon, and steelhead.
Over the past decade, the parties have reinitiated consultation to revise take permits and RPAs. The initial motivation for reinitiation was that RPAs and take limits were not protecting or recovering the listed species. The US Fish and Wildlife Service (USFWS) and the National Marine Fisheries Service (NMFS) recognized that more stringent measures were needed. A series of draft opinions were developed with further protections, culminating with a July 1, 2019 draft jeopardy opinion from NMFS on Reclamation’s proposed action as of that time. A jeopardy opinion occurs when an action is reasonably expected, directly or indirectly, to diminish a species’ numbers, reproduction, or distribution so that the likelihood of survival and recovery in the wild is appreciably reduced.
Reclamation updated its “proposed action” in response to the draft jeopardy opinion. “It must also be acknowledged that the current status of all these species continues to be imperiled, and that one of the objectives of the proposed action is to maximize the available supply of water for irrigation, municipal, and industrial deliveries.” Reclamation doubled down. Reclamation’s most recent proposed action includes some provisions of the 2008/2009 biological opinions’ RPAs and recent jeopardy draft BO. In response, the Services relented under pressure from the Trump administration, replaced technical staff with a new group of managers, and recently issued final non-jeopardy opinions.
The new proposed action from Reclamation can now go into effect without RPAs that would hinder Reclamation from maximizing water deliveries. The new Biological Opinions will govern project operations under a wide array of vague commitments to protect and recover listed species: some good, some bad, and some simply ugly.
The Good (Well, as Good as it Gets)
- Delta Smelt Conservation Hatchery
This is long past due. However, the proposal is vague and limited in potential scope and funding commitment.
- New Habitat
Most measures that require new habitat in the new BO were prescribed in past BOs. Now there are new vague commitments. Some listed species (e.g., Delta smelt) have populations too small to benefit from new habitat.
- Hatchery Management
New and updated old prescriptions, though vague, are badly needed, especially for converting the program focus from mitigation hatcheries to conservation hatcheries.
- Proposed Funding for research and restoration
The BOs contain an estimated total of $1.5 billion dollars in proposed funding to support threatened and endangered fish survival and recovery through research and restoration actions. However, the proposed funding is not dedicated and is vague, particularly in that much of the effort and funding may go to prior commitments that have not been funded.
- Delta Cross Channel Improvements
Proposed upgrades to the Delta Cross Channel Gates are helpful but vague. The Delta Cross Channel should be screened, as should nearby Georgiana Slough.
- Modifying the Head of Old River Scour Hole
This action is OK but addresses only one of many predation hotspots for salmon and steelhead caused by human actions and man-made structures in lower San Joaquin River.
- Fish Passage on Deer Creek (a non-Project watershed)
This is one positive action for listed spring-run salmon among many in NMFS’s Central Valley Salmon Recovery Plan. All of the actions in the Recovery Plan should be included and funded. Deer Creek, a tributary to the lower Sacramento River, has a spawning run of wild spring-run salmon. Deer Creek does not have a project dam on it, but Deer Creek salmon pass through the lower Sacramento River and Delta. Deer Creek salmon and all other salmon-bearing tributary populations are thus affected by project operations.
- Adult Straying Barrier on the Knights Landing Outfall Gate (a flood and drainage system)
This was constructed under prior commitments but failed.
- A “drought toolbox” to prioritize a proactive approach to drought planning, including early coordination with senior water right users
Proactive coordination is fine and good, but the BOs contain no commitment to reduce diversions by senior Settlement and Exchange contractors or any others during droughts.
- Support for NMFS Steelhead Monitoring and Collaboration Activities with Non- Project Tributaries
Monitoring may inform mitigation. However, monitoring in itself is not mitigation. All recovery plan actions should be supported because CVP/SWP operations and facilities have had major adverse effects on all Central Valley steelhead populations.
- $14 million commitment to expedited implementation of the Battle Creek Restoration Project including reintroduction of winter-run Chinook salmon
The commitment to fund actions on Battle Creek is long overdue, but the funding in the BO is inadequate by an order of magnitude.
- A stronger commitment to actions maintaining low-salinity habitat in the Delta Smelt Summer-Fall Habitat Action with commitments regarding Suisun Marsh Salinity Control Gate (SMSCG) operations and projects for other elements of habitat
It is important to acknowledge the importance of summer-fall habitat representing half of the smelt life-cycle, but the commitment in the BO is vague and likely ineffective as formulated. Rather than being used more often, the SMSCG should simply be removed. It has been a detriment to smelt, salmon, steelhead, and sturgeon populations since its use began in 1989.
The BAD
- Drought Mitigation
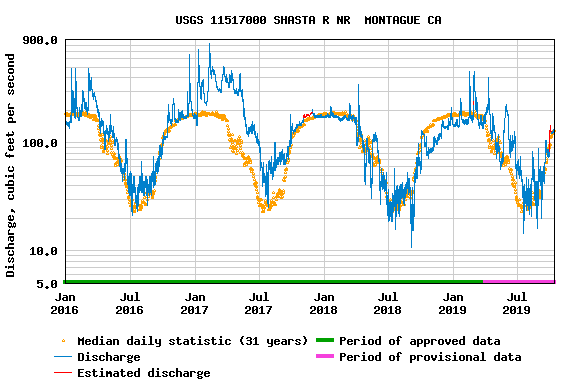
Drought mitigation in the BOs focuses on maintaining Shasta Reservoir’s cold-water-pool. The proposed action drops mitigation actions for wet years such as Fall X2. The proposed action drops previous OMR constraints that provided some protection in drought years. The one-hand-giveth-while-the-other-taketh-away approach is an old tired gambit. The ostensible improvement at Lake Shasta eliminates numeric targets for Shasta carryover storage.
- Real time management – protect when and where the fish are
This is poor prescription because some listed species populations are so low that they are undetectable (e.g., Delta smelt). Larval life stages also go undetected. Past detection rates even for larger populations have been poor, and actions to reduce impacts have been gamed and trimmed to the bone. Real time detection does not protect primary productivity and food sources and other elements of critical habitats. The managers charged with managing have a long history of choosing water supply over fish protection.
- A more detailed description of Shasta Dam operations and a commitment to Cold Water Management Tiers
This prescription does not protect listed winter-run salmon in droughts from thermal shock or dewatering of redds, which are the primary factors in recent low survival and production. Prior RPA and Recovery Plan requirements to fix problems with Spring Creek powerhouse (Whiskeytown Lake thermal curtain) and Shasta Dam warm water power releases are not included in the new salmon BO.
- “New” Science
A commitment to maintaining long-term monitoring programs and recognizing past and present science is needed. “New” science funded and conducted by water contractors or federal/state project operators will ensure any new science will be biased – foxes assessing their effects on the henhouse. The science and its presentation and analyses have become more and more controlled by water supply entities, and less and less by resource agencies. The BOs give more control of science to water suppliers. The revisions to the draft BOs are clear evidence of the new realignment of roles and new controls on science.
- Performance Metrics for managing Old and Middle River reverse flows to limit salmonid loss to similar levels observed under the previous BiOp through explicit reductions in export pumping.
The BOs’ performance measures for reverse flows are vague, ineffective, and unenforceable. Wild components of salmon populations were hard hit in droughts under previous BOs. “Similar” levels of loss are not protective and will not promote recovery.
- Performance Metrics for incubation and juvenile production of salmonids under the proposed Shasta Cold Water Pool Management strategy
The BOs’ performance measures for cold water management at Lake Shasta are vague, ineffective, and unenforceable.
- Commitments to manage Old and Middle River reverse flows for limiting larval and juvenile delta smelt entrainment based on modeled recruitment estimates
OMR rules have been one of the major restrictions on exports under the past BOs. The rules proved beneficial to the listed species survival (primarily reduced salvage and improved through-Delta survival of tagged salmon smolts). The new strategy would allow changes that would allow greater levels of exports under OMR reverse flow prescriptions. The poor survival of San Joaquin salmon under existing rules would remain poor or further decrease. Entrainment of young smelt (not measured under existing rules), an existing serious concern, would only worsen. Modeling entrainment risk has not worked and has not been verifiable. The main risks to smelt are pulling larvae into the central Delta with its poor habitat (not just to the south Delta pumps) and the destruction of their critical pelagic rearing habitat.
- Independent Review Panels to evaluate the science behind actions and outcomes
This is nothing new. There have been so many “independent” review panels. I remember working with Pete Chadwick back in the mid-70s. He consulted on my projects on the Hudson River Estuary. He and his CDFG staff working on the Bay-Delta were on the cutting edge of estuary science. They trained the next generation and they in turn trained the next. Outsiders have only verified what CDFG already well understood. Same goes for NMFS and the USFWS, as well as UC Davis. Together as IEP they manage Bay-Delta and Central Valley science more than adequately with the help of a huge cadre of capable scientists among NGOs. Water agencies and other water suppliers just can’t handle the truth, so they hire their own consultants and many outside “independent” consultants.
- Ramping rates specificity for reservoir releases to reduce the risk of stranding
Ramping rates do not work for eggs and fry salmon that are in gravel beds for up to several months. Reductions in flows from Keswick Reservoir after winter-run fry have left their nests (redds) in the fall strands up to 80% of new fall-run redds.
The Ugly
- Commitment to implement appropriate actions after two years of low winter-run Chinook salmon egg-to- fry survival.
Shasta operations in the 2014 and 2015 drought killed 90-95% of the egg production of winter-run salmon. The new Salmon BO would make that acceptable under the ESA. It would stretch the no-take standard to no take in more than two years out of three.
- More specificity on collaborative planning with specific habitat restoration and facility commitments.
More planning for habitat restoration and facilities is not needed. Reclamation, DWR and other responsible agencies should get on with prior commitments. The history of foot-dragging on habitat restoration in the Central Valley is a worthy rival to the foot-dragging by PG&E in maintaining and upgrading its infrastructure.
- A commitment to sediment supplementation and food-web studies for the protection of delta smelt.
As proposed the supplementation of sediment would come in the form of the discharge of warm, polluted agricultural drainage water full of non-native predatory fish into critical habitats of listed fish.
- Dynamic, real-time monitoring of changing conditions and potential species impacts, within an improved scientific and adaptive-management-based decision-making framework; avoiding or minimizing fishery impacts while increasing operational flexibility.
Real time management will not work for rarer listed species like Delta smelt. This has been tried for three decades and has not worked. The adaptive managers will be the same managers who produced the revised non-jeopardy BOs. “Operational flexibility” is a buzzword for increased diversions, primarily Delta exports.
- Operational rules that lay the foundation for eventual voluntary agreements on water flows for rivers that feed into the delta. Those agreements promise even greater protections and investments in fish and the environment.
Most of the “even greater protections” will have to backfill the protections that these BOs took away. The Voluntary Agreements offer pennies on the dollar in terms of necessary flow through the Delta into the San Francisco Bay.
- Eliminating or Modifying Existing RPAs and Take Limits
- Modifying year-round temperature and Shasta reservoir storage management program to minimize effects to endangered winter-run salmon.
NMFS and CDFW were just starting to get it right. NMFS’s 2017 draft RPA for Shasta would have required stronger carryover storage requirements.
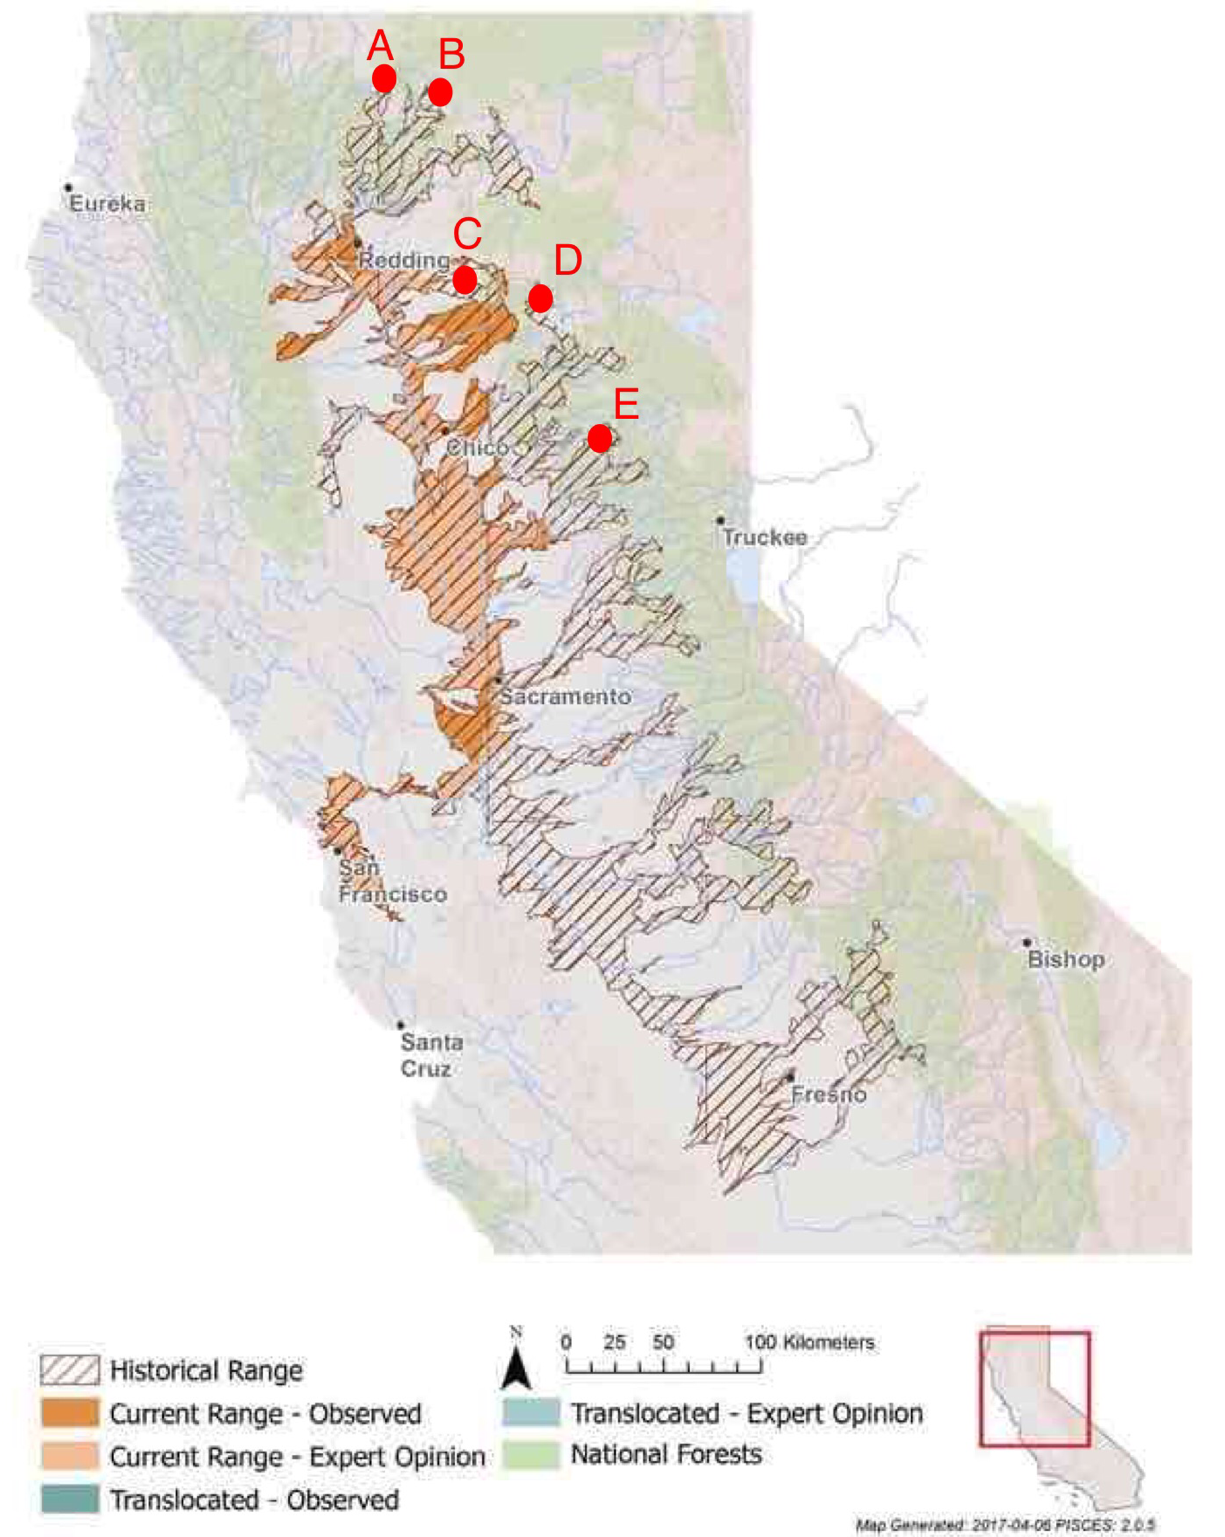
- Long-term passage prescriptions at Shasta Dam and re-introduction of winter-run to its native habitat in the McCloud and/or Upper Sacramento Rivers.
They were ready to start this program after promising initial feasibility studies. The foot draggers strung it out until Trump administration officials threatened in 2019 to arrest DWR personnel who were installing equipment to begin a pilot implementation.
- Old and Middle River flow levels that limit the strength of the reverse flows
There will be less of the needed restrictions under Reclamation’s new plan.
- Prescriptions for additional technological measures at the facilities to enhance screening and increase survival of fish.
There will be fewer planned upgrades to project facilities to protect fish than were promised under the previous BOs.
- Prescribed additional measures to improve survival of San Joaquin steelhead smolts, including both increased San Joaquin River flows and export curtailments.
No longer apply.
- Prescribed flow management standard, a temperature management plan, additional technological fixes to temperature control structures, and, in the long term, a passage at Nimbus and Folsom dam to restore steelhead to native habitat.
No longer apply.
- Prescribed year-round minimum flow regime necessary to minimize project effects to each life-stage of steelhead, including new springtime flows that will support rearing habitat formation and inundation, and create pulses that allow salmon to migrate out successfully.
No longer apply.
- The Fall X2 provision has been eliminated.
This flow-salinity RPA protected longfin and Delta smelt in summer and fall of wet years.
- Take limits have been eliminated.
They should have been revised to be more protective.
What is Missing
So much is missing that is within state and federal governments’ power and authority in the final approved Reclamation proposal. Here is a limited selection.
- Effective Management of Shasta Cold-Water Pool
Missing from the BOs are controls of Spring Creek powerhouse warm water releases into Keswick Reservoir, modifications to hydropower operations, long term Shasta storage rules, and modifications of water contractor deliveries. Combinations of these actions would have alleviated winter run salmon recruitment failures in 2014 and 2015. Reclamation’s approved proposal would allow such drastic recruitment failures in future droughts.
- Commitment to comply with water quality standards on flow, water temperature, salinity, and export restrictions
Reclamation has made no commitment to comply with state water quality standards or other state laws.
- Commitment to provide needed pulsed flows
Coordinated pulsed flows are needed to increase survival of hatchery and wild salmon. None are included in Reclamation’s plan, with the possible exception of a pulse from Shasta when it is likely to spill anyway.
- Commitment to implement recovery plan actions
Recovery, not just protection, is needed and is required by the ESA. These BO’s do not address recovery plans. The ESA goes beyond simple mitigation. The ESA focuses on minimization of effects, enhancement, and recovery.
In Conclusion: Ugly
Reclamation’s proposed action has been approved by the Services. The proposed action includes some good concepts for protective measures (though generally the requirements are vague, underfunded and not enforceable), and a suite of bad and downright ugly actions that will harm affected listed fish species. The overall mix will lead to much confusion, wringing of hands, blaming, ignoring of responsibility, initial lawsuits, and (if the initial lawsuits fail) further lawsuits when fish metrics fail to show improvement. Some actions will take time to implement, while some are already too little too late.
The Services should have issued jeopardy opinions with a suite of appropriate RPAs. That did not happen. Instead, the Services are allowing further risk of extinction to the listed species. The best example of this is allowing expected temperature-dependent egg mortality levels for Sacramento River winter-run Chinook salmon to occur in “Tier 3 and 4 years.” Mortality due to allowed temperature exceedance was a major cause in the recent decline in the winter-run salmon population, one of the few species listed as “endangered” rather than the more common “threatened” designation. The effect the salmon BO will allow is entirely avoidable and within the control of the state and federal agencies involved in permitting the CVP. NMFS has designated winter-run as a “Species in the Spotlight”; it’s more likely that it is now a “Target for Extinction.”