In a 10/31/17 post, I described record low spring-run Chinook salmon runs in Sacramento Valley rivers in 2017, with emphasis on the Feather River, the largest component of the Central Valley spring-run population. In this post, I update information on Central Valley spring-run. The combined Central Valley runs of spring Chinook salmon were indeed at record low levels in 2017 (Figure 1). The run total includes escapement to all Central Valley streams that host spring-run salmon, including Battle Creek, Clear Creek, Butte Creek, Antelope Creek, Big Chico Creek, Cottonwood Creek, Mill Creek, Deer Creek, Antelope Creek, Feather River-Yuba River, and the mainstem Sacramento River.1
I plotted these numbers in a spawner-recruit relationship, with spawners being recruits three years earlier (Figure 2). The water year type during the first winter-spring following spawning is shown in Figure 2 by color. Winter-spring conditions reflect early rearing and emigration conditions in spawning rivers, as well as conditions in rivers downstream an in the Bay-Delta.
Factors contributing to poor recruitment in the eight critically dry years in the observed period include low river flows, high water temperatures, excessive predation, loss at water diversions, and low turbidity, all factors that are inter-related. Poor ocean conditions and hatchery operations also were likely factors, which may also be related directly or indirectly to river flows.
Most recent recovery efforts and planning have focused on habitat restoration.2 My own focus has been on poor river conditions (low flows and high water temperatures) and related predation.3 My reasoning is based on escapement trends over the past decade that indicate sharply dropping escapement during dry year low-flow conditions in most of the spawning rivers (Figures 3-5).
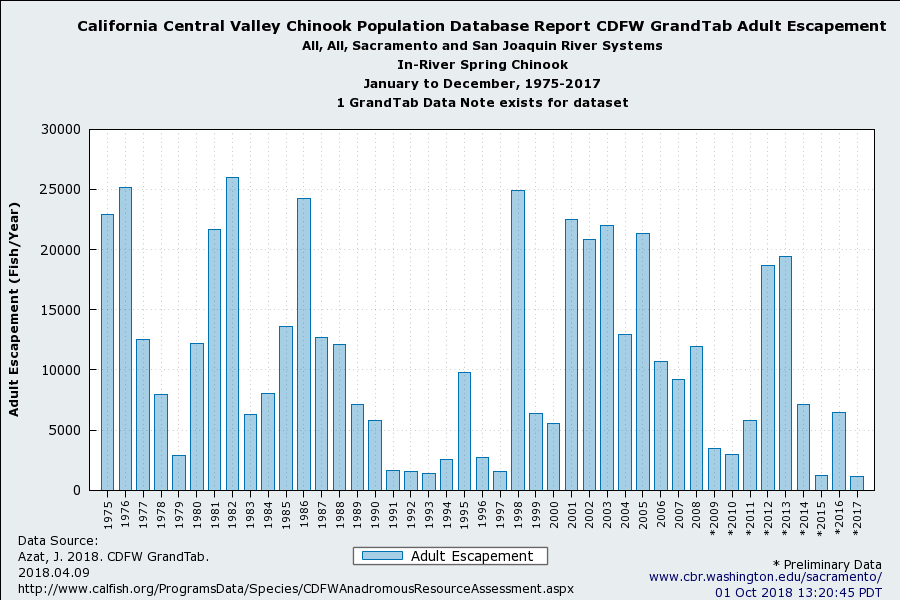
Figure 1. Spring run salmon in-river escapement (spawning run size) in the Central Valley from 1975 to 2017.
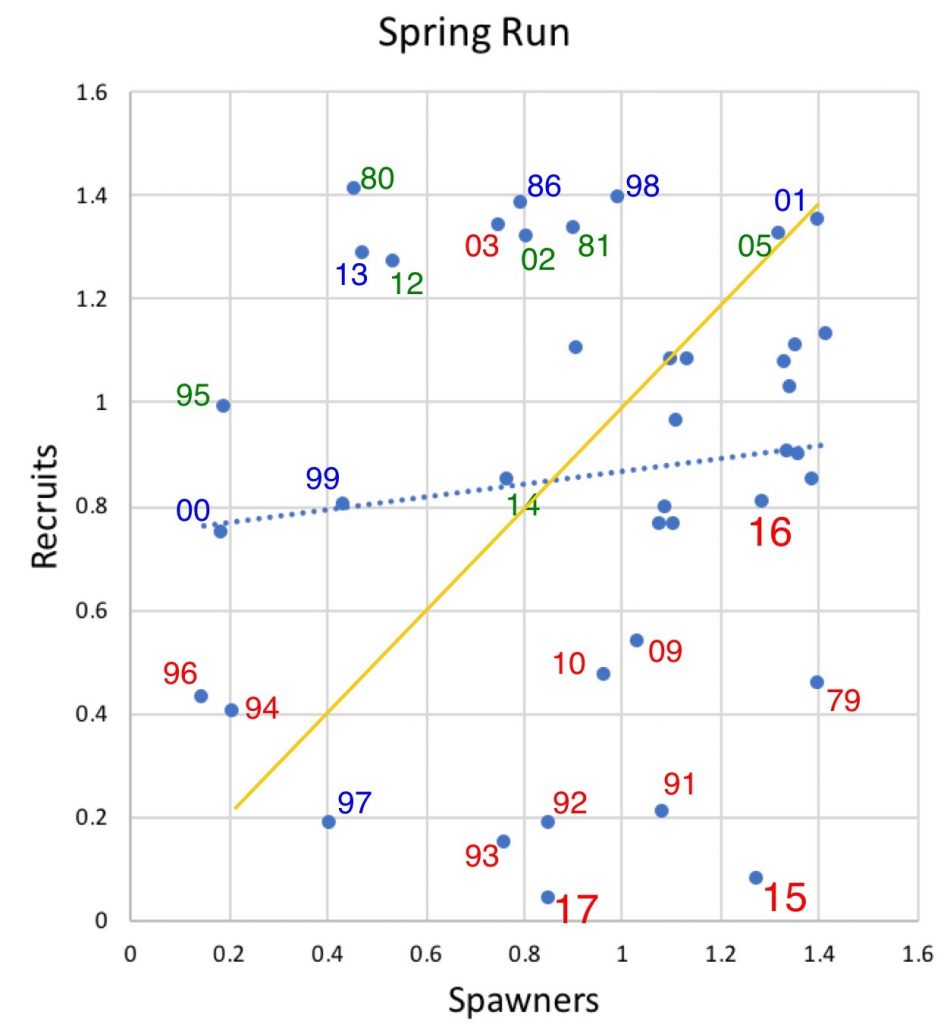
Figure 2. Spawner-recruit relationship for Central Valley river escapement of spring-run Chinook salmon. Recruits represent spawner escapement for that year. Spawners are recruits from three years prior. Numbers are log10 of escapement minus three. Red represents dry years during winter-spring after fall spawn. Blue represents wet years. Green represents normal years. Blue dotted line is statistical trend line. Yellow line is replacement level. Note eight points in bottom-right quadrant represent winter-springs of critically dry drought years (77, 89-91, 07-08, 13, and 15).
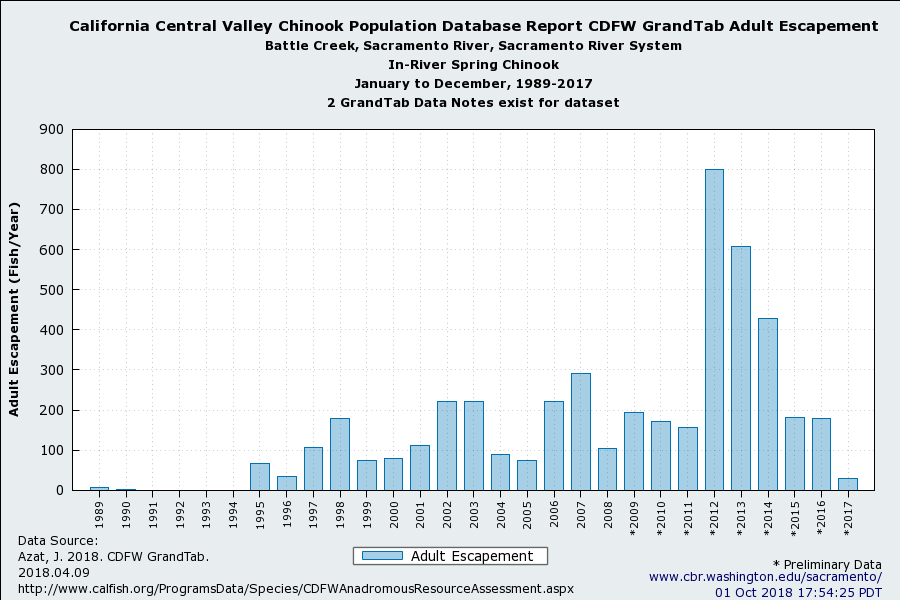
Figure 3. Battle Creek spring run salmon escapement from 1989 to 2017.
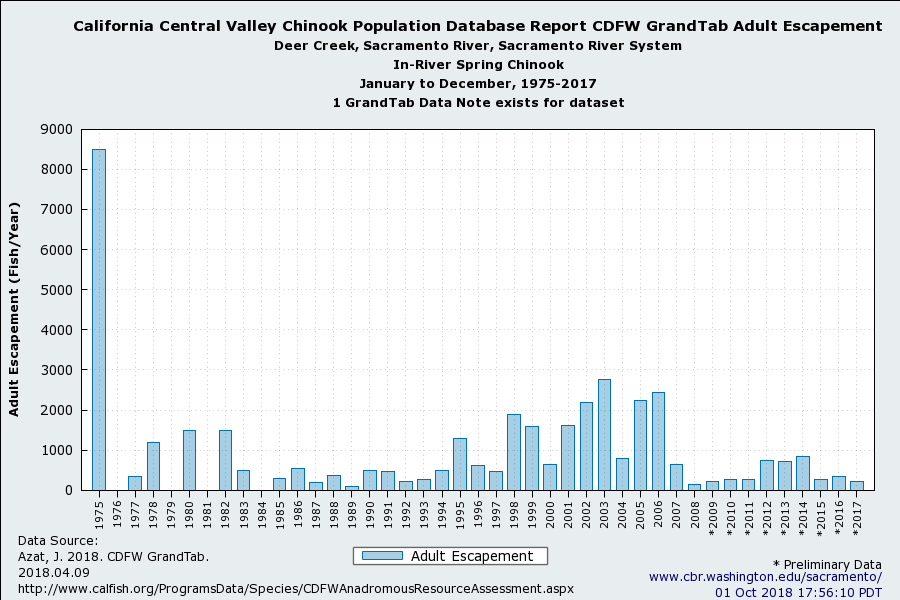
Figure 4. Deer Creek spring run salmon escapement from 1975 to 2017.
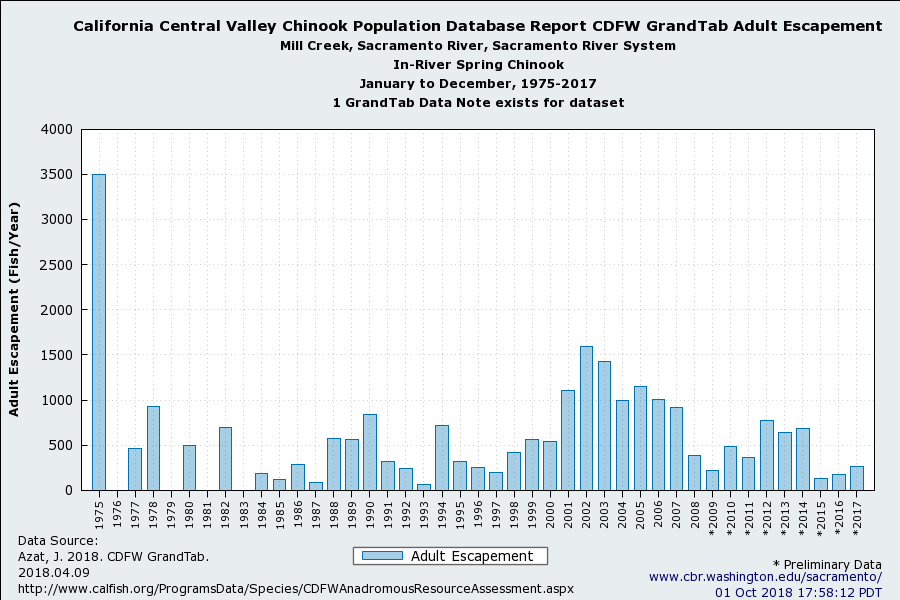
Figure 5. Mill Creek spring run salmon escapement from 1975 to 2017.