A recent paper in the North American Journal of Fisheries Management1 describes a nationwide 20% decline over the past two decades in sport fishing for trout. The trout angling population is getting older, while the number of young recruits is declining. With shrinking revenues from license sales, trout anglers and agencies are concerned about potential reductions in the numbers of trout stocked and the quality of popular trout fisheries supported by stocking.
Though the researchers found little relationship between the numbers of trout stocked and catch rate (within normal levels of stocking and catch rates), they did find a positive relationship between angler satisfaction and catch rate in the Virginia lakes and rivers they studied. They also found greater satisfaction with greater size of trout caught. Average catch rates of stocked trout were approximately one per hour. Total angling hours were much higher for lakes than streams primarily because of ease of access and less need for equipment.
Because numbers of trout stocked were not significantly related to catch or angler satisfaction, the researchers suggested reductions in stocking rates to counteract longterm losses in license revenues. Because this would seem counter-productive to sustaining angler interest and effort, they suggested:
“Beyond catch metrics, we believe that demystifying the programs by increasing transparency and increasing the communication of stocking densities and the persistence of catch rates—two common concerns—may increase retention and possibly lead to the recruitment of new anglers. We encourage information exchange between agencies and their anglers.”
This past June, I wrote a post on Lake Davis, a popular Sierra trout fishery. In that post, I spoke of perceived angler dissatisfaction with low catch rates. Rates had fallen well below one-per-hour in recent years, into the range where angler satisfaction was very low in the above-described research paper. I suggested that the poor catch rate was possibly due to low stocking rates, although other factors were possible (e.g., drought-related low water levels). This fall, I have noticed a sharp uptick in the catch rate at Lake Davis and a corresponding increase in angler satisfaction and effort. Catch rates from both shore and boat, for both bait and fly anglers, increased into the 0.5 to 1 fish per hour range, with the large size of the fish pushing angler satisfaction (and seasonal effort) to near maximum. Given the large average size of the trout, I assume the catch rate increase is not due to higher stocking rates, because fish are usually relatively small when they are stocked. A reasonable hypothesis is that warm water in Lake Davis, due to low water levels and lack of snowmelt this past spring and summer, probably put fish off the bite.
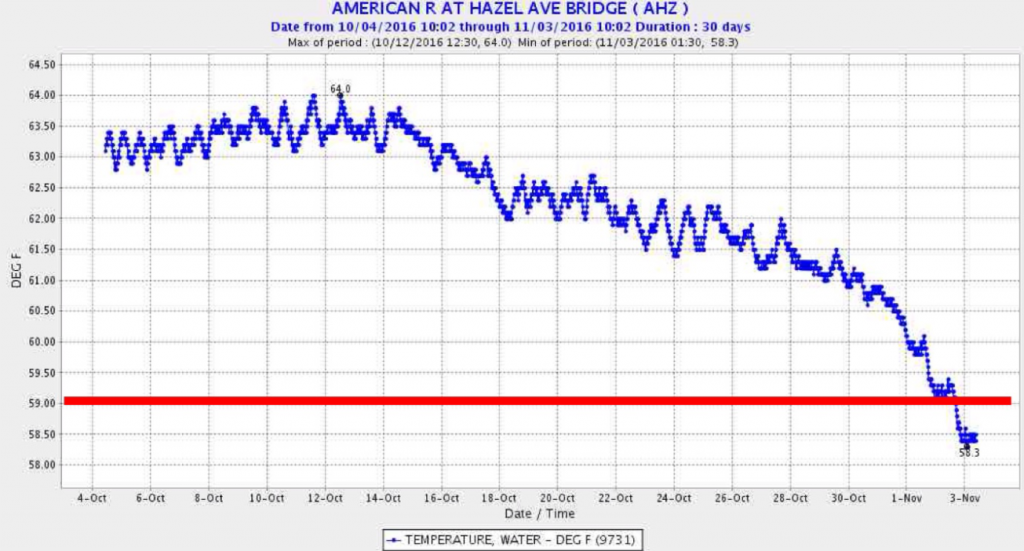
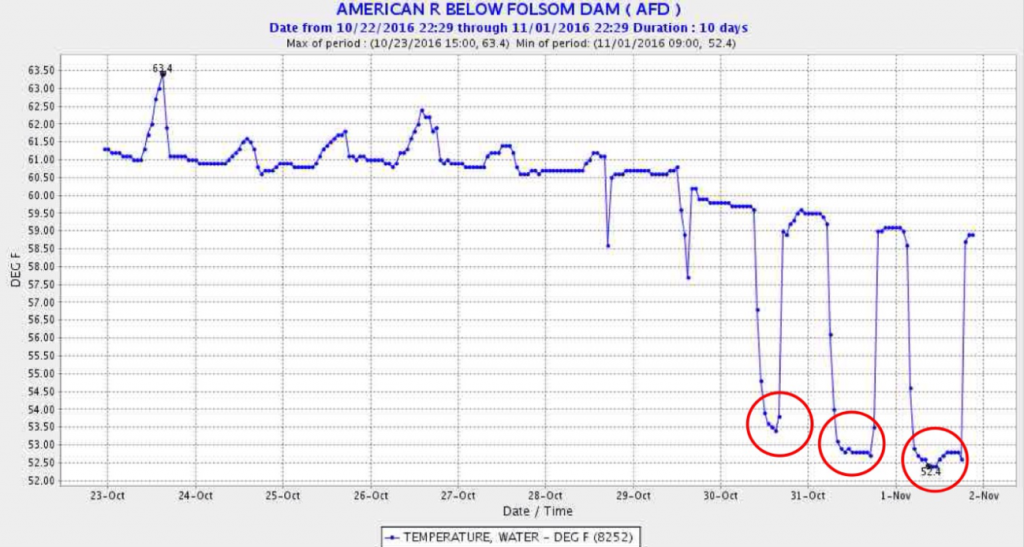
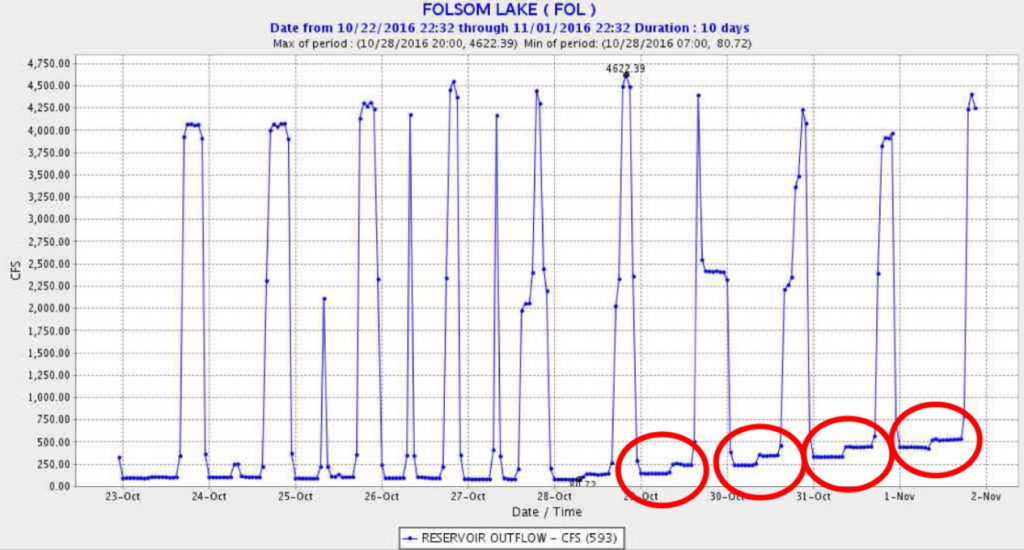
A final thought on declining numbers of licensed anglers. While CDFW does sponsor activities that promote angling for young people (see photo below), there is no general program promoting efforts, projects, and specific fisheries around the state. A more comprehensive program designed to increase angling participation, such as the programs offered by other states (e.g. Michigan, Oregon, Texas, etc.), would help to increase angler recruitment. I like Michigan’s weekly fishing report and its fishing tips reports. CDFW needs to generate more excitement with up-to-date news, tips, maps, and techniques. Biologists, wardens, and creel census clerks collect a lot of information that they could share through volunteers or the CDFW blog. CDFW could also post, link or summarize reports from guides and shops (while giving appropriate credits). CDFW could also report on how it is managing fisheries around the state how these fisheries are faring. One topic of interest to many anglers I know is a new fishery that has appeared in the American River, apparently as a consequence of stocking trout (steelhead smolts) from the Battle Creek hatchery (Redding) in the American River (see photos below).
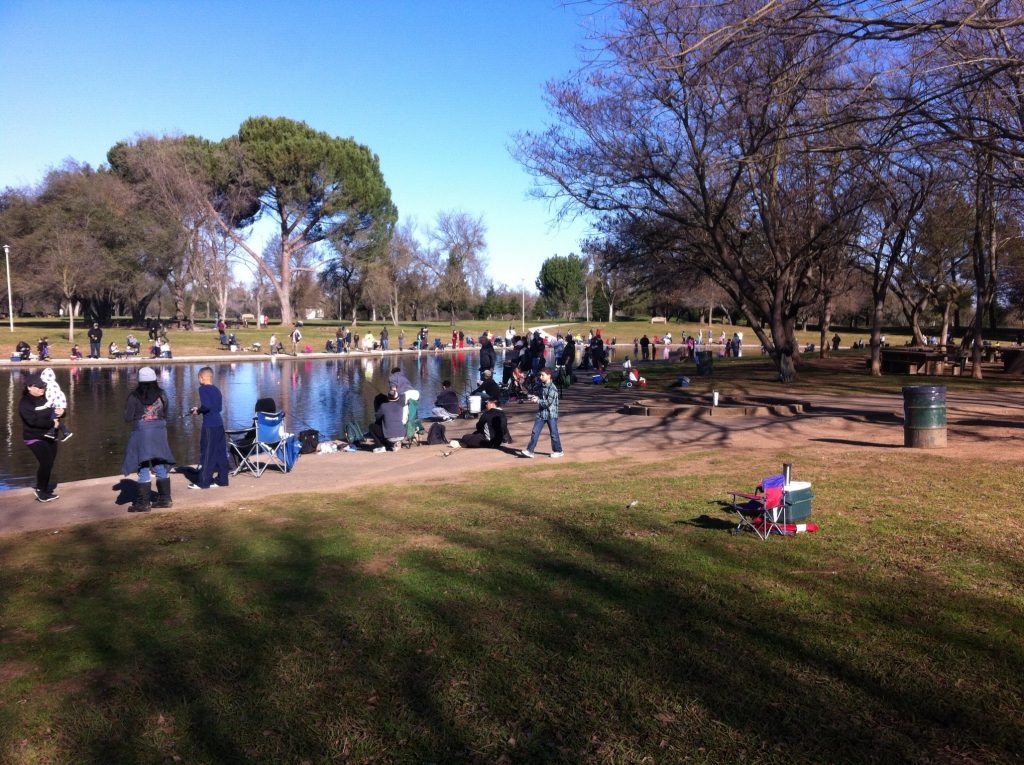
Fishing in the City event sponsored by CDFW. Young people love these events, but the program needs to follow up with other elements to sustain their interest.
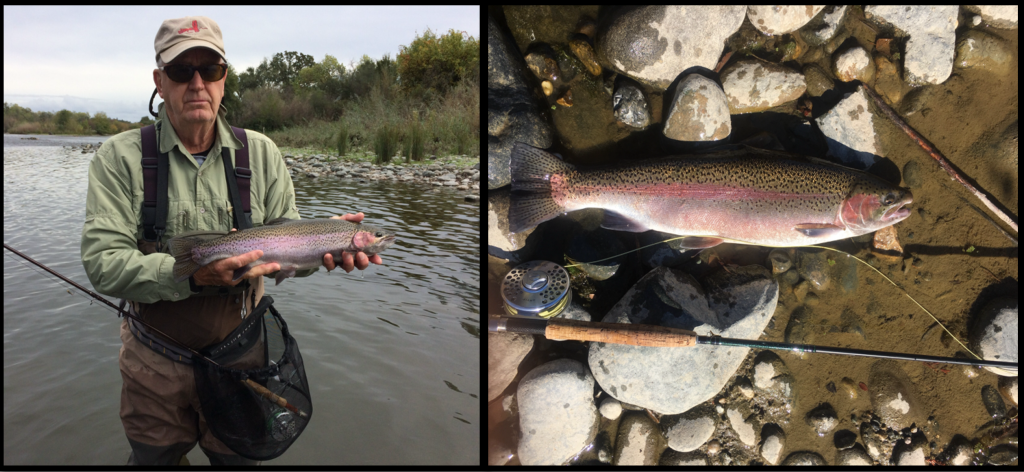
Are these American River fish steelhead from the Battle Creek Hatchery?
- Abstract available at http://www.tandfonline.com/doi/full/10.1080/02755947.2016.1221003 . ↩