
The San Joaquin River appears to be seeing a boon in salmon runs this year despite the recent drought. Editor Dennis Wyatt of the Manteca Bulletin suggested on December 14 that “robust” salmon runs on the San Joaquin River in recent years “discredit” state claims that more of unimpaired flow of the Stanislaus, Tuolumne, and Merced rivers should be passed to the Bay-Delta:
Spawning adult numbers after being in the 1,000 to 2,000 range from 2006 through 2011 now consistently surpass 5,000 despite the drought. The scientific research conducted by FISHBIO over the past decade and underwritten by the South San Joaquin Irrigation District and Oakdale Irrigation District is being used by the two water agencies to discredit state claims that the only way to increase salmon on the Stanislaus River — and the neighboring Tuolumne and Merced rivers — is by ratcheting up unimpaired flows to 40 percent between February and June. 1
This theory is circulating among supporters of water purveyors who draw water from the Stanislaus. For example, Mr. Wyatt’s editorial was reproduced verbatim on Congressman Jeff Denham’s website.2
One of the main reasons for the recent decade of run increases is most likely increases in flow requirements in the spring and fall as mandated in the National Marine Fisheries Service’s 2009/2011 biological opinion for the Central Valley Project. It is more logical that further flow improvements would lead to further salmon enhancements, perhaps even approaching target levels specified in the Central Valley Project Improvement Act of 1992 (CVPIA).
There is a long way to go. The so-called robust runs are far below the CVPIA target of 78,000 salmon for the San Joaquin, numbers that were most recently achieved in Water Year 2000 (Figure 1). While there have been improvements during the last ten years, eight of which were drought years (Figure 2), runs are still about 70,000 fish short of the doubling goal.
In addition, much of the recent improvement is related to increased hatchery production from the state hatcheries on the Mokelumne and Merced rivers (Figure 3). Hatchery production also benefits from trucking hatchery smolts to the Bay. Runs in the Stanislaus and Tuolumne also benefit from strays from the two hatcheries. The CVPIA doubling goal is for natural production.
Finally, there needs to be defined fall flow pulses in addition to higher spring flows. Fall pulse flows reduce water temperature in the three tributaries and mainstem during the fall migration period. In the past, drought year fall flows were depressed (Figure 4). This made it harder for fish to find the San Joaquin tributaries and led to high fall water temperatures (Figure 5). High temperatures can block or hinder adult salmon migration, reduce adult pre-spawn survival, and lower egg viability. Lack of fall flow pulses in 2014 and 2015 led to poor salmon escapement, especially in the Tuolumne and Merced Rivers. Higher flows and lower water temperatures in the Stanislaus in 2015 likely led to a greater proportion of the overall San Joaquin run choosing the Stanislaus River (Figure 2). Fall flows from tributary reservoirs should be sufficient to maintain tributary water temperature below 60°F and San Joaquin River temperatures below 65°F. These goals are achievable in most water years, and were for the most part achieved in the San Joaquin River in October, 2016 (Figure 5).
Sorry, folks. Flow matters.
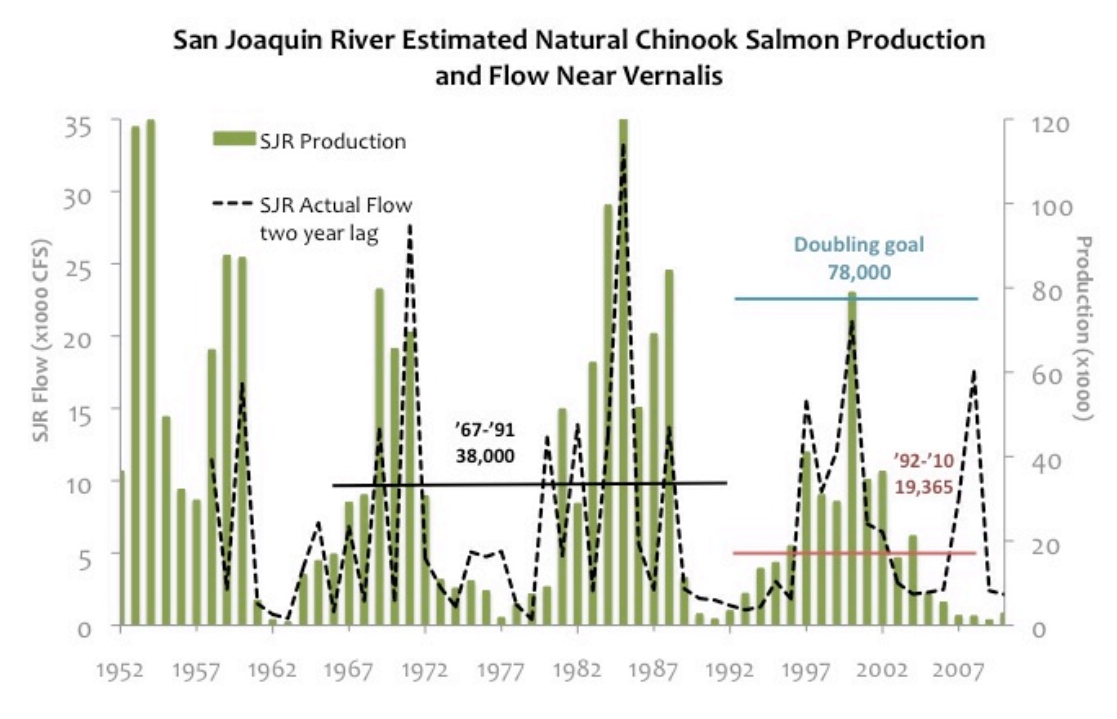
Figure 1. San Joaquin salmon production 1957-2010 as related to flow two years earlier. Source: Appendix C, SWRCB 2012.
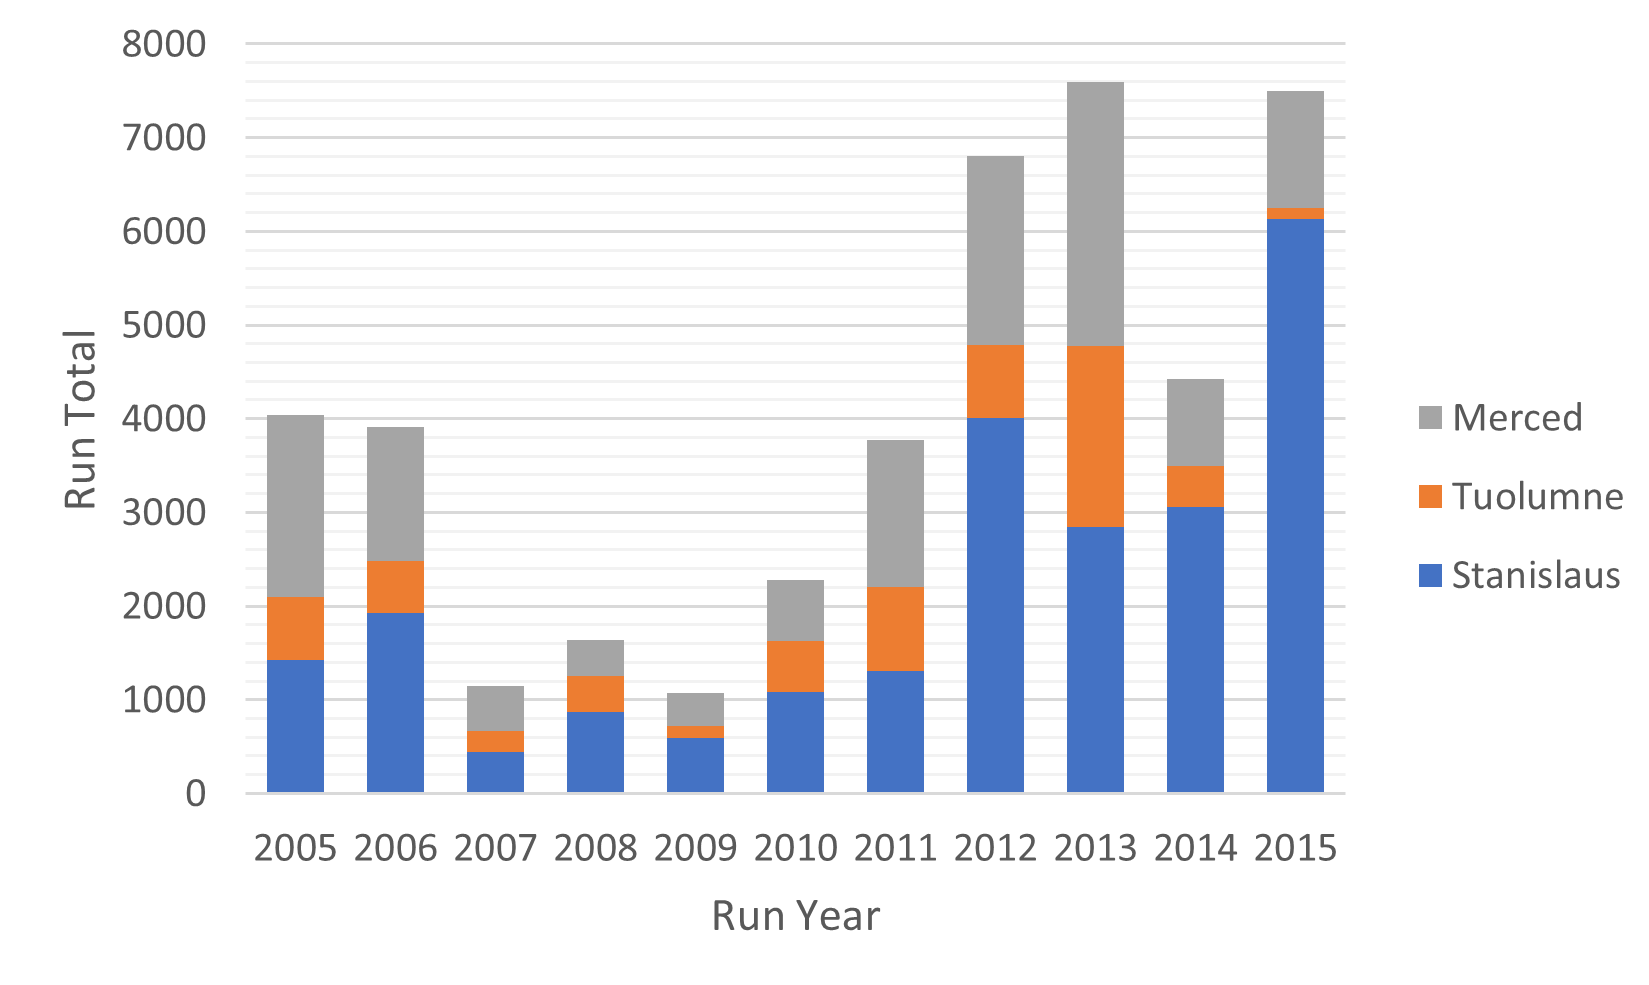
Figure 2. Salmon run totals (escapement) from the Stanislaus, Tuolumne, and Merced rivers 2005-2015. Data source: CDFW.
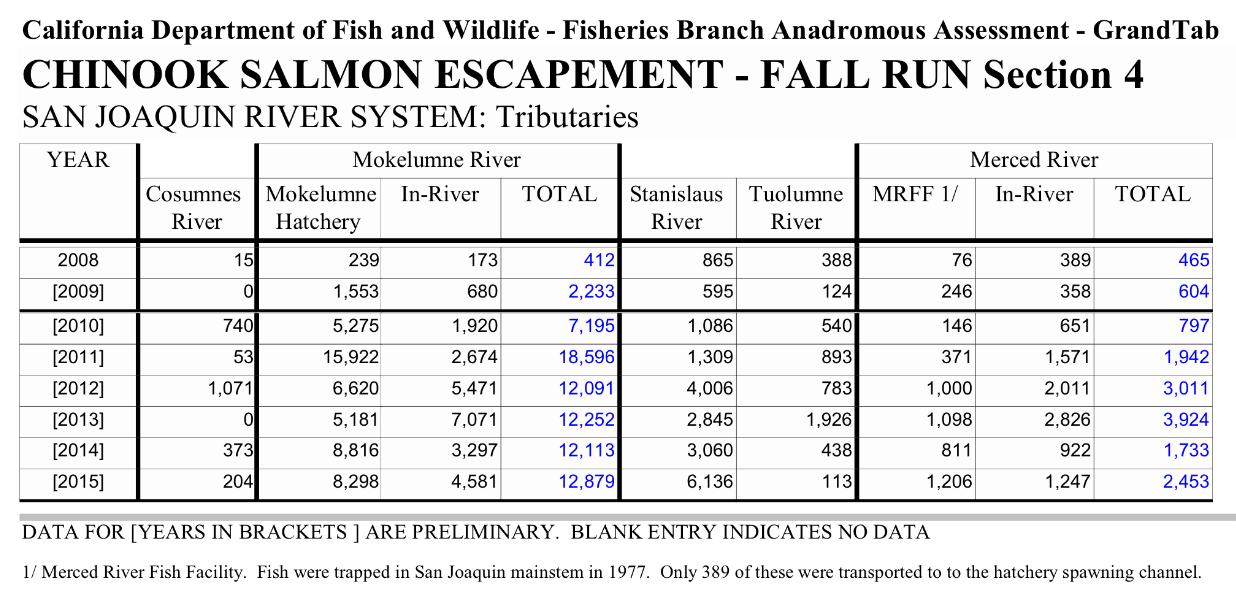
Figure 3. San Joaquin salmon escapement from 2008 to 2015. Source: CDFW.
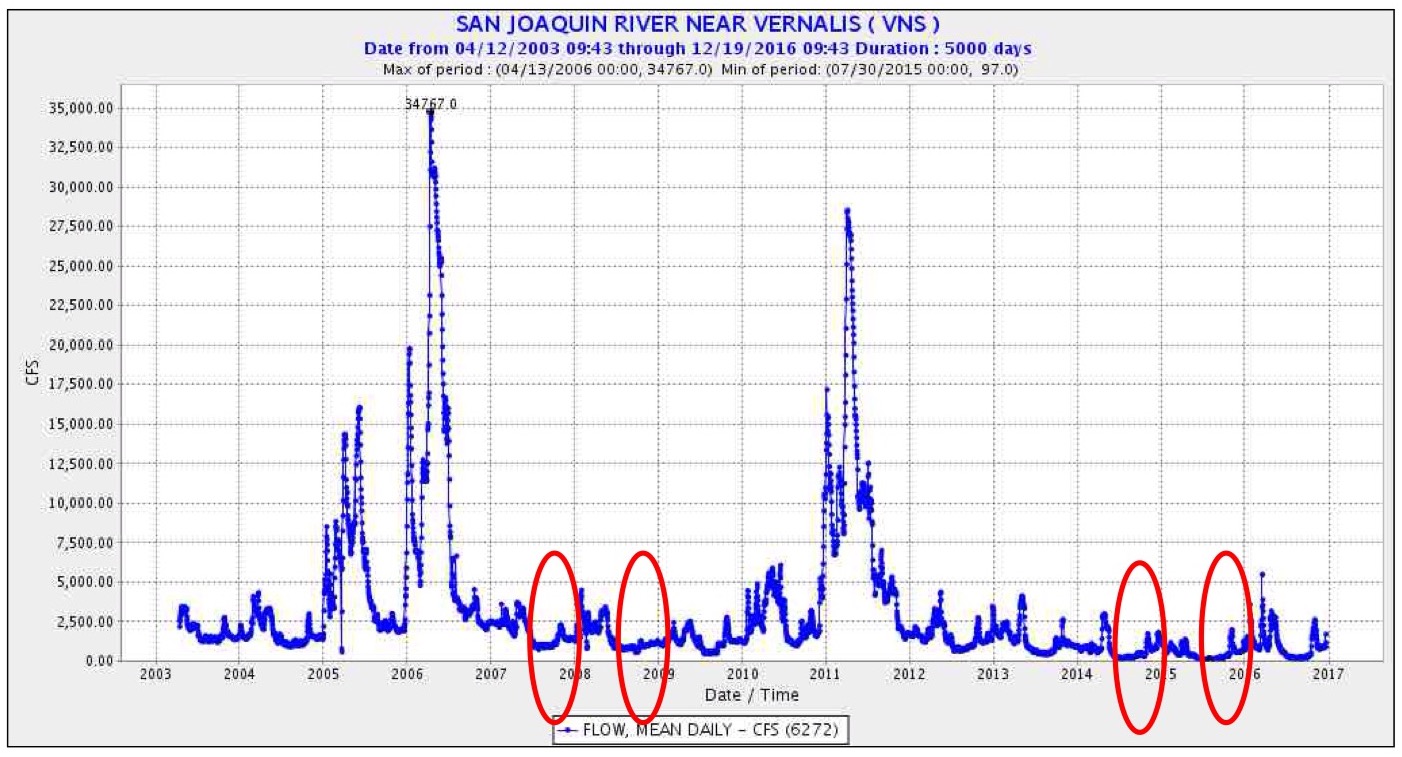
Figure 4. San Joaquin River flow 2003-2016 at Vernalis (downstream of confluence with Stanislaus, Tuolumne, and Merced rivers). Red circles denote drought years lacking adequate fall flow prescriptions.
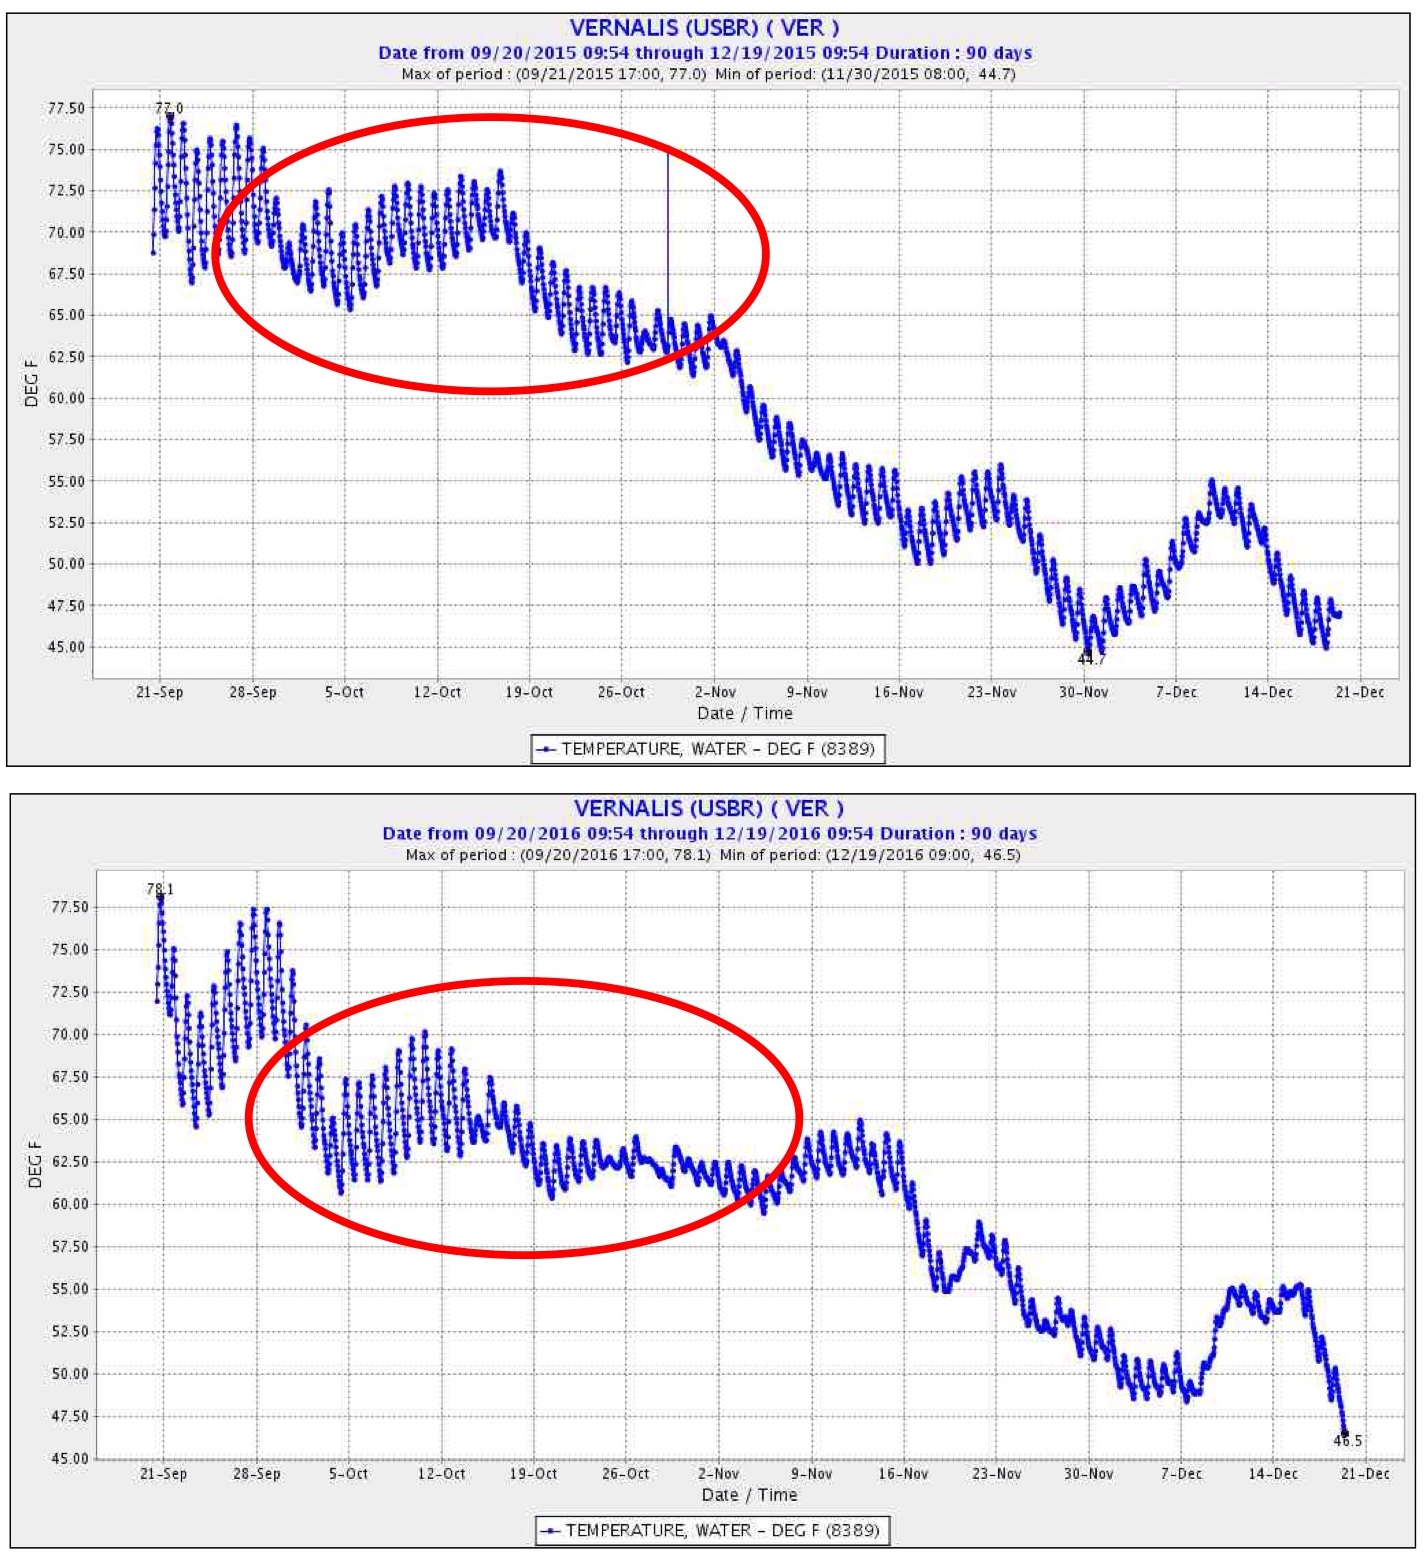
Figure 5. Fall water temperature of San Joaquin River at Vernalis in 2015 (top) and 2016 (bottom). Red circles denotes key salmon migration period when fall flow prescriptions occur. Note higher water temperature in 2015 compared to 2016, which had higher fall flows. Source: CDEC.