When I last assessed the status of the fall-run salmon population of the Yuba River near Marysville in a 1/31/22 post, I stated: “The population remains in a very poor state – at about 10% of recent historical levels during and subsequent to multiyear droughts 2007-2009 and 2013-2015 (Figure 1).” Since the record low run in 2017, the fall run on the Yuba River has not recovered.
The failure of the four more recent runs to show signs of recovery (Figure 1) is especially concerning because 2017 and 2019 were wet years. The failure to recover may be simply the lingering effects of the drought years 2014-2015 and the ongoing effects of the 2021-2022 drought. More likely, the spawning stock has collapsed and is in dire need of support. The 2022 run appears to be even worse than the past four runs, thus adding to the concern.
This post delves into the many possible causes of, or contributors to, the collapse of the Yuba River fall-run salmon population. The story is a complicated one. It starts with broodyear 2014.
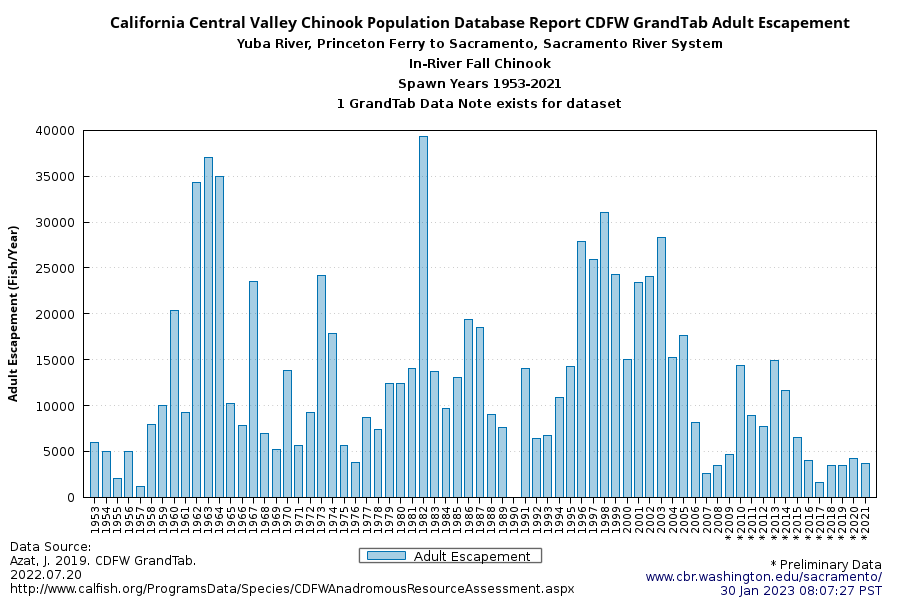
Figure 1. Yuba River fall-run salmon spawning escapement estimates 1953-2021. (Data source: GrandTab)
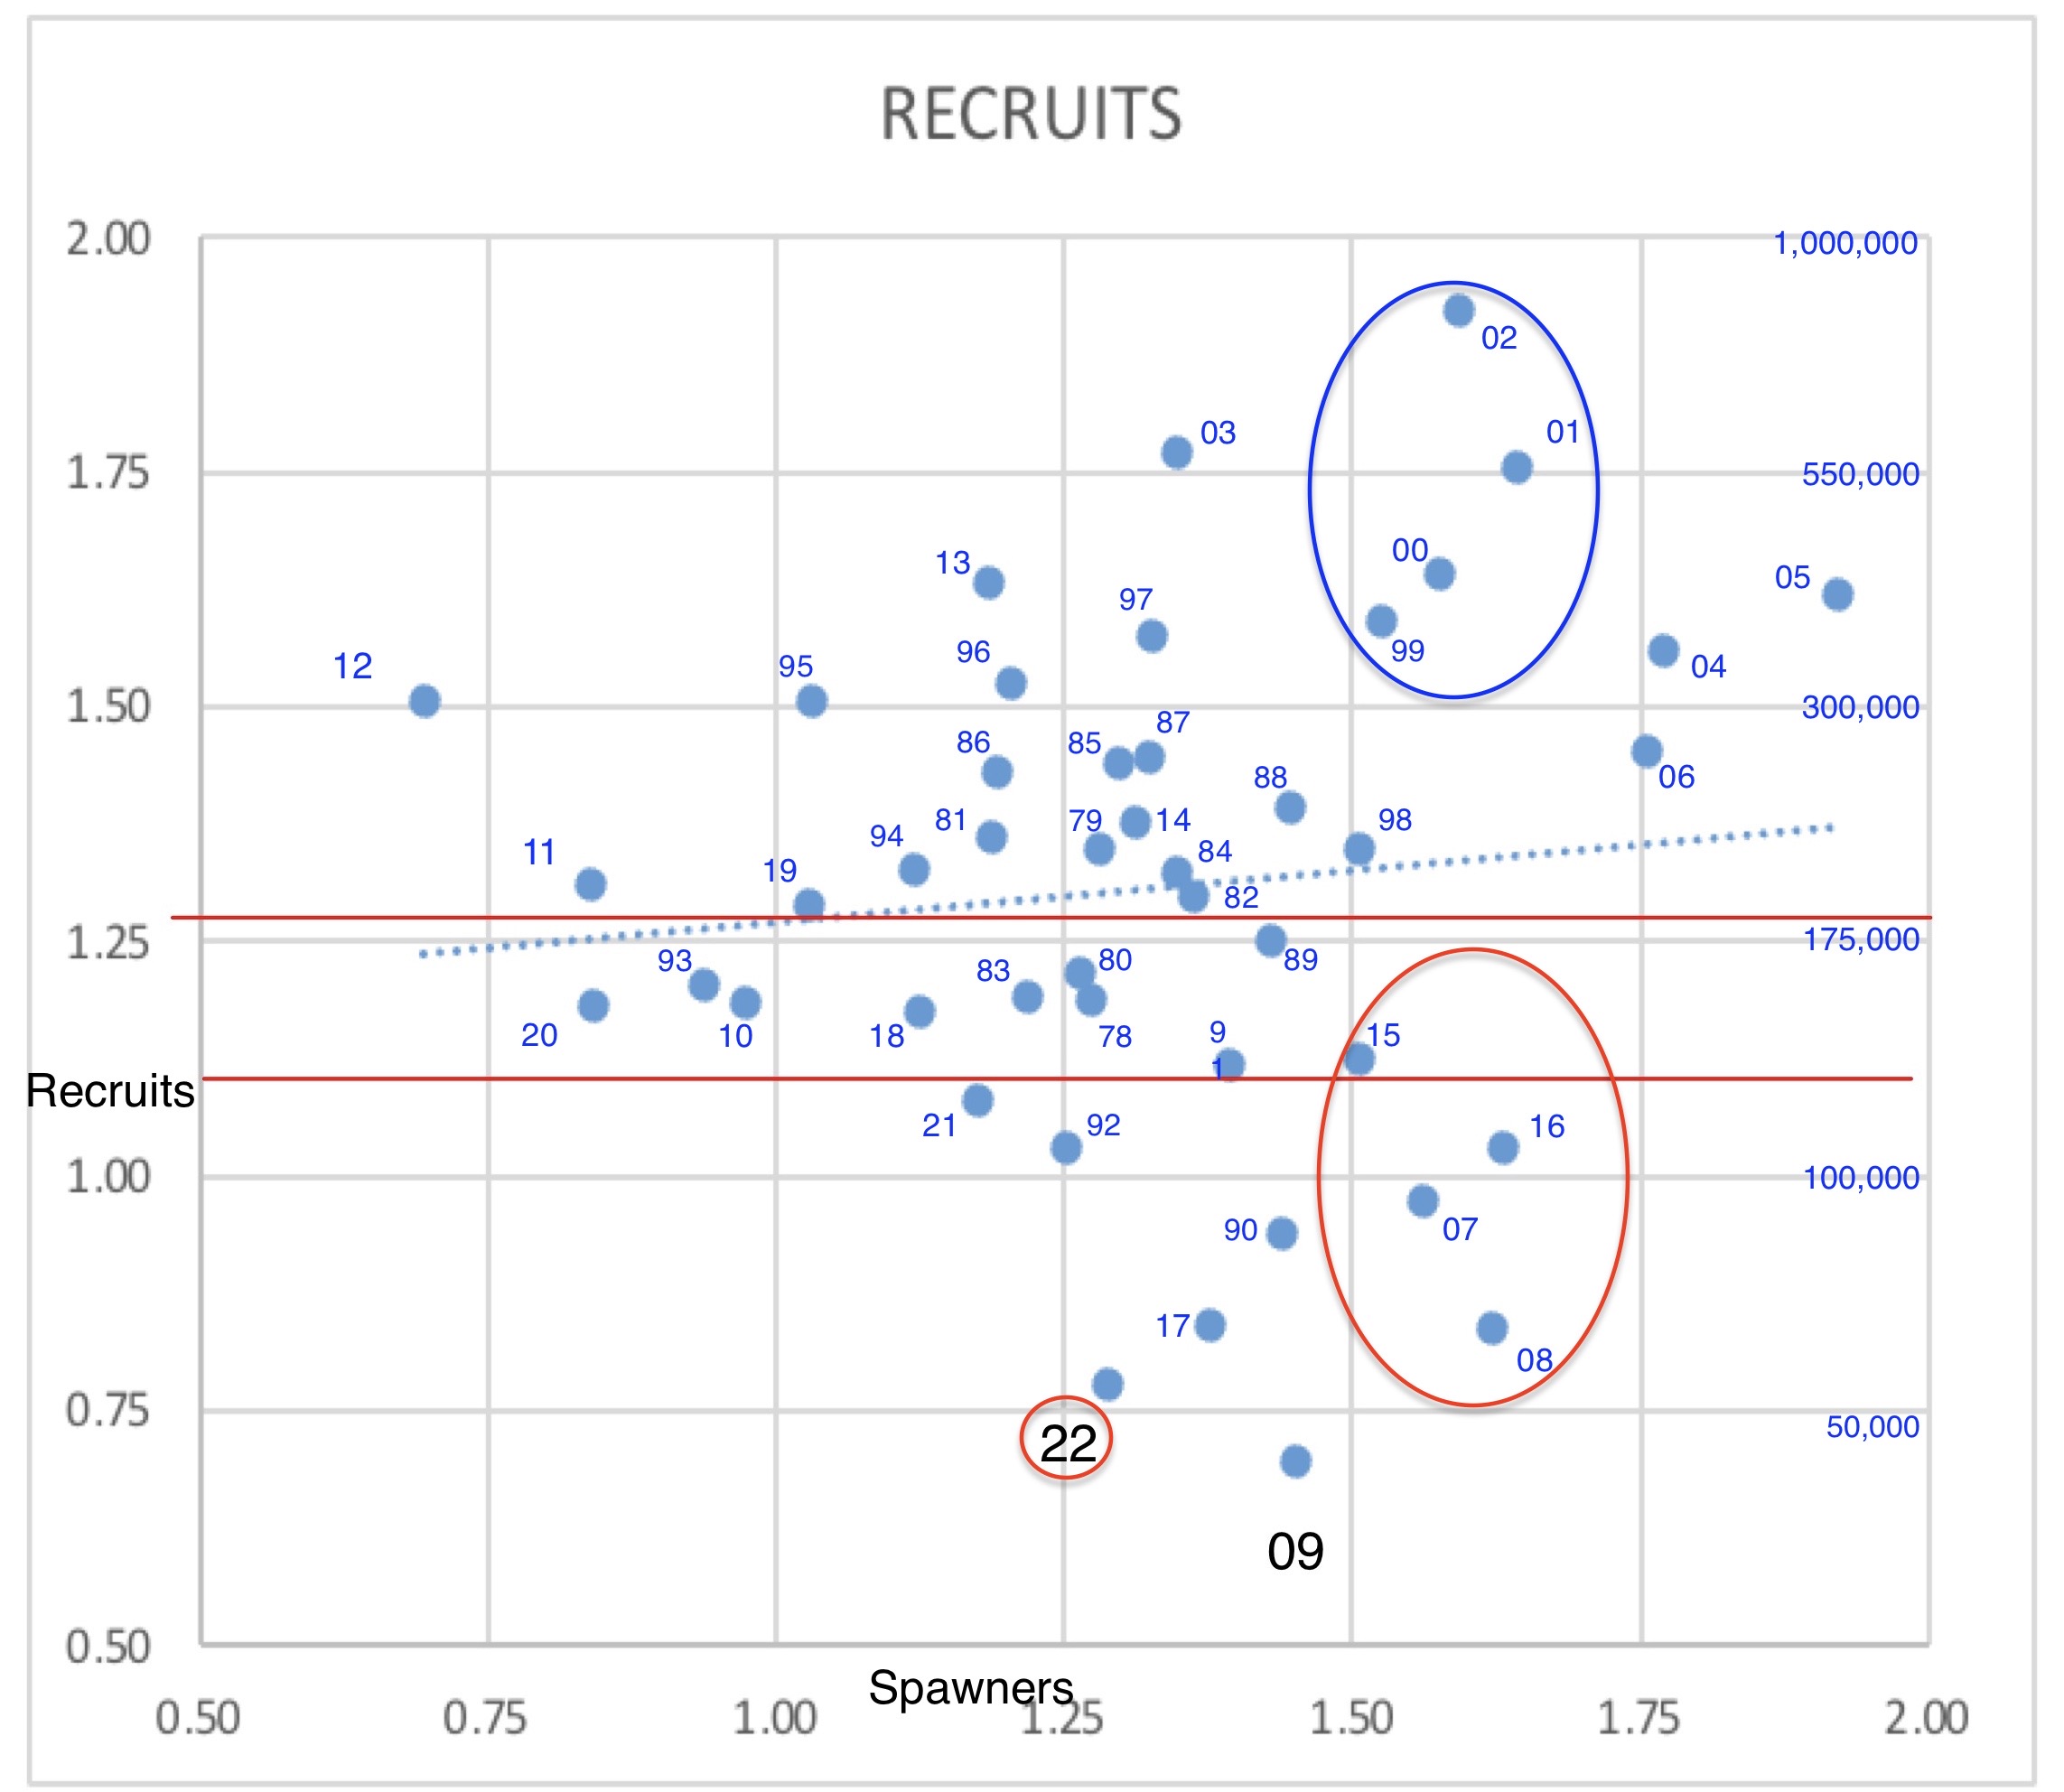
The first stop in pursuit of the potential causes of the recruitment failure that has occurred not only on the Yuba River, but in most of the other Central Valley fall-run salmon populations, is a close look at the escapement data. The spawner-recruitment relationship (S/R) shown in the escapement data (Figure 2) provides a closer perspective than the simple histogram of the run sizes (Figure 1).
The S/R figure is a plot of the log of the escapement with the log of the escapement three years earlier. This is because about 80-90% of spawners are three years old. The three red lines in Figure 2 show that adult spawners in 2014 produced the spawners 2017, which in turn produced the spawners in 2020. The adult spawners in 2018 produced the spawners in 2021. Spawners in 2019 produced spawners in 2022, which based on the incidental reports will likely show up to the lower left of 19. The lower-left quadrant of an S/R plot is usually a place where a salmon population is headed toward collapse and an inability to sustain itself.
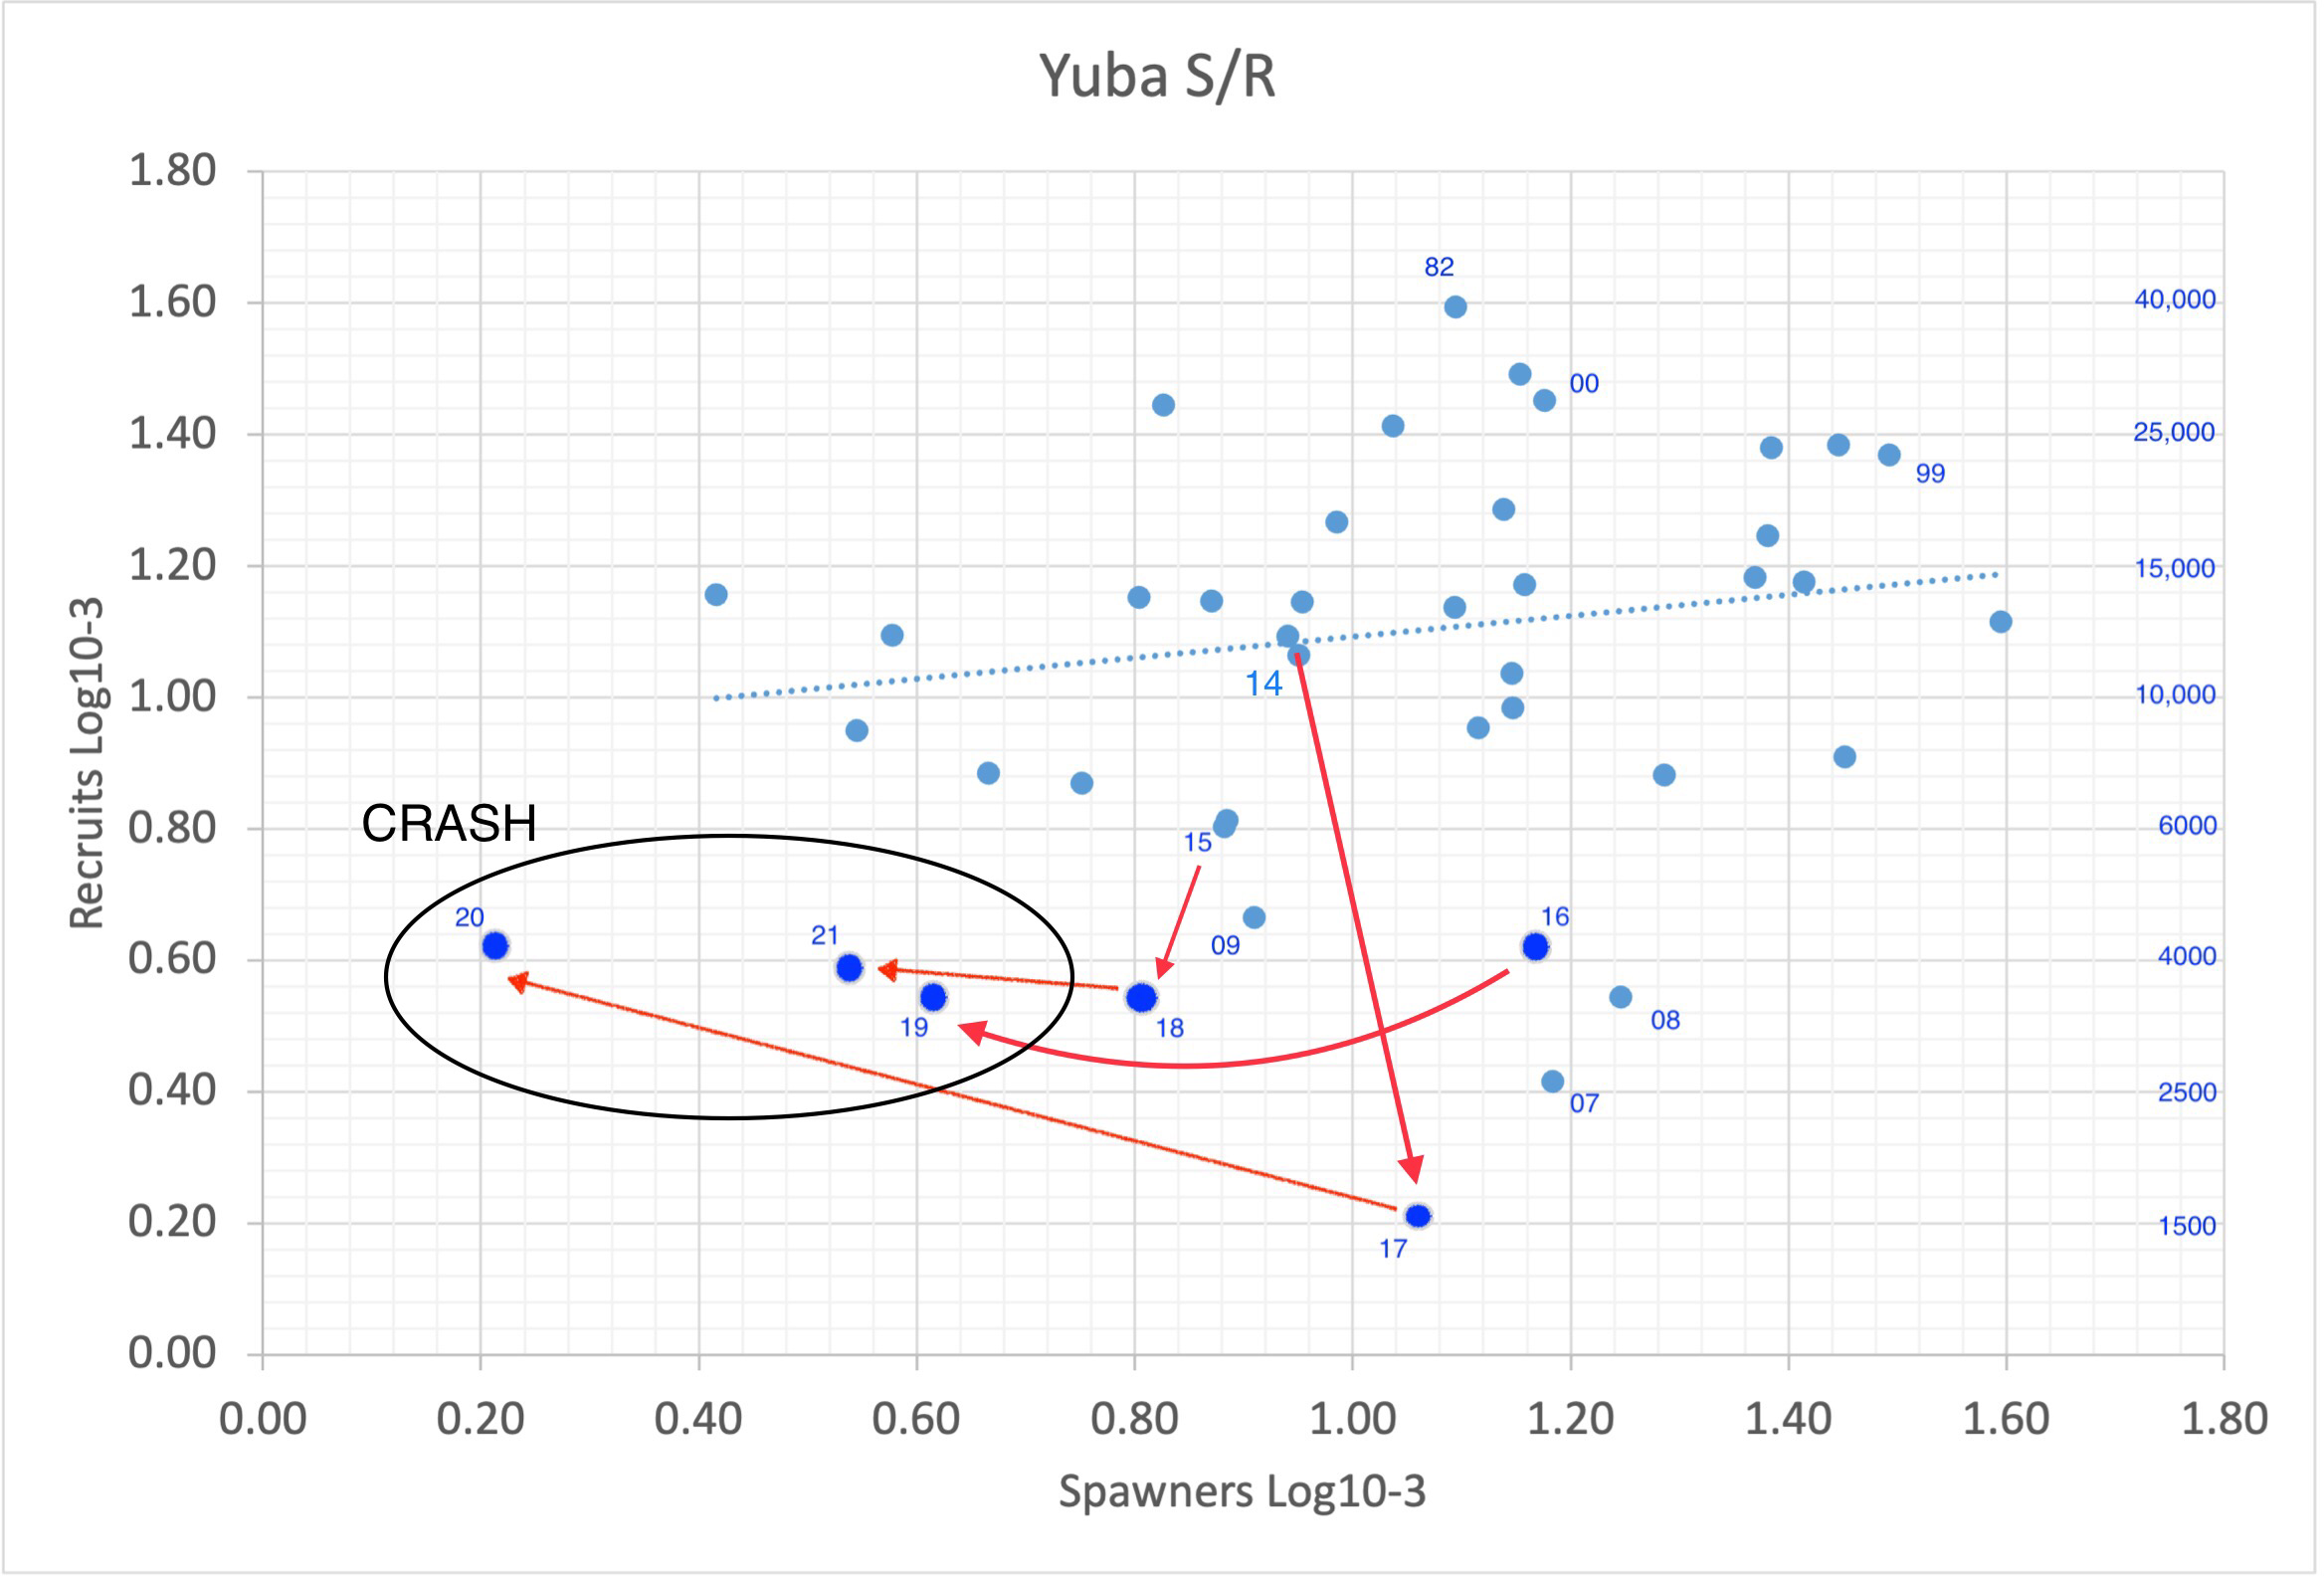
Figure 2. Yuba River fall-run salmon spawner-recruit relationship (1978-2021) with recruit number shown in chart for specific years. Red lines point from spawner to recruit year. For example, recruits in 2017 led to recruits in 2020. Recruits in 2014 (12,000) led to only 1500 in 2017.
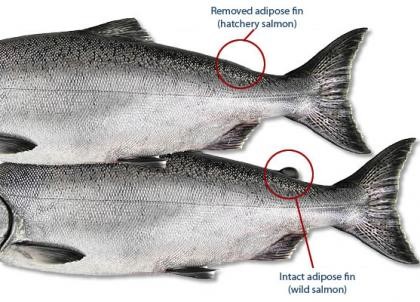
When Yuba River escapement (recruitment) is adjusted for strays from other rivers, the recruitment level in record low 2017 (Figure 3) shows itself to be even more dire. The Yuba River receives many strays because it carries a strong cold-water signal into the Feather River and on into the lower Sacramento River in late summer and early fall. The Yuba River also attracts spring-run and late-fall-run hatchery salmon that are included in the Yuba River’s fall-run spawning counts.
It is helpful to start the analysis of the 2017 population crash by reviewing the early life cycle of broodyear 2014 – as eggs in their mothers. Their parental stock, broodyear 2011, had been reasonably normal, if not in the range that might be considered the Maximum Sustained Yield 10,000-15,000 (Figures 1 and 2). The strong numbers of broodyear 2011 spawners (and their broodyear 2014 eggs) arrived in the Bay in summer 2014. The questions become what happened to:
- those broodyear 2011 adult females;
- their broodyear 2014 eggs and their hatchlings in summer-fall 2014;
- the surviving broodyear 2014 fry in winter 2015; and smolts in spring 2015;
- the yearlings, two-year-olds and three-year-olds in the ocean; and finally
- the adults making up the 2017 run counted in the Yuba River spawning grounds.
The answer is that survival conditions were not good for all five categories above. Each question is addressed below.
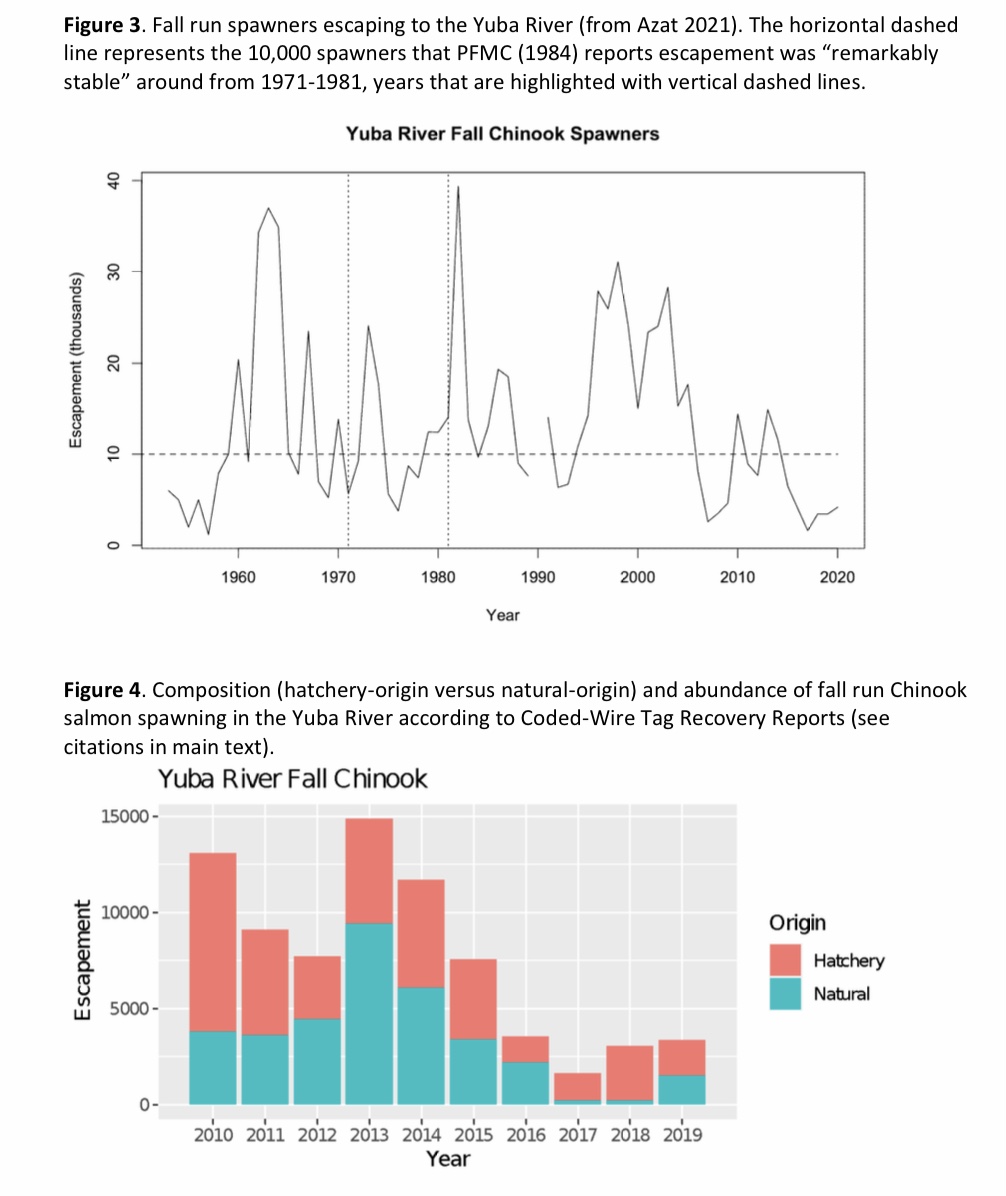
Figure 3. Yuba River escapement numbers. Source: PFMC 22, p.49.
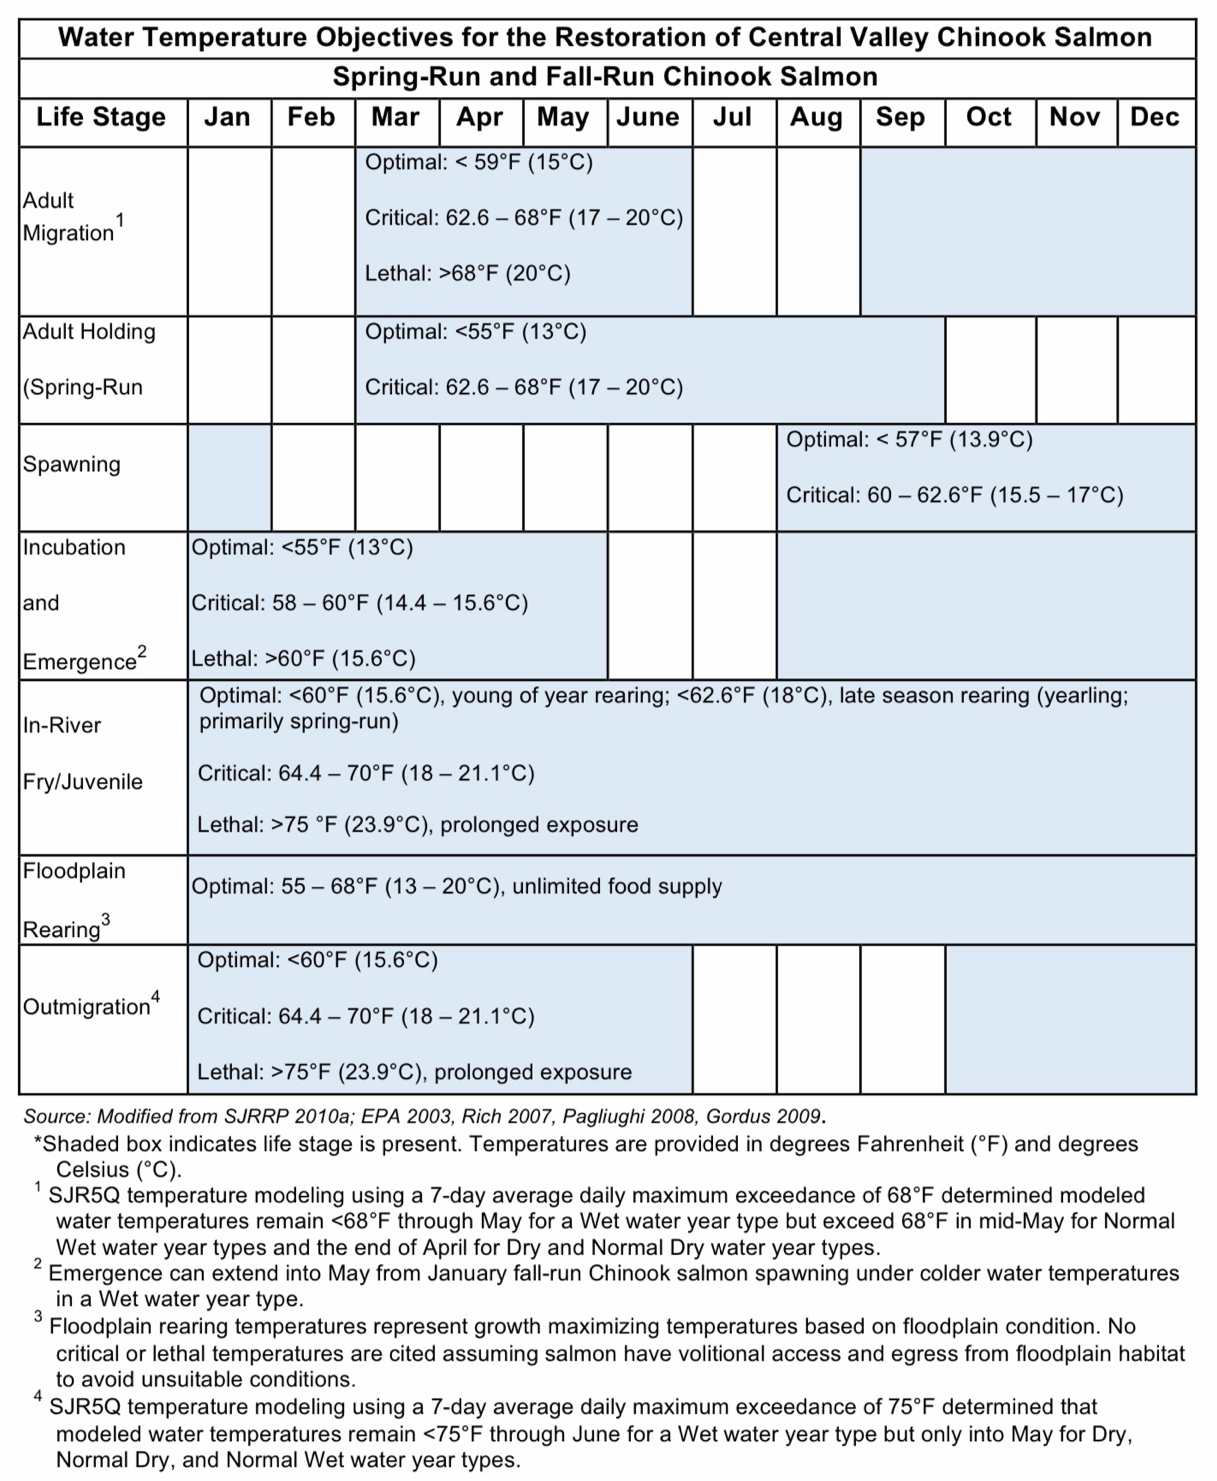
1. The first question addresses the conditions that faced broodyear 2014 eggs when they entered the Golden Gate inside their broodyear 2011 mothers that fateful summer of 2014. Water-year 2014 was a critical drought year, during which the State Board weakened Delta water quality standards for the year.
-
- Unusually warm water met the salmon when they entered the Bay in summer of drought year 2014 (Figure 4). By the time they reached the mouth of the Feather River at Verona (if they got that far), water temperatures were near the lethal 75º F level through September (Figure 5). Elevated water temperatures occurred through the entire route from the Golden Gate to the Yuba River.
- Once on the spawning grounds of the, Yuba the parents of broodyear 2014 eggs encountered drought-year low flows (Figure 6), which in addition to being warm provided minimal available spawning habitat quantity and quality.
- By the time the parents were ready to spawn in early fall, they were likely compromised by disease and thiamine deficiency, limiting the viability and survival of the broodyear 2014 eggs, and thereby the potential reproductive success of broodyear 2014 and its contribution toward 2017 recruitment.
2. The second question addresses the subsequent fate of surviving broodyear 2014 eggs and the hatched alevins in gravel redds. The eggs and alevins in the spawning beds faced unusual stresses in the form of erratic flow and very low flows (Figure 7). Eggs spawned in October-November were subjected to scouring flows in December. Eggs spawned in December under the high flows were subsequently subject to dewatering in January.
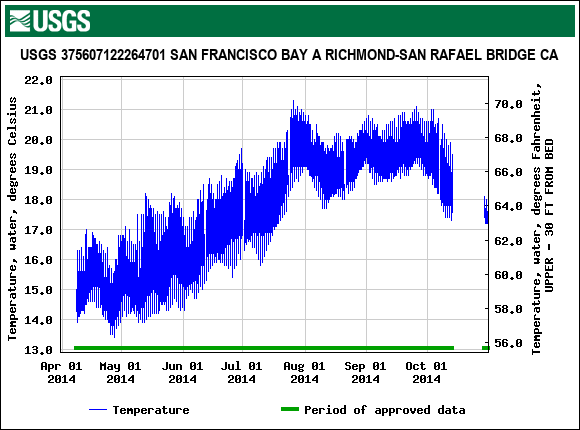
Figure 4. Water temperature in San Francisco Bay spring-summer 2014.
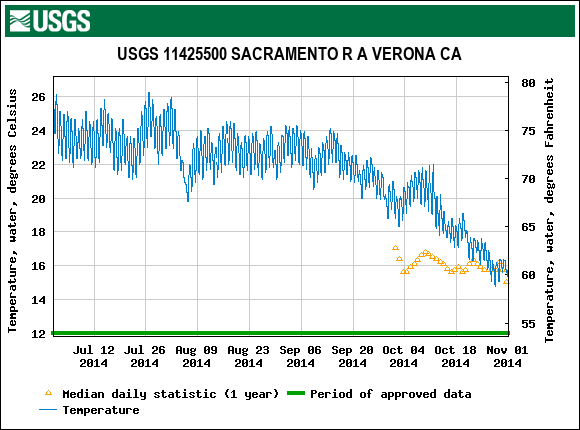
Figure 5. Water temperature in Sacramento River below mouth of the Feather River at Verona gage July-October 2014.
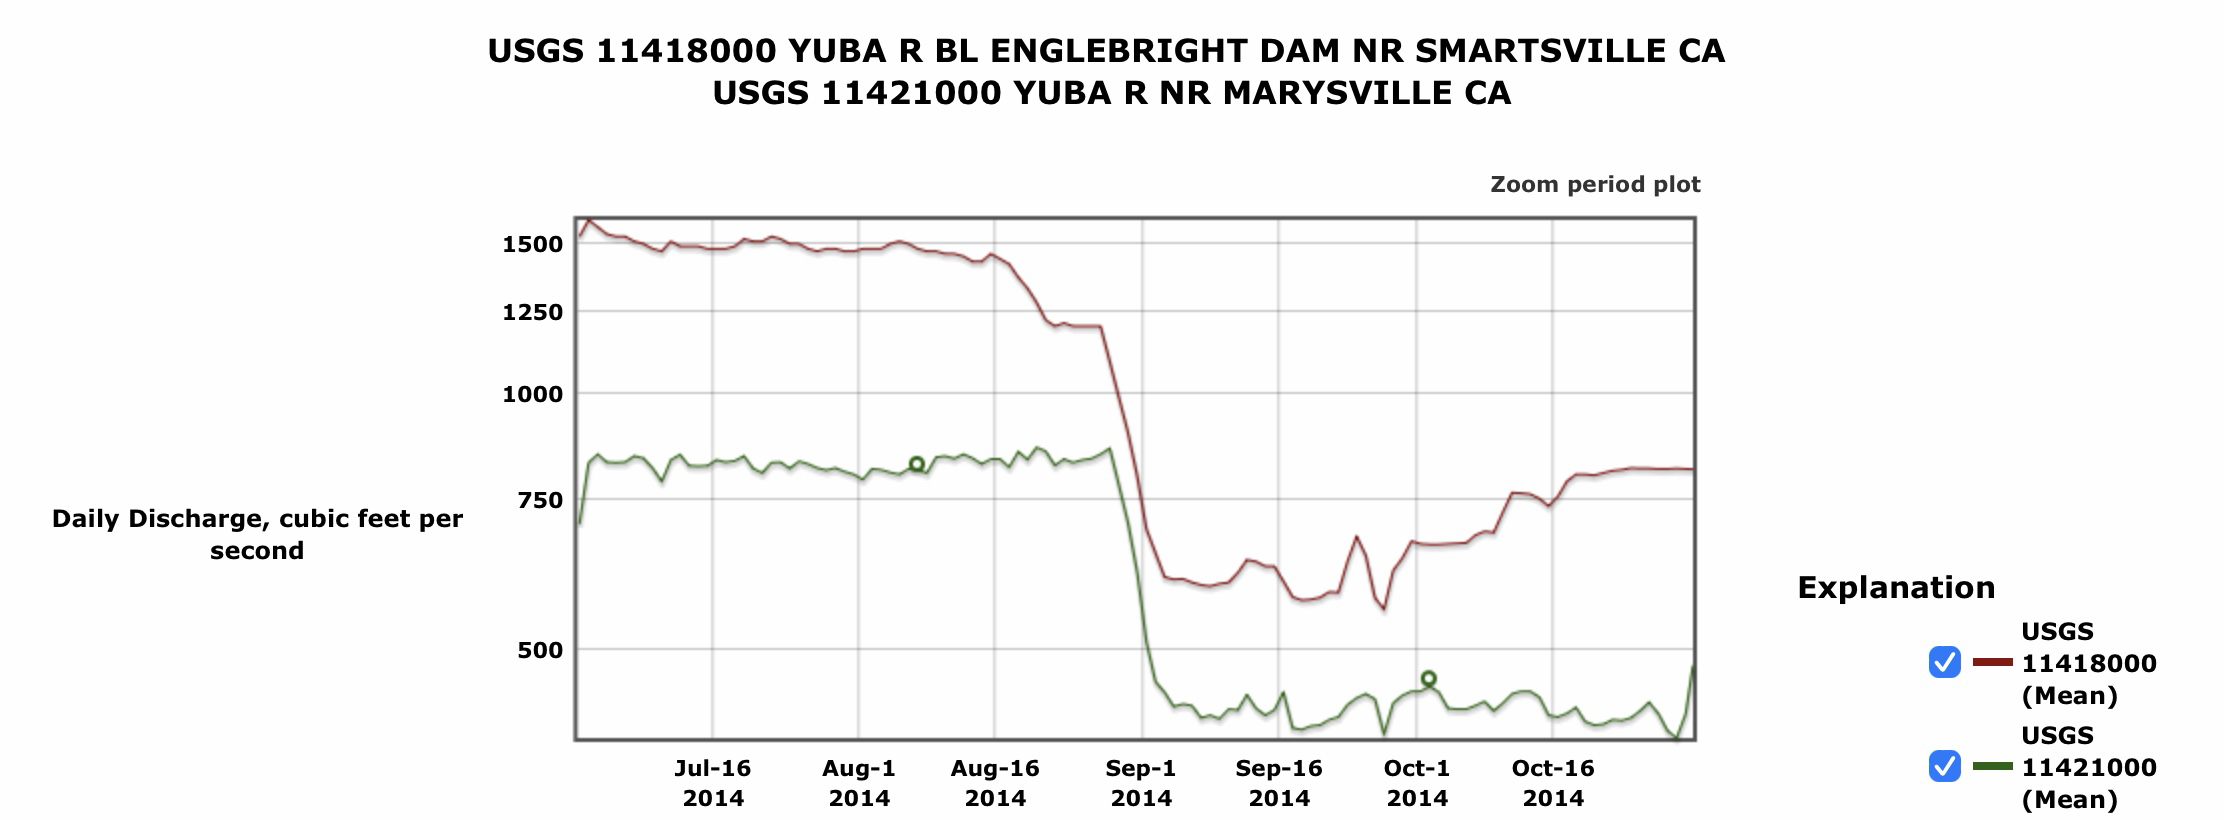
Figure 6. Streamflow in Yuba River at Smartsville and Marysville gages July-October 2014.
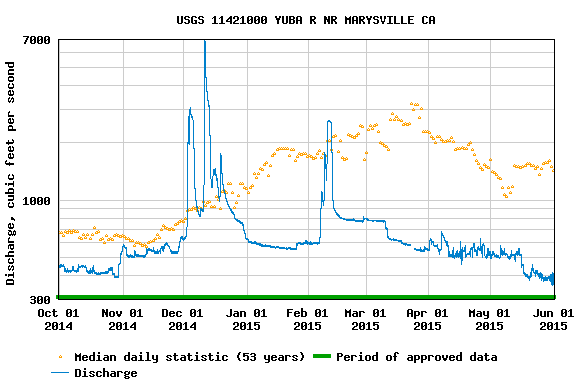
Figure 7. Yuba River streamflow in water year 2015 and 53-year average at Marysville gage.
3. The third question addresses conditions in the late fall through spring in critical drought water year 2015. Emergent fry likely benefitted from the February flow pulse that facilitated some fry movement out of the Yuba toward the Delta (see Figure 7). Those fry that did not move were then subjected to extremely low flows (and stressful water temperatures) through the spring in the lower Yuba River and the lower Sacramento River below the mouth of the Feather River (Figure 8). Delta and then Bay conditions were at their worst for young Yuba salmon on their way to the ocean in the spring of drought year 2015, made worse by the State Board’s continued weakening of water quality standards.
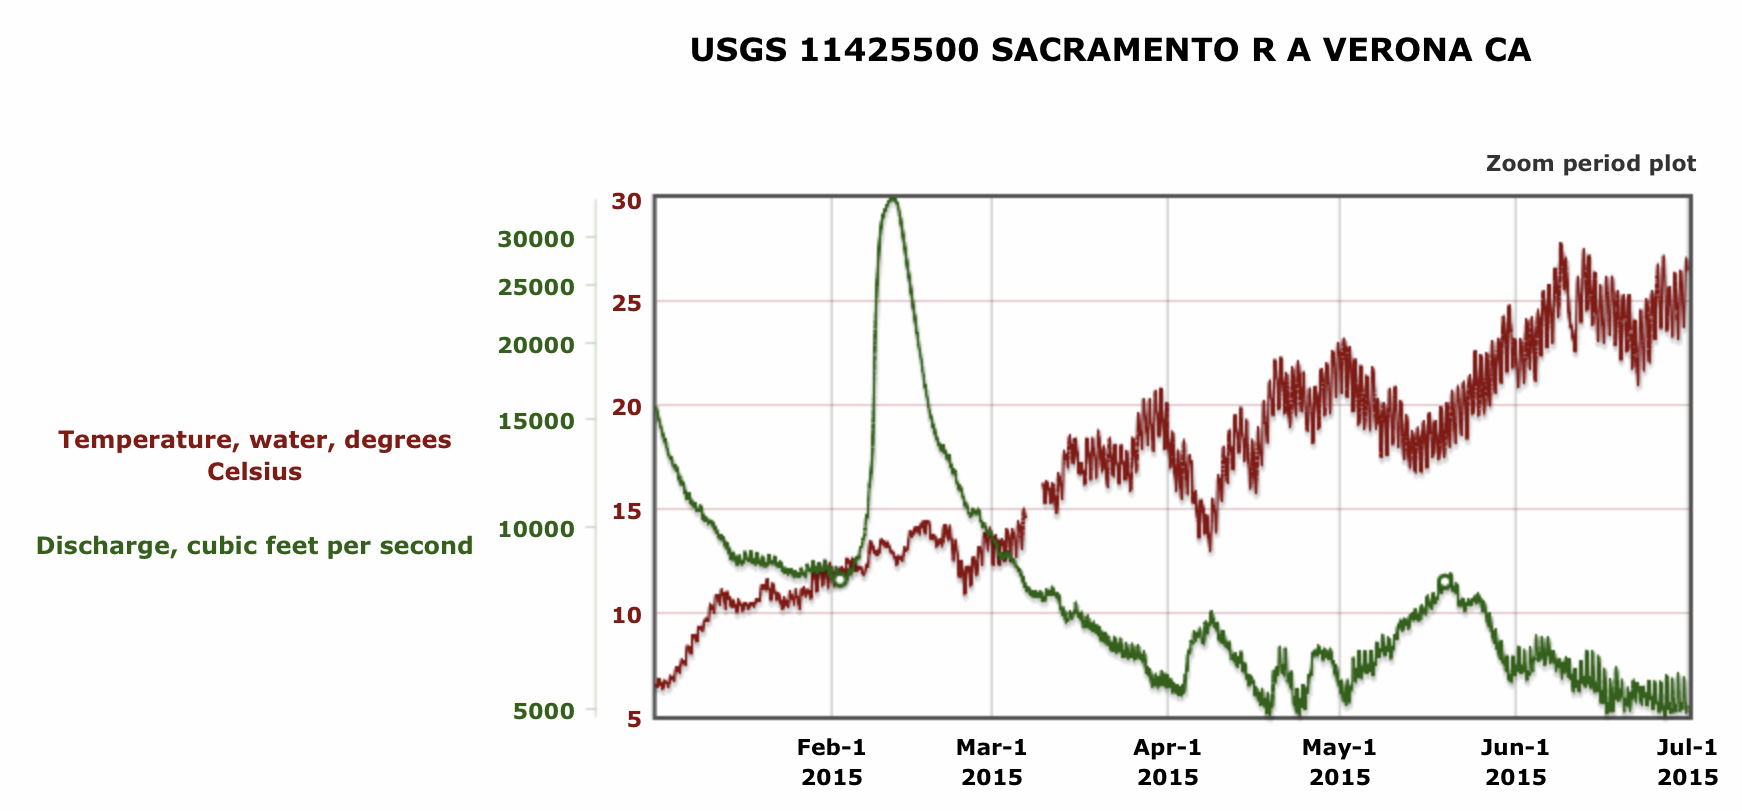
Figure 8. Streamflow and water temperature in the lower Sacramento River below the mouth of the Feather River at Verona gage in winter-spring 2015.
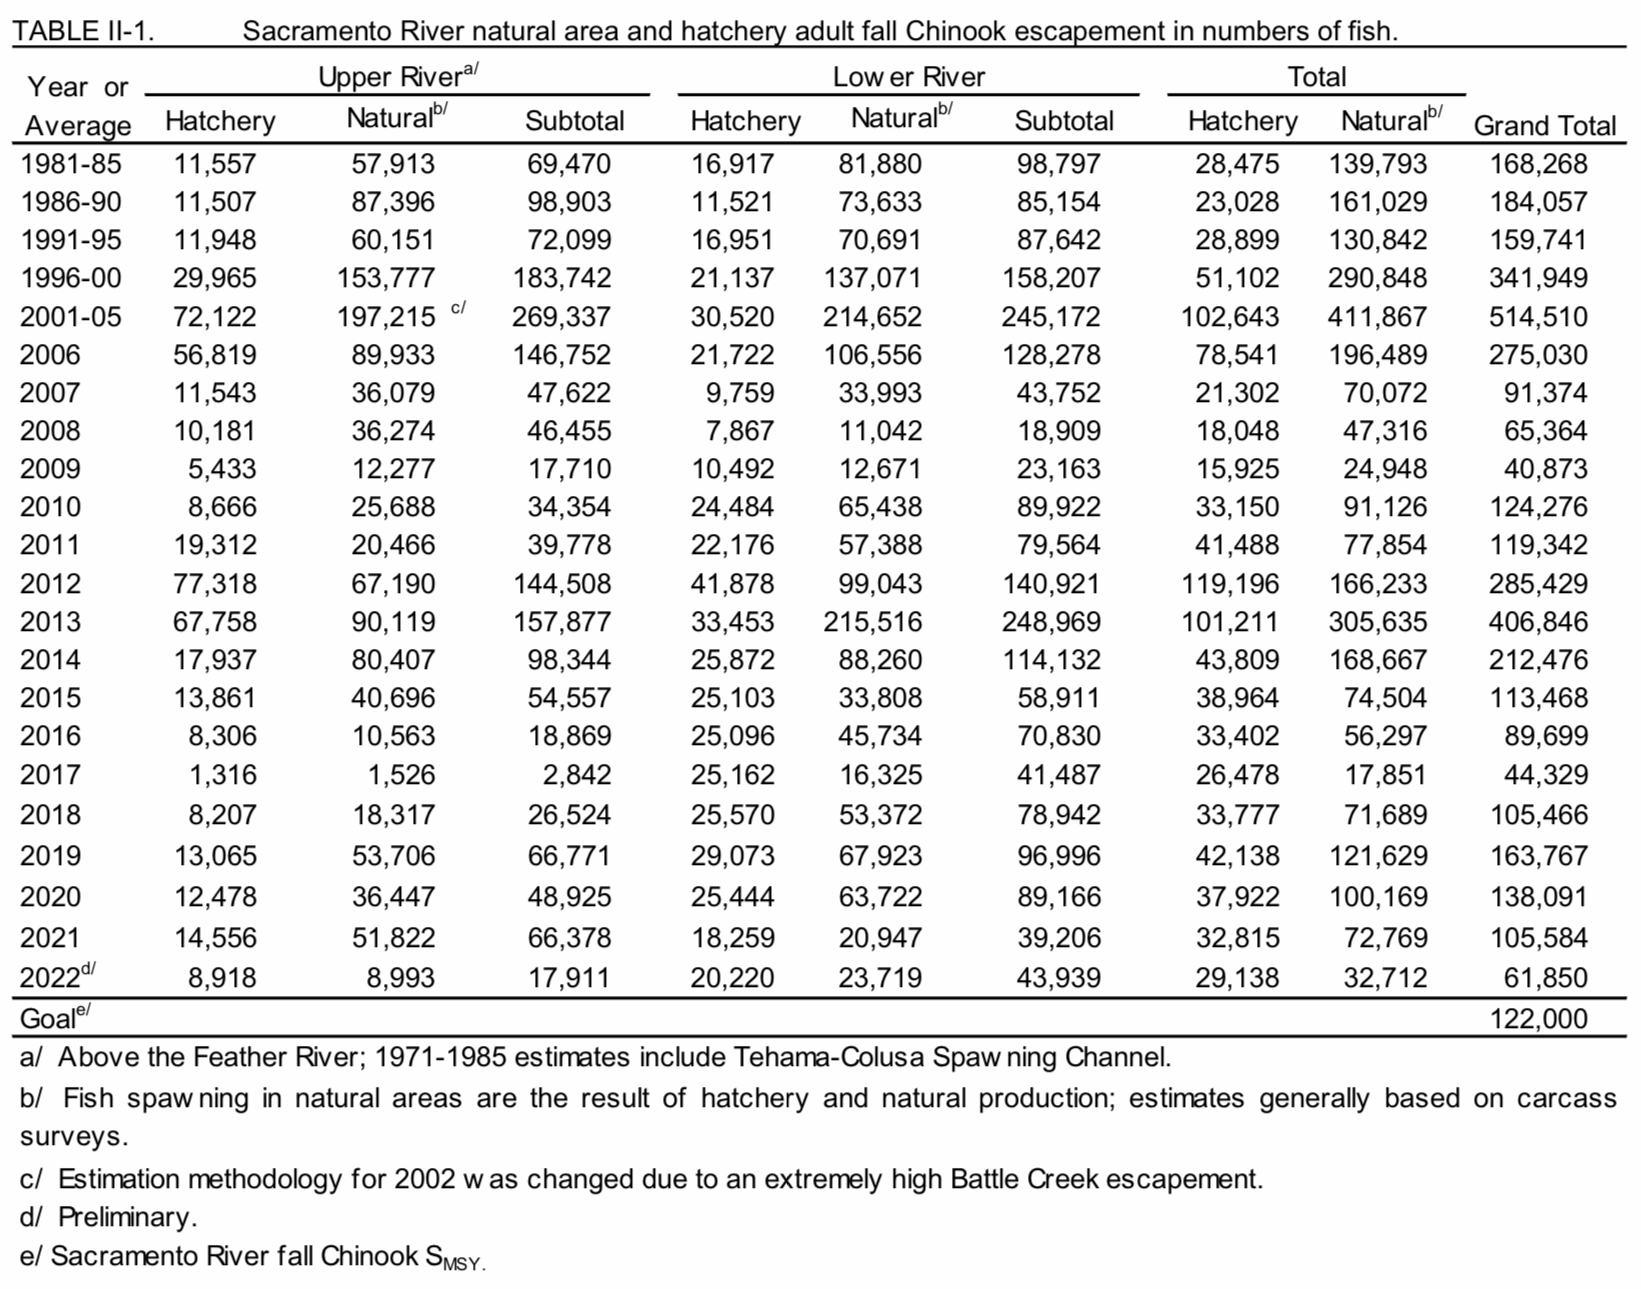
4. The fourth question regarding broodyear 2014 addresses growth in the ocean from 2015 through early summer 2017. In the ocean, they were subjected to strong fishery pressure (Figure 9) in all three years by the commercial and sport fisheries. This provokes a series of questions. Why did the Pacific Fisheries Management Council or PFMC allow those 50%+ harvests after the 2008-2009 collapse and fishery closures, and lack of subsequent population recovery? Had the fall-run salmon populations really recovered sufficiently to sustain 50%+ harvests? How accurate were those harvest rate estimates? How hard were the stocks being preyed upon by seals and orcas? Were the salmon whose diet had largely consisted only of anchovies becoming thiamine deficient by the time they spawned in the Yuba in early fall 2017. In considering all these questions, one can only conclude that the summer upstream migration of fall-run salmon to the Yuba in 2017 had been highly compromised before it started.
5. The fifth and final question regarding broodyear 2014 salmon addresses conditions adult fish faced when they re-entered fresh to spawn after having been subjected to high harvest rates in the ocean from 2015-2017 (implied in Figure 9). Upon returning to the Bay in summer 2017, a wet year, they encountered much better conditions during their upstream migration and spawning period. After a final tweak by the summer river fishery, they spawned in the Yuba River in record low numbers.
Nearly identical circumstances and outcomes occurred with broodyear 2015 in 2018 (see Figure 3). Broodyears 2016-2019 were subject to similar stresses. Broodyears 2020 and 2021 were subject in-river to critical drought years 2021 and 2022.
In conclusion, it appears that the damage to broodyear 2014 and broodyear 2015 had been done for the most part by the time they returned as adults to the Bay in 2017 and 2018. The record-low numbers of spawners estimated from the carcass surveys in 2017 and 2018 (Figure 1 and 2) were the cumulative effect of a series of survival factors, beginning with stresses on their parents in drought years 2014 and 2015, and ending with high harvest rates in the ocean and rivers in 2017 and 2018. Management decisions by the State Board and PFMC, with acquiescence by federal and state resources agencies, contributed to this fateful series of events. The events and their consequences were predictable, and the State Board and PFMC should have anticipated them and taken appropriate measures at the time.
It appears the same mistakes were made in regard to broodyears 2016-2021. The effects of drought in years 2021 and 2022 will likely contribute further to the crash of the Yuba River salmon population, with even lower Yuba River and Central Valley salmon escapement in 2023-2025.
For more on the problems faced by Yuba River fall-run salmon and what can be done about them, see this October 2018 post.
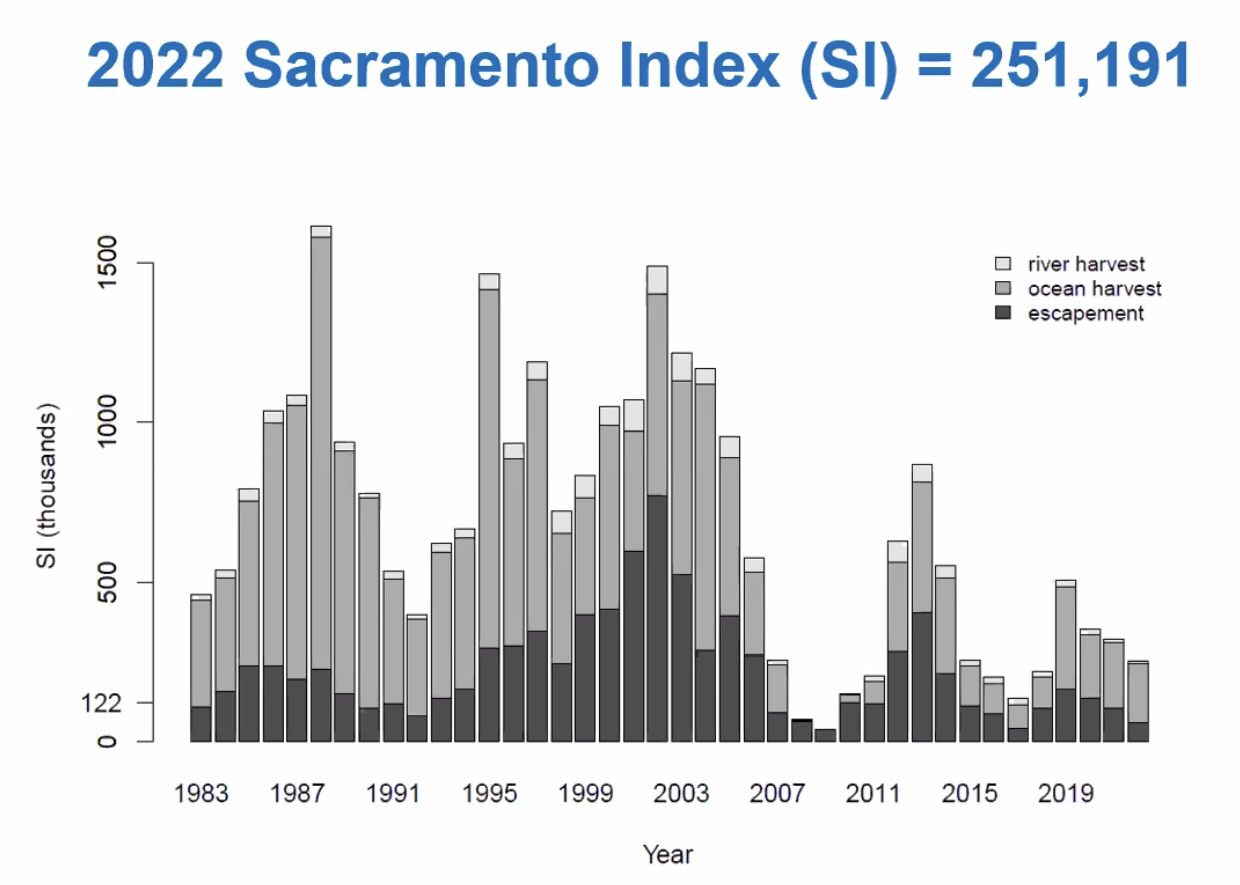
Figure 9. Sacramento River fall-run salmon index 1983-2019. The 122 on y-axis is the target starting population level (122,000) under which harvest is allowed. Note the fisheries were closed in 2008 and 2009. Source: PFMC.