In an October 2018 post, I discussed the record low Sacramento River 2017 adult fall-run Chinook salmon run and juvenile fall-run production index from winter-spring 2018. Both record lows were indications that something had gone wrong for brood year 2014. I also forecasted a poor adult run in fall 2018. The latest information on salmon runs for 2018, recently published by the California Department of Fish and Wildlife, indicates the 2018 fall run was indeed also poor (Figure 1). The run size in 2018 was 8980 (5th lowest in the record), as compared to 1822 in 2017, and 29,966 in 2014.
Despite a normal water year in winter-spring 2016 in the Sacramento River, the hangover from the critical 2013-2015 water-years drought (low reservoir levels) provided harsh conditions for brood year 2015 fall run that led to the poor adult run in 2018:
- Poor river conditions due to low streamflows during the spawning run in summer and late fall 2015 (Figure 2 and 3).
- Poor egg-embryo incubation in gravel redds due to low streamflow in late fall 2015 and early winter 2016 (Figure 2).
- Poor fry survival from low winter streamflows (February and early March) and poor smolt survival from low late spring streamflows (late April and May) in 2016 (Figure 3).
In addition, most of the 10 million Coleman Hatchery smolts raised for brood year 2015 were released at the hatchery in lower Battle Creek from April 7 to April 29, 2016, under sharply declining streamflows (Figure 3) and rising water temperatures in the lower Sacramento River (Figure 4). Their contribution to the 2018 spawning cohort was similarly low. Of the 10 million smolts released, only 14,000 adults returned to the upper river, as compared with 84,000 in 2012.
Based on the spawner recruit model, the 2018 fall run of 8980 adult salmon could have been three times as high or higher (similar at least to 2012 or 2014) if not for poor river flows and associated high spring water temperatures that exceeded water quality standards.
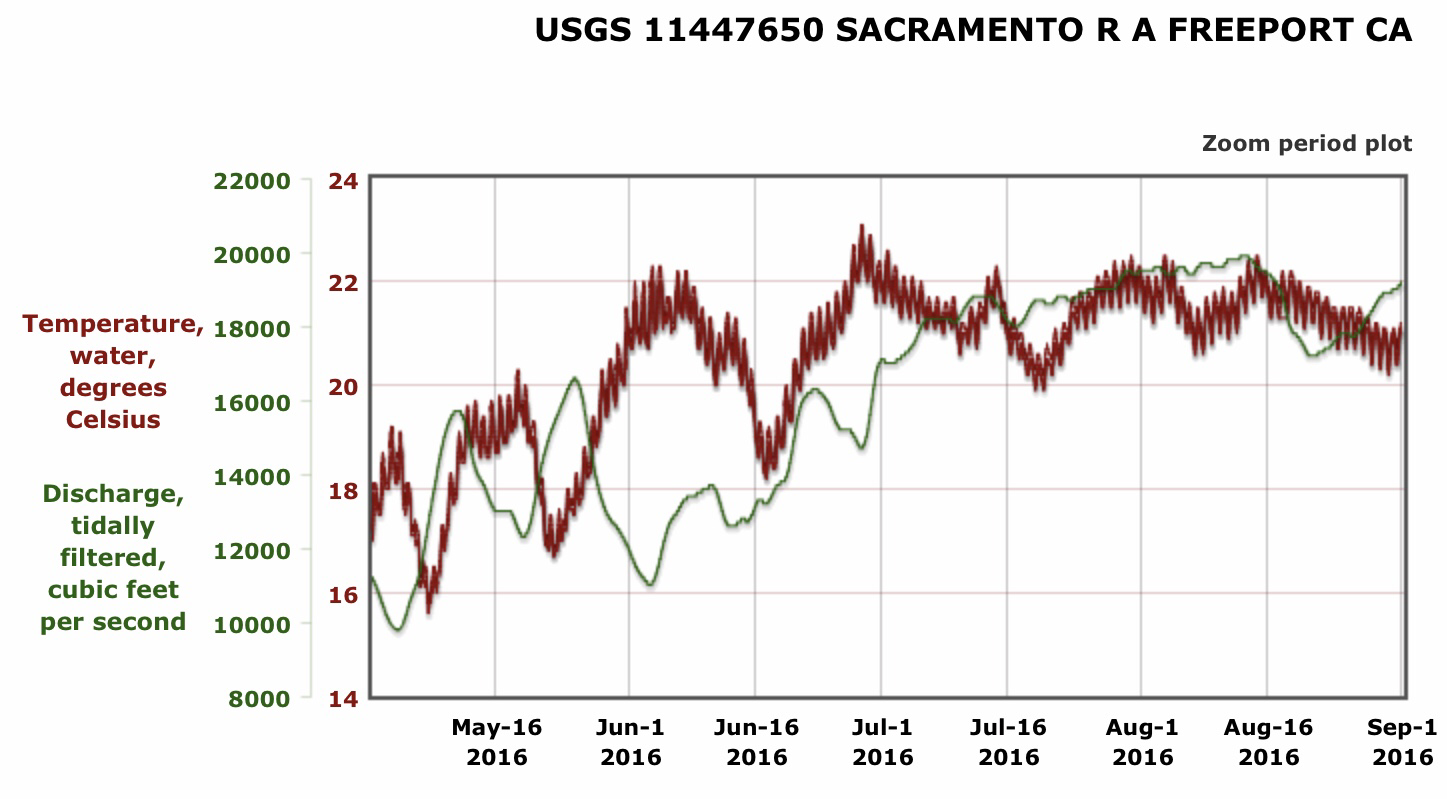
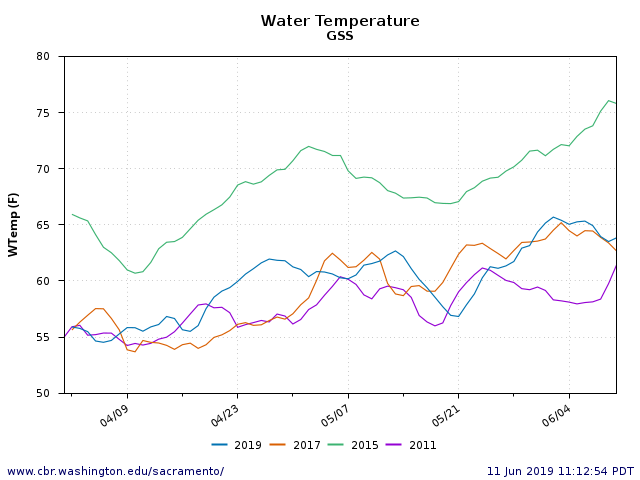
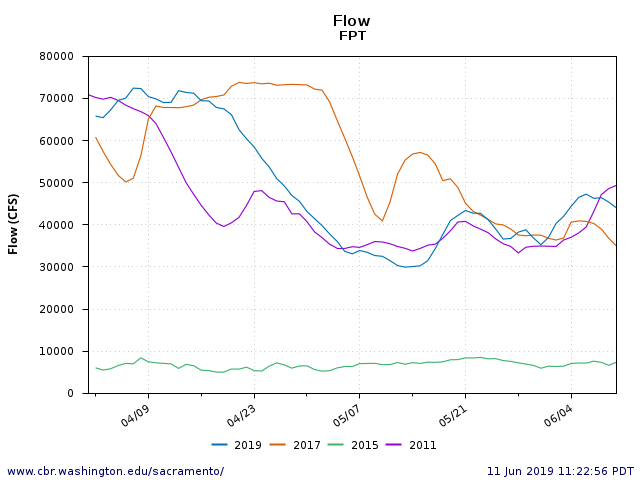
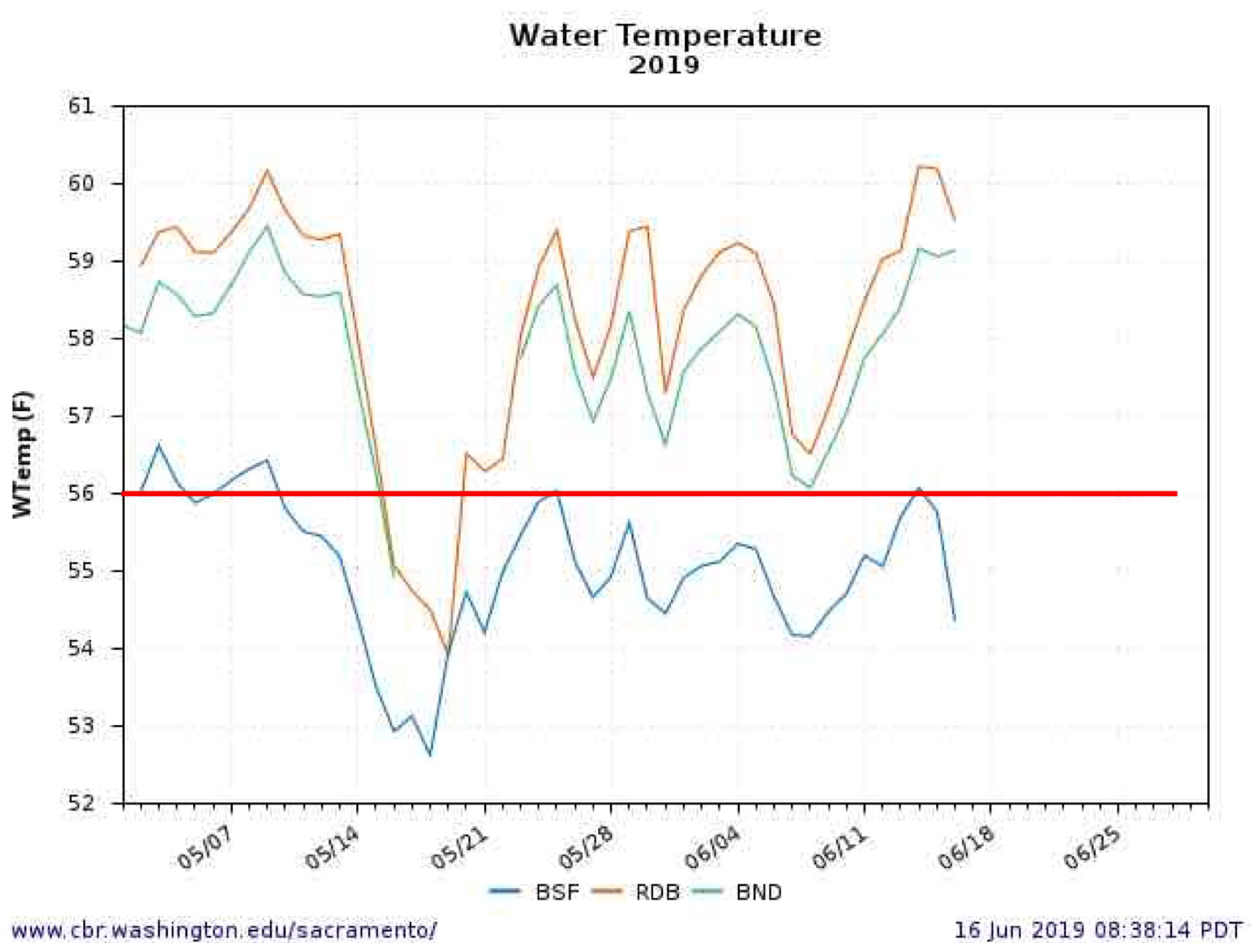
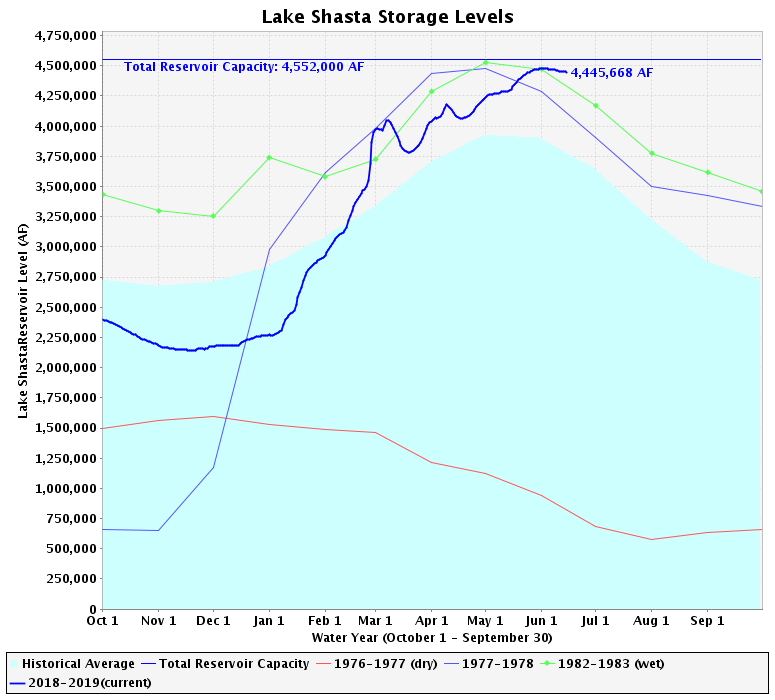
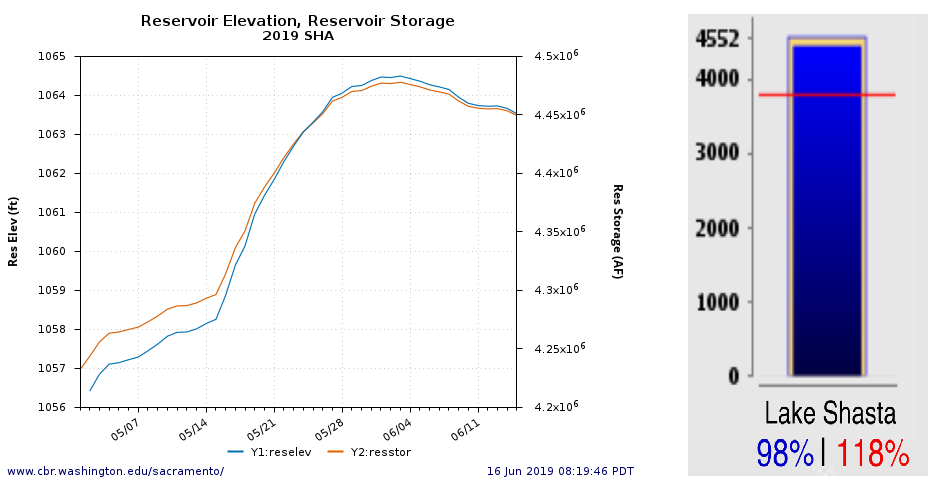
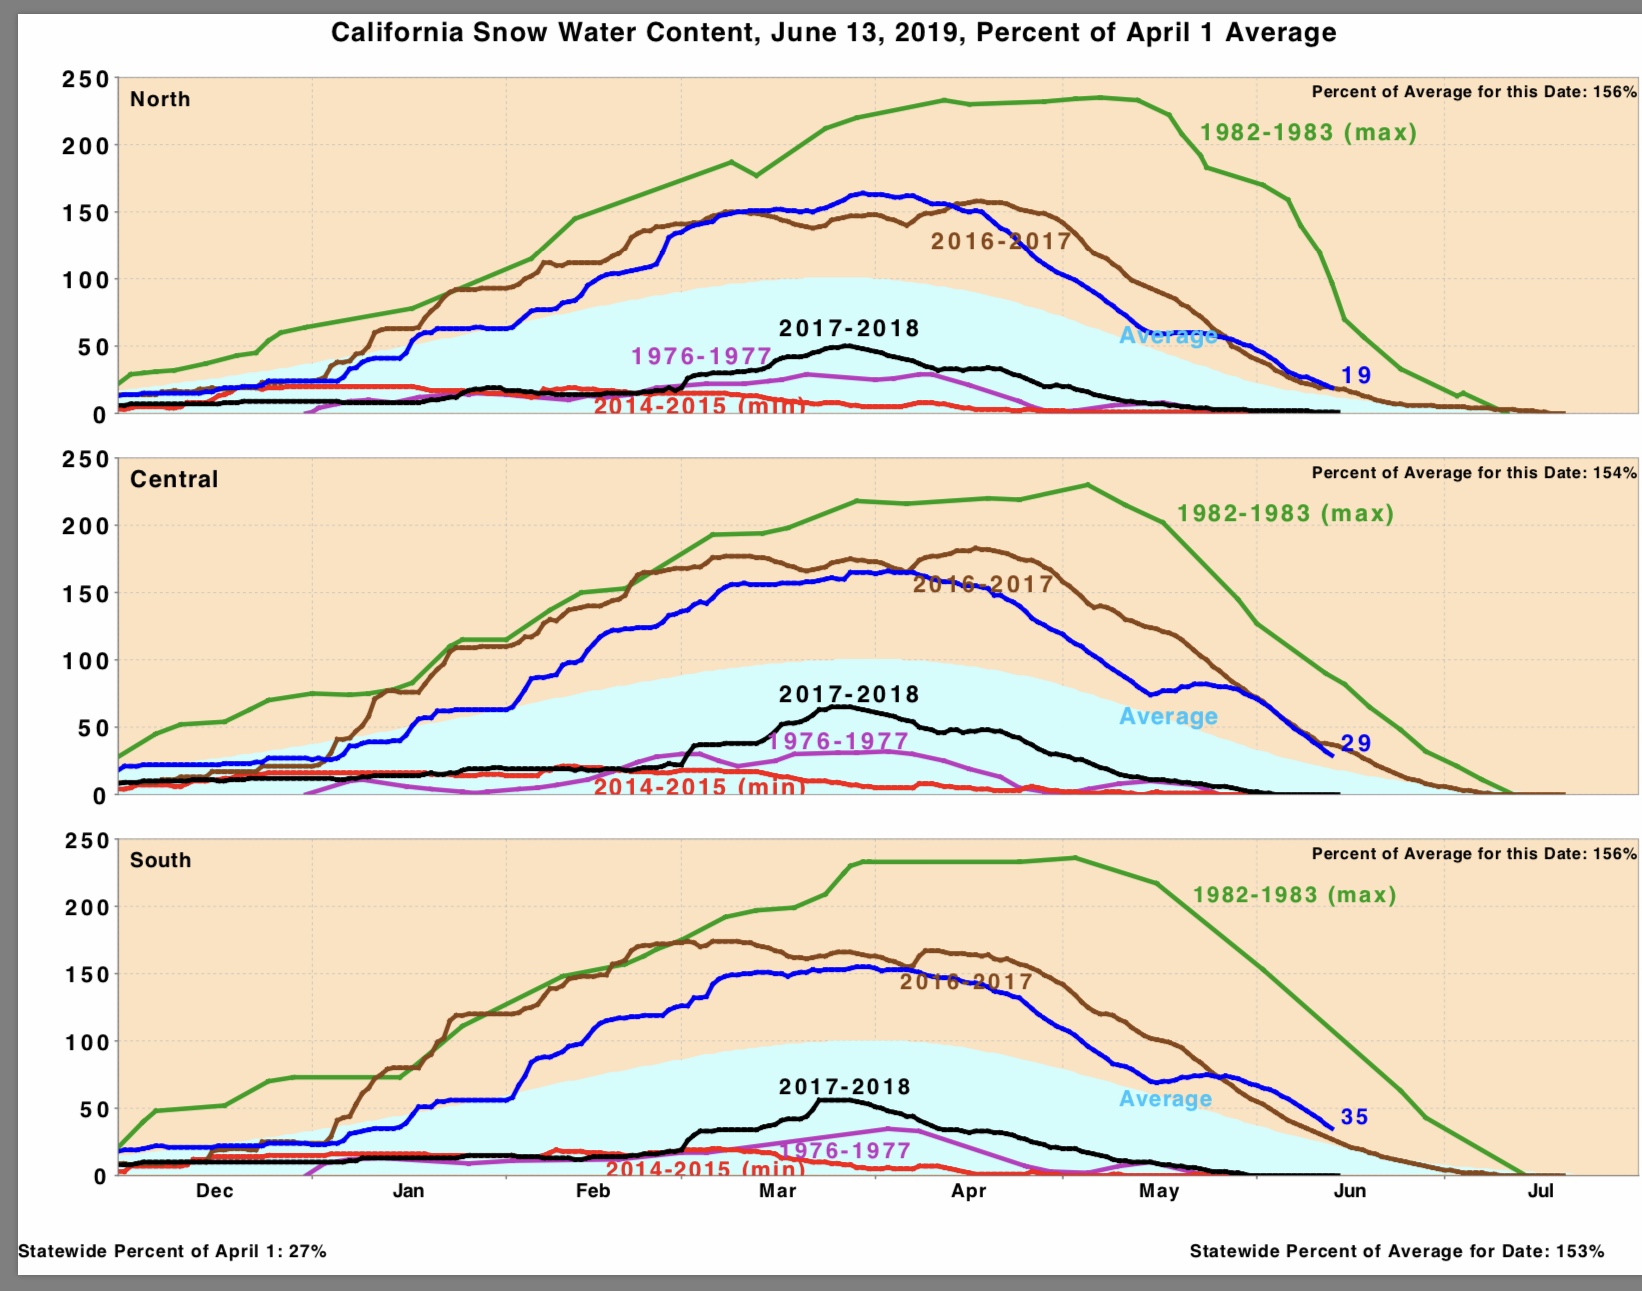
The prognosis for the upcoming 2019 run is mixed, but the run should show improvement. Early indications are good, despite very low numbers of spawners in fall 2016 (red 16 in Figure 1). Water year 2017 was wet (19 will be blue in Figure 1). Coleman Hatchery’s released 10-million smolt to the upper river in April 2017 under optimal conditions. There were stressful warm water (>20oC) and low flow conditions in July-August 2016 early in the 2016 spawning run (Figure 5), as well as low and sharply dropping flows in the fall spawning season that likely caused some redd dewatering and low egg/embryo survival. Maintaining less than stressful water temperature during the early run in summer will be important; conditions are already marginal during late spring when winter-run and spring-run adults are migrating (Figure 6). Flows in the 10,000-14,000 cfs range may be necessary to maintain water temperatures at or below 20oC through the summer. With Shasta Reservoir full and an abundant snowpack, that should be readily achievable.
Hopefully, the 2019 run can approach that of 2012 (green 12 in Figure 1) for that low level of spawners (09 and 16 were similar). The results for summer coastal and river fisheries will be the next indicator of success for the 2019 fall-run salmon.
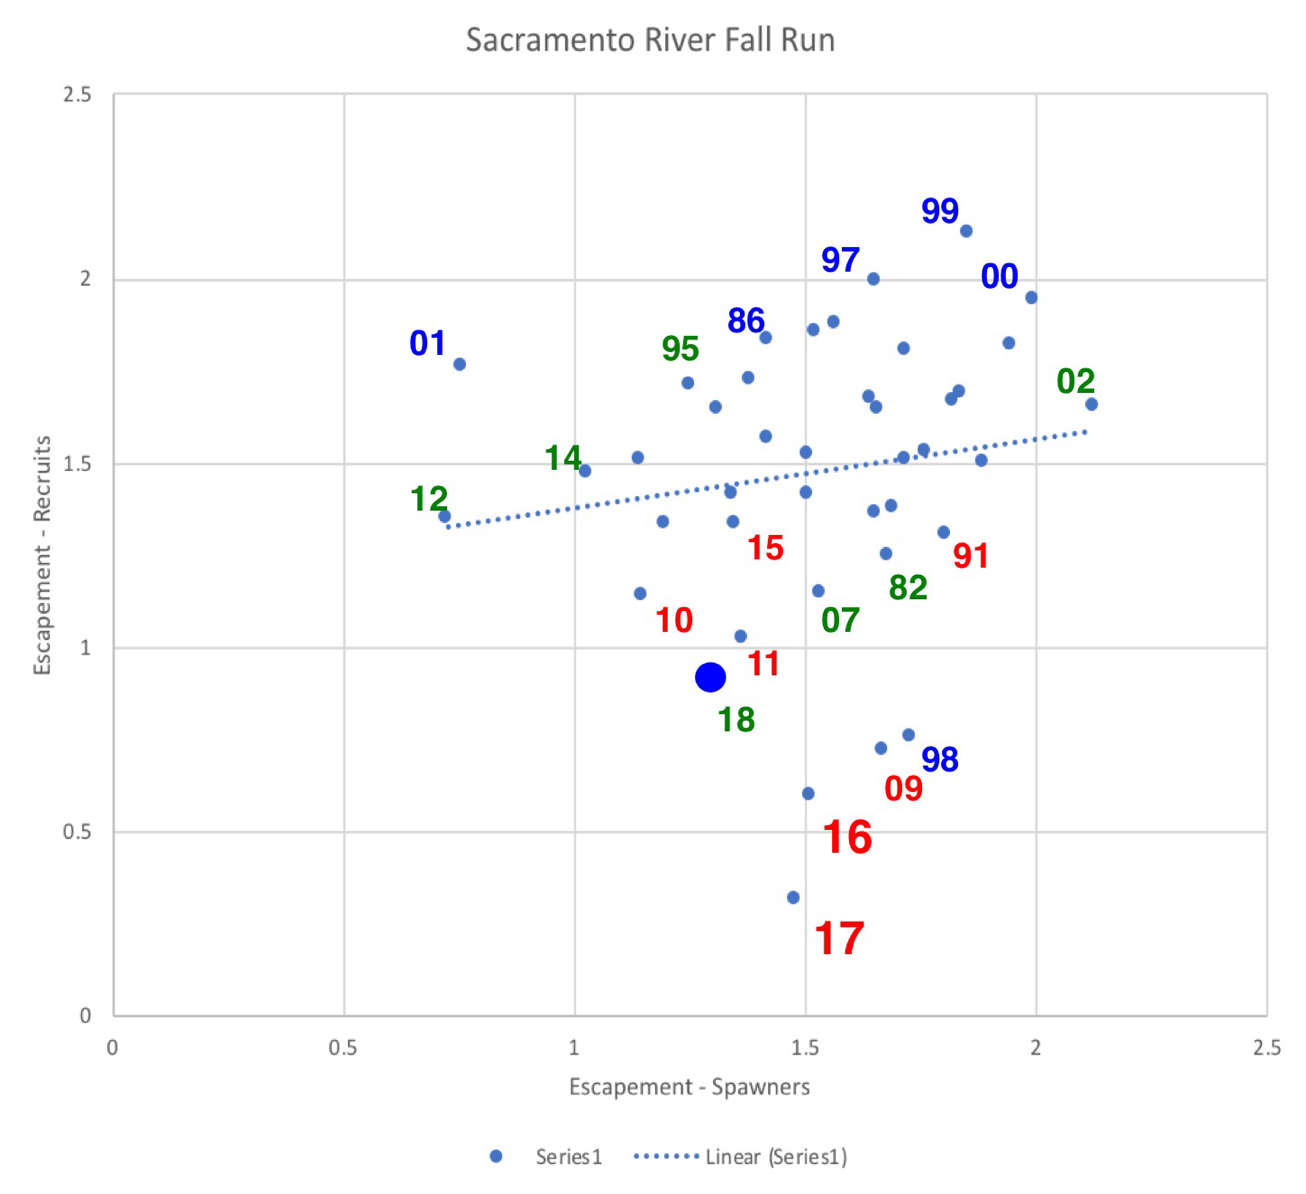
Figure 1. Spawner-recruit relationship for Sacramento River fall-run in-river estimates of run size (transformed log10-3). The 2018 escapement is shown as large blue dot and associated green “18”. Number indicates spawner estimate for that year (y-axis) as derived from spawners three years earlier (x-axis). Color indicates winter-spring rearing and migration conditions for that brood (winter-spring 2016 for spawners in 2018). Red denotes dry year in first winter-spring. Green denotes normal years. Blue denotes wet years. The 2018 spawner (escapement) number should have been higher, similar to other normal water years. Source: http://calsport.org/fisheriesblog/?p=2333 .
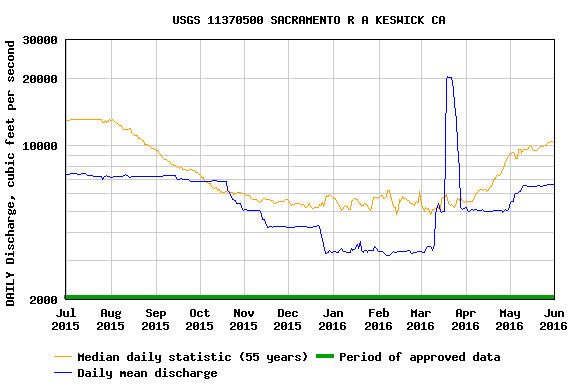
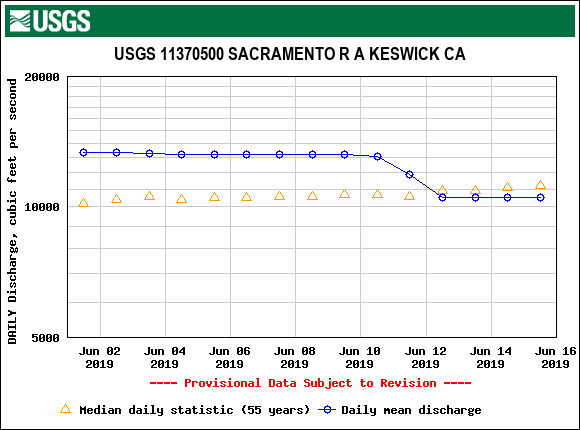
Figure 2. Streamflow in the upper Sacramento River below Shasta/Keswick dams near Redding July 1, 2015 to June 30, 2016. Source: USGS. Note the low late fall and winter streamflows in the primary spawning grounds below Keswick Dam. The decline from 7000 cfs in late October to below 4000 cfs in late December led to significant redd dewatering and poor fry survival. Fall-winter flows should not fall below 5000 cfs.
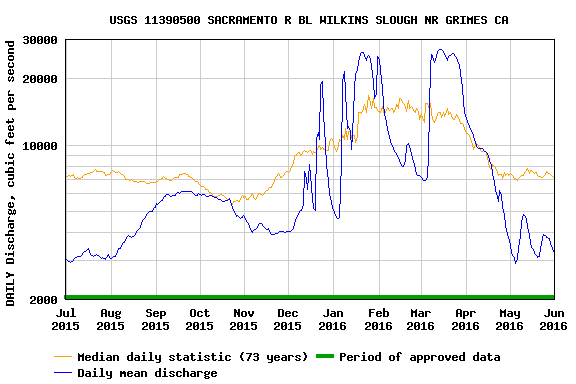
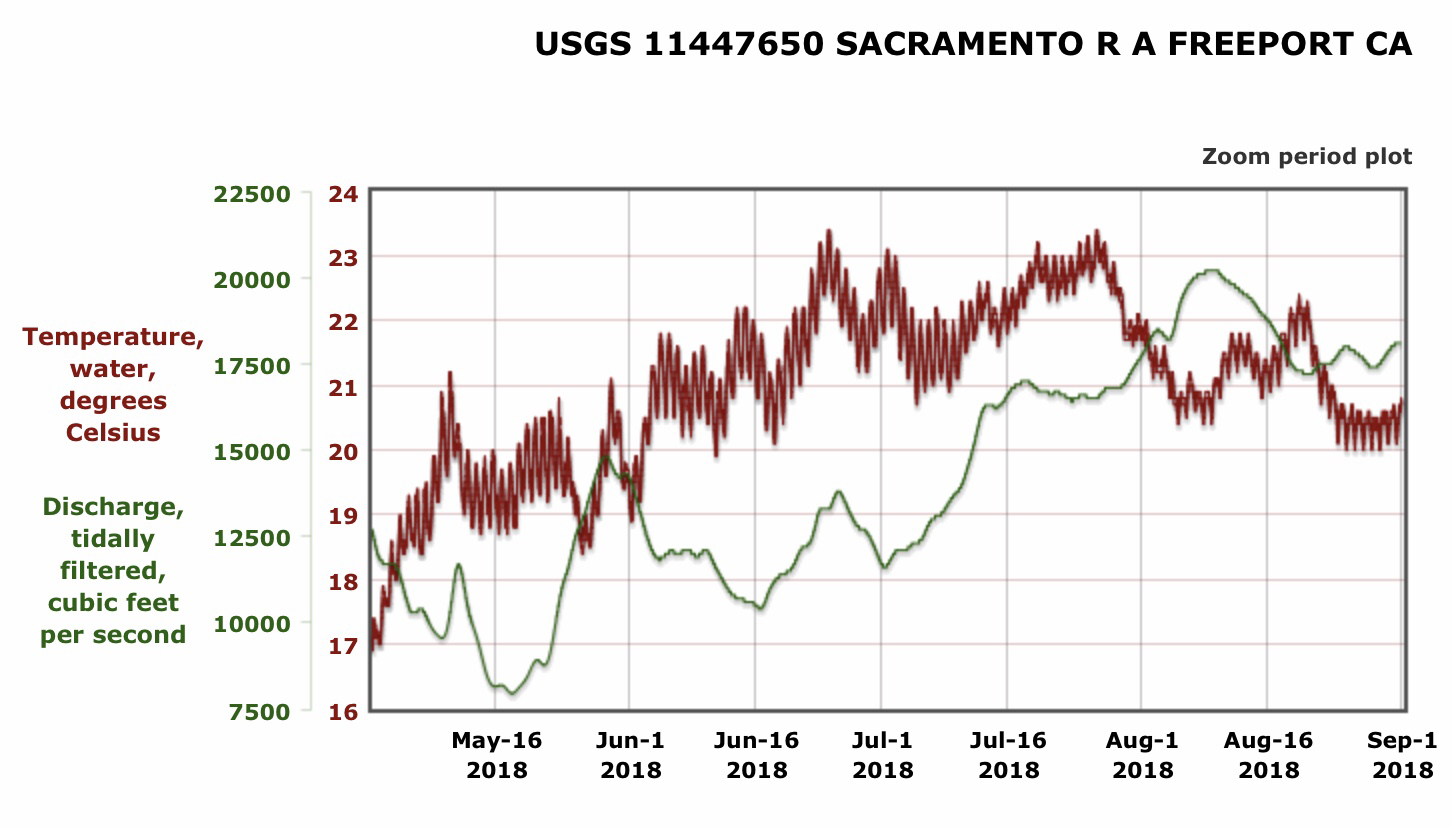
Figure 3. Streamflow in the lower Sacramento River near Grimes, July 1, 2015 to June 30, 2016. Source: USGS. Note the low summer and fall streamflows in 2015, and low late spring flows in 2016. Poor pre-spawn and spawning season (summer-fall) flows lead to poor adult survival to spawning and poor egg viability. Low spring flows lead to high water temperatures and lower turbidities that increase smolt vulnerability to predation. Flows in the lower river should be maintained above 5000 cfs.
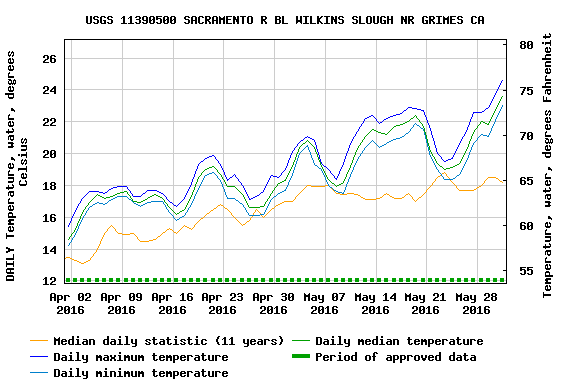
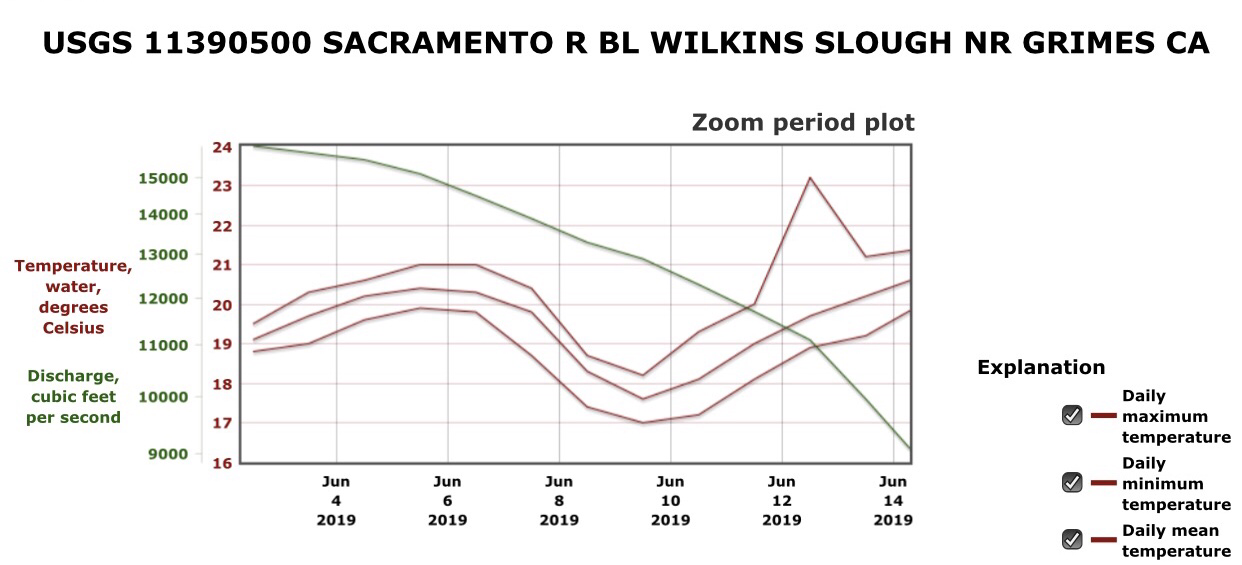
Figure 4. Water temperature in lower Sacramento River at Wilkins Slough in April-May, 2016. Note the Basin Plan water quality standard for lower Sacramento River water temperature requires temperatures no greater than 20oC, 68oF. High water temperatures lead to poor migrating smolt growth and greater vulnerability to predation. Spring water temperatures should not exceed 18oC, 65oF to minimize migrating smolt mortality.
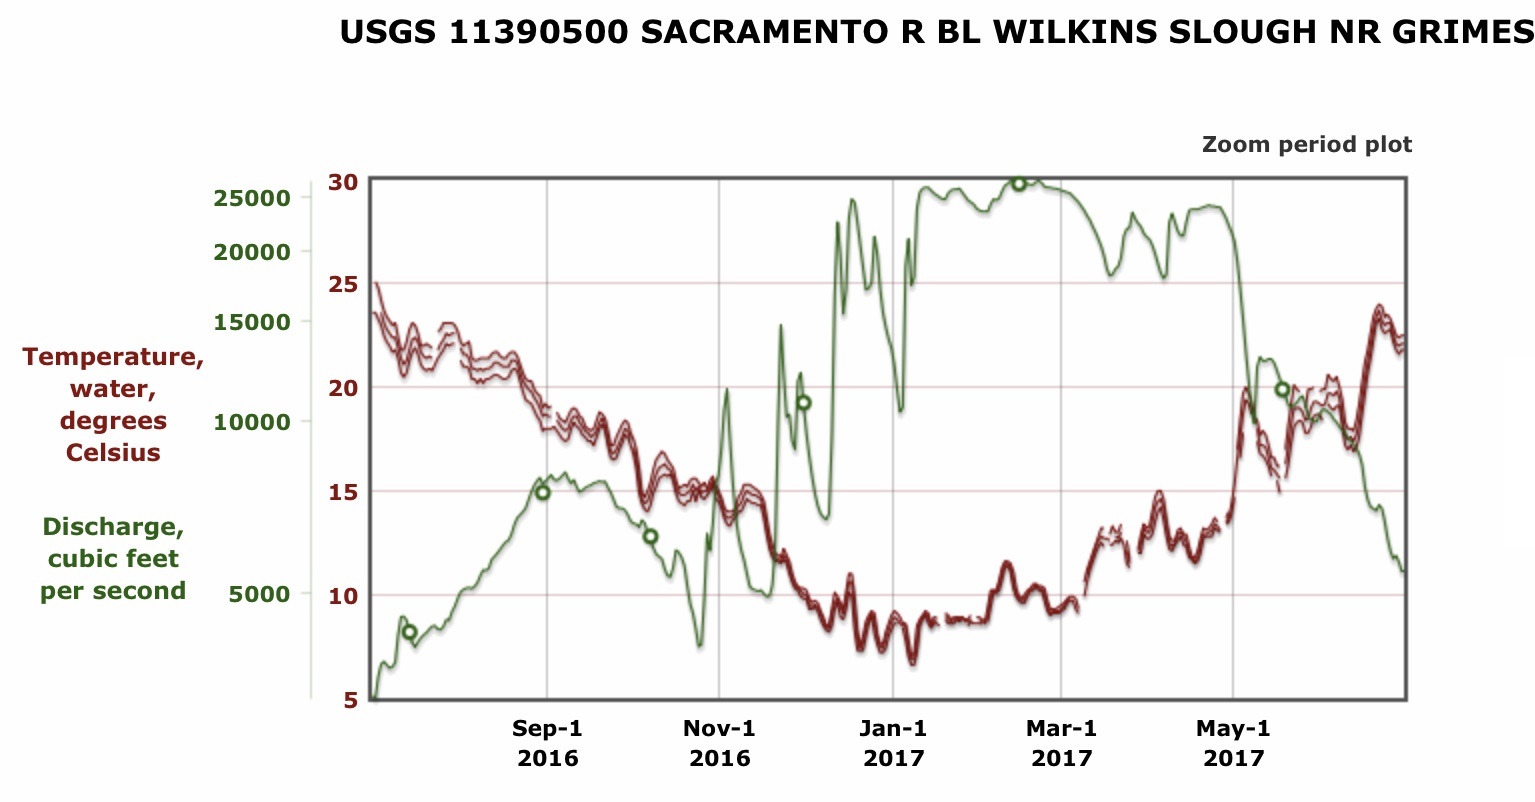
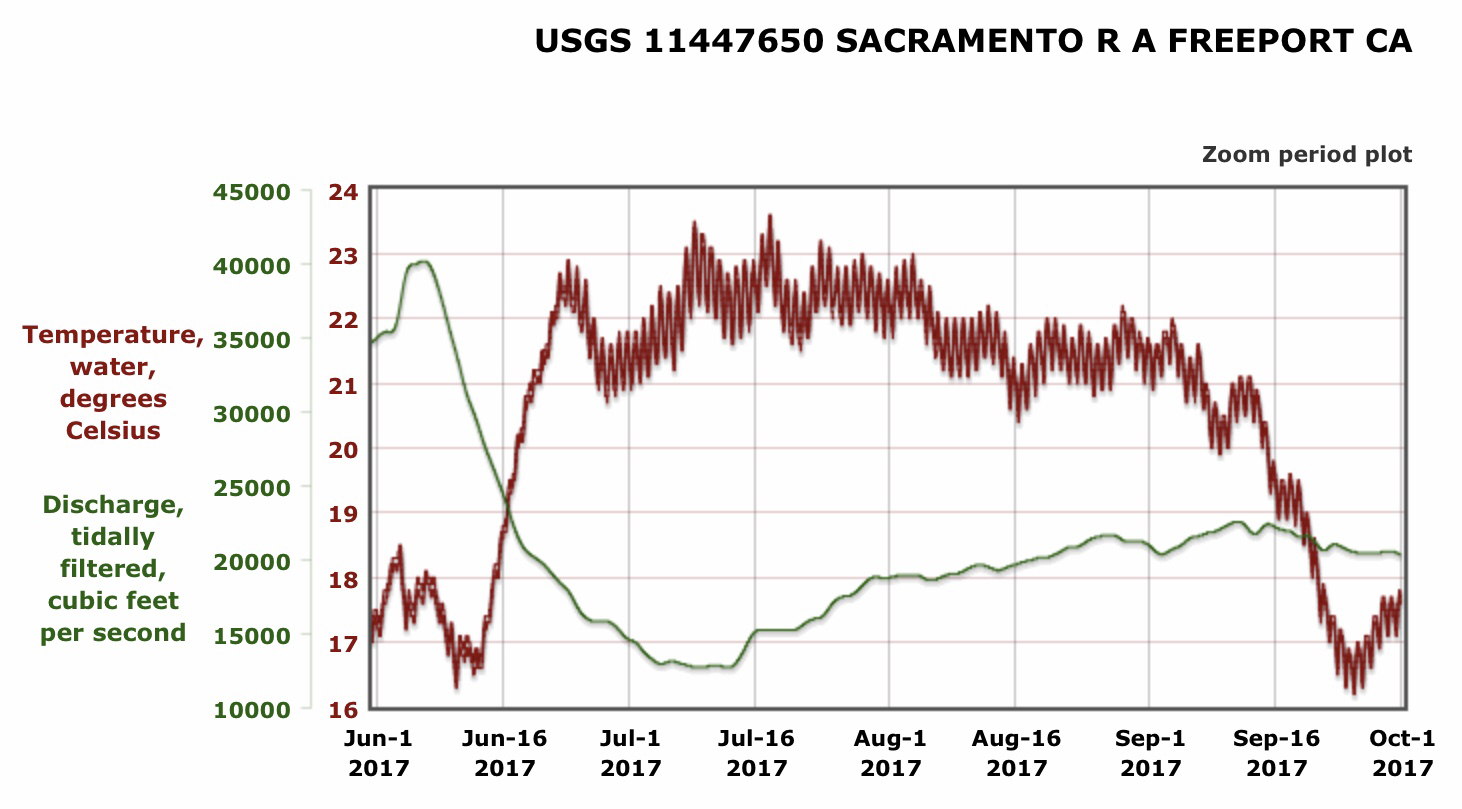
Figure 5. Water temperature and river flow in the lower Sacramento River near Grimes from July 2016 to June 2017. Note that water temperature exceeds 20oC , the stress level for adult salmon and water quality standard, when summer flows fall below about 8000 cfs.
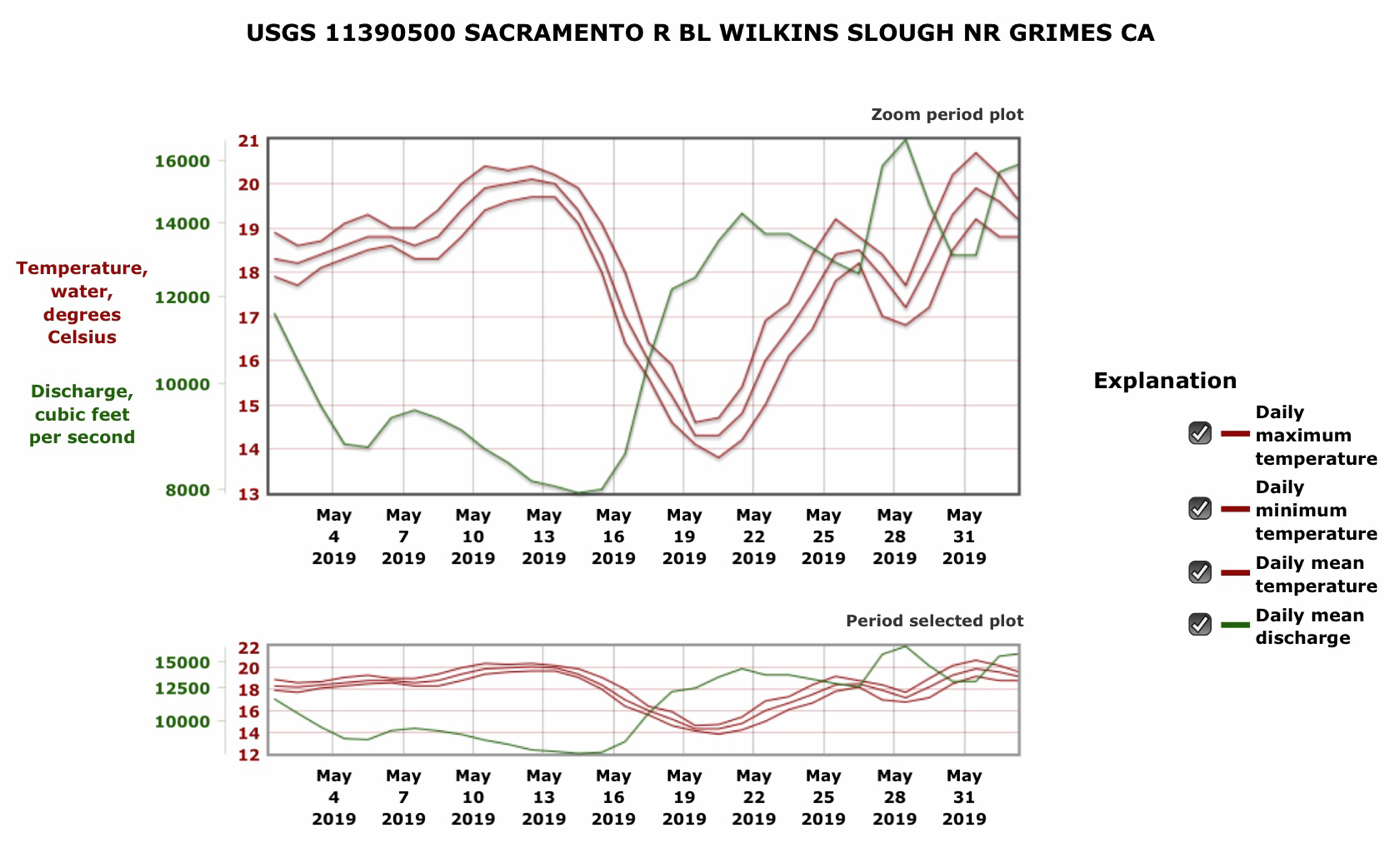
Figure 6. Water temperature and river flow in the lower Sacramento River near Grimes in May 2019. Note that in mid- and late May, water temperature reached near 20oC, the stress level for adult salmon and water quality standard, when flows initially fell to near 8000 cfs.