In an April 2017 post, I related factors likely important to late-fall-run Chinook salmon in the reach of the Sacramento River downstream of Shasta Reservoir. In this post, I update that assessment with 2015 and 2016 escapement estimates and coded-wire-tag return data from Coleman Hatchery smolt releases from brood years 2008-2013.
Late-fall-run Chinook salmon escapement reached new lows in 2015 and 2016 (Figure 1). The adult returns in these two years were the product of spawning in brood years 2012 and 2013 and of early rearing conditions in winter of 2013 and 2014 (critical drought years).
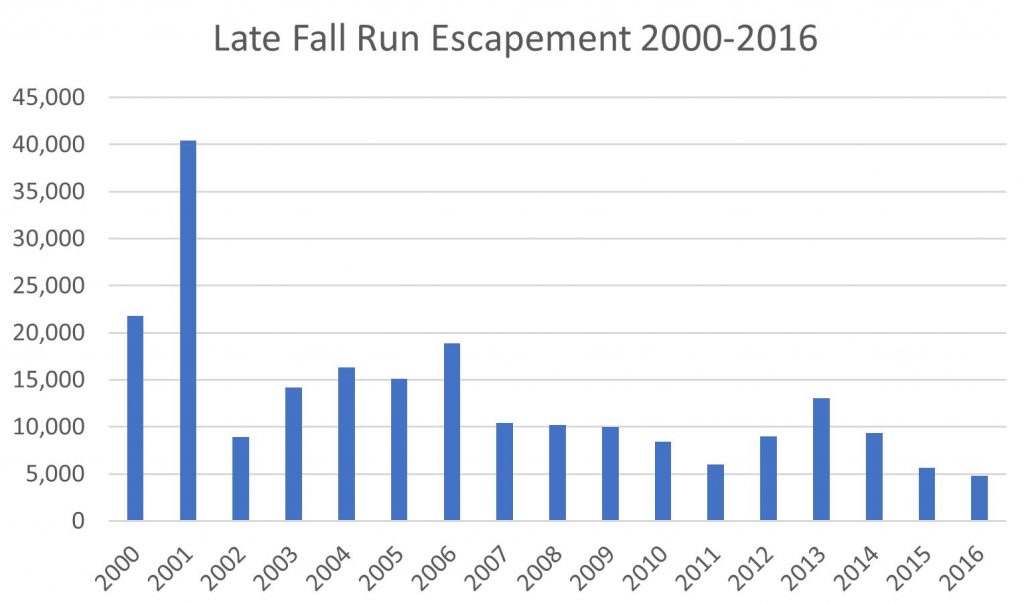
Figure 1. Late-fall-run escapement 2000-2016. Escapement refers to adult run counts beginning in late fall of spawning year. For example, 2016 represents late-fall-run for water year 2017 (Oct16-Sep17). Source: CDFW Grandtab.
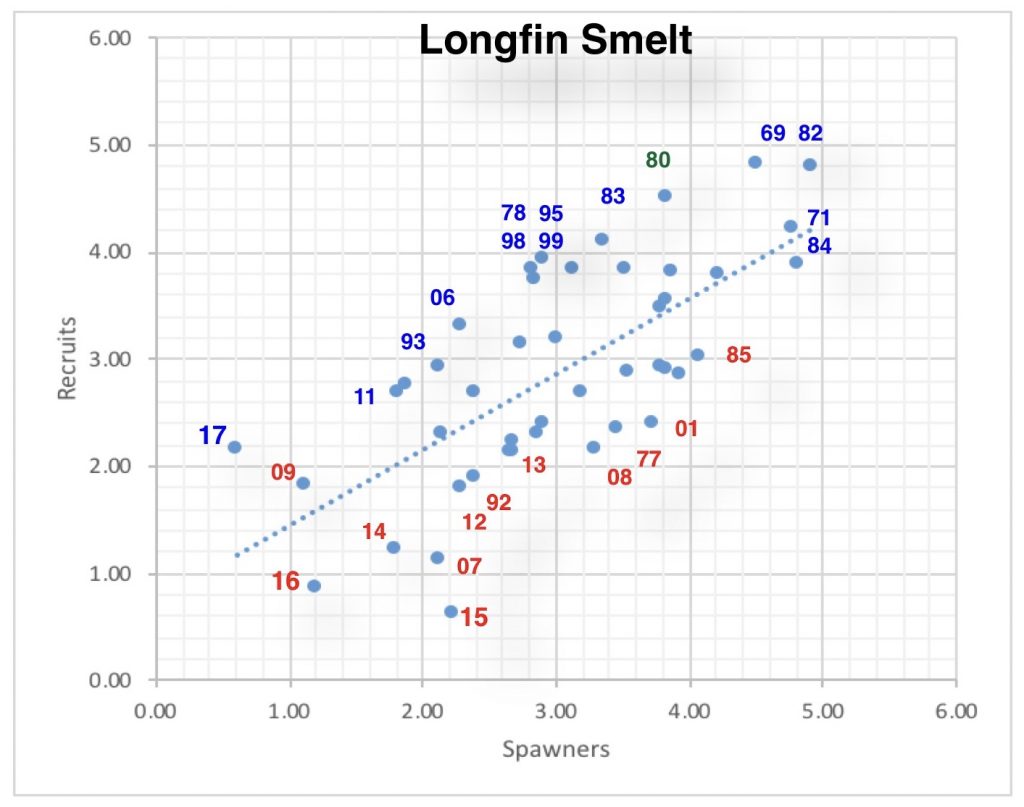
The low escapement in 2015 and 2016 is also reflected in the spawner-recruit relationship (Figure 2). There is a continuing significant positive spawner-to-recruit relationship and even stronger effect of water-year type, with poorer recruitment from dry-year winter rearing conditions.
The low 2016 escapement is likely in part a consequence of a very poor return from brood year 2013 hatchery smolts (Figure 3). Of the approximately one million smolts tagged and released in 2014 at the Coleman hatchery near Redding, less than a tenth of a percent survived to be counted in fisheries and escapement surveys. A good survival rate would be 1 to 3 percent, as occurred for brood year 2010 (2013 run).
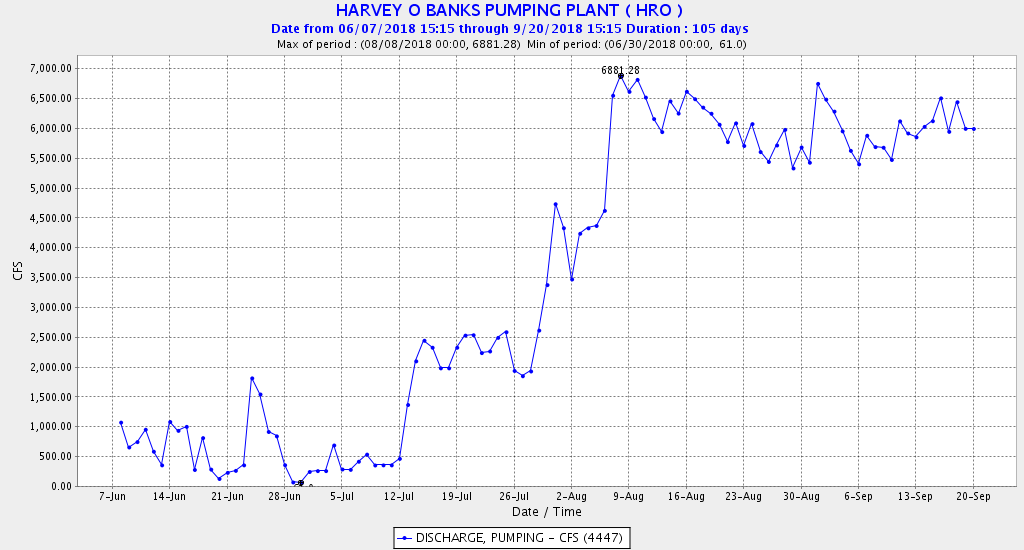
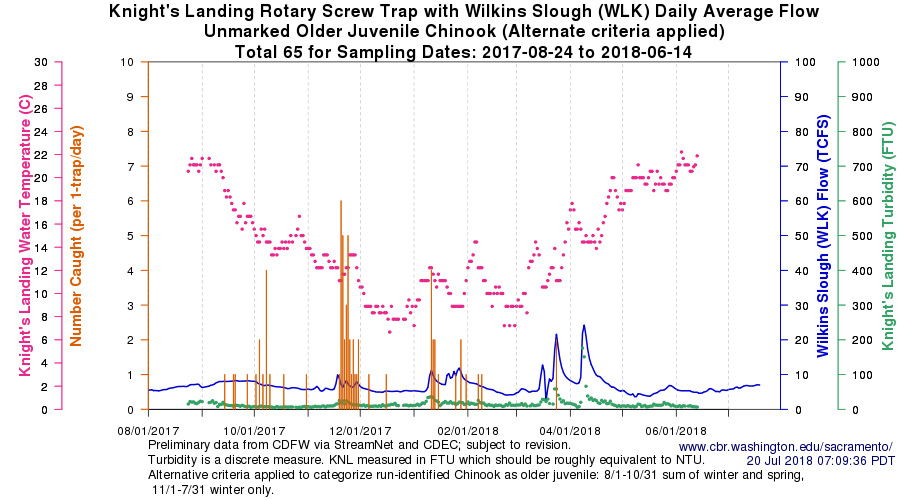
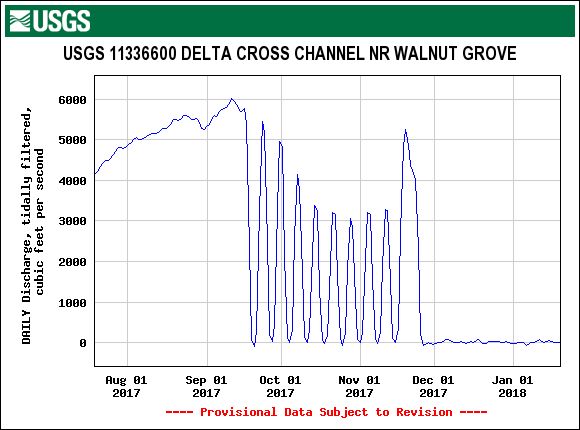
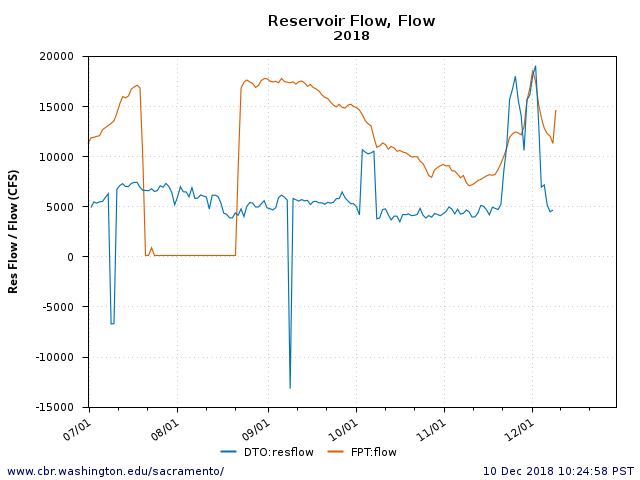
Hatchery and wild smolts from brood year 2013 had poor flow conditions in early winter of 2014 (Figure 4), while brood year 2010 had the best flow conditions. There were no flow pulses to help the smolts move the 200 miles down to the Bay-Delta in January 2014.
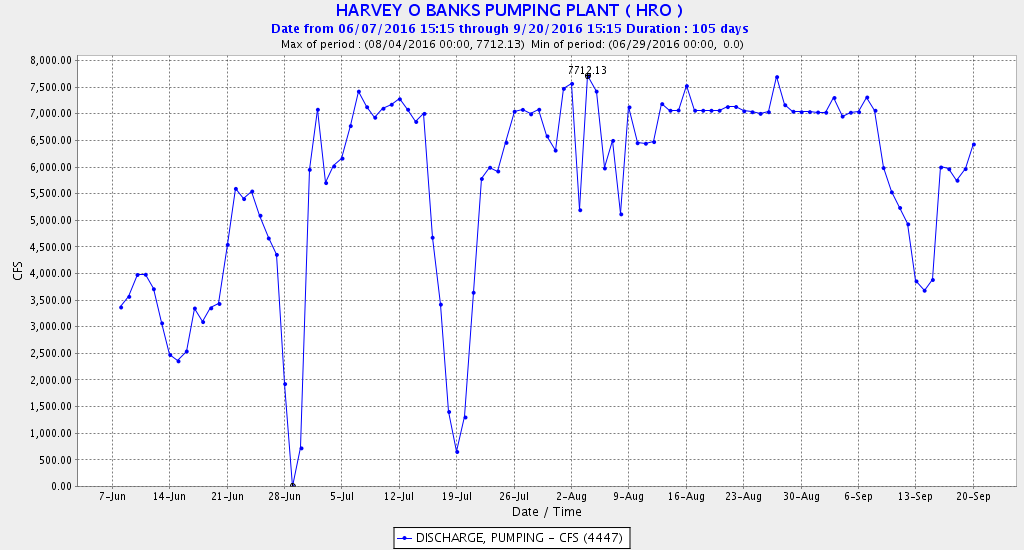
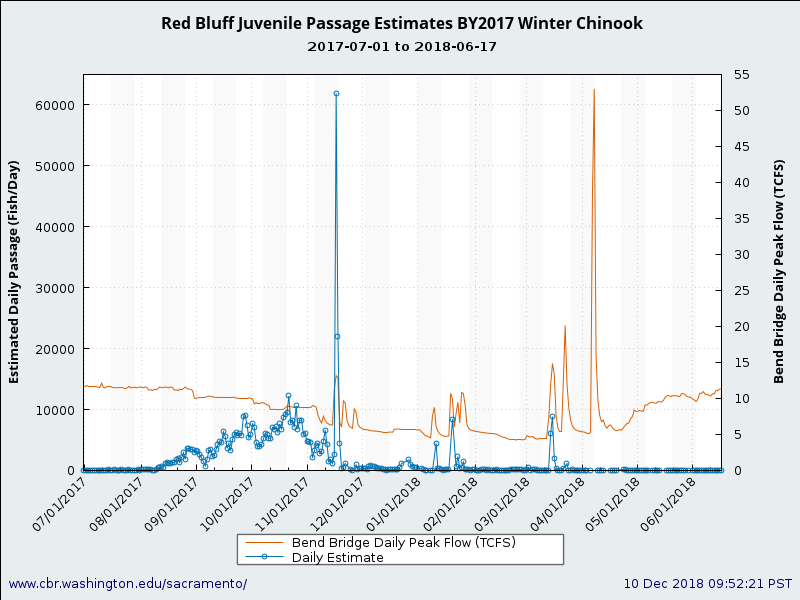
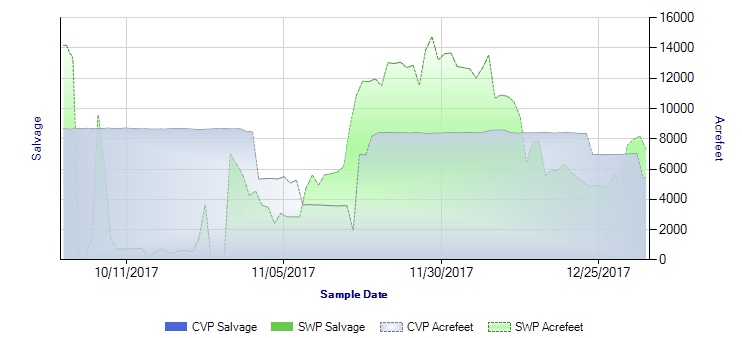
The fact that few late-fall smolts showed up in south Delta salvage in 2014 (Figure 5), compared to higher salvage in 2013 (Figure 6), is compelling evidence that smolt survival to the Delta was very poor in 2014.
Conclusion: To sustain the late–fall-run salmon population, higher winter flows and flow pulses are warranted in the lower Sacramento River in drier years.
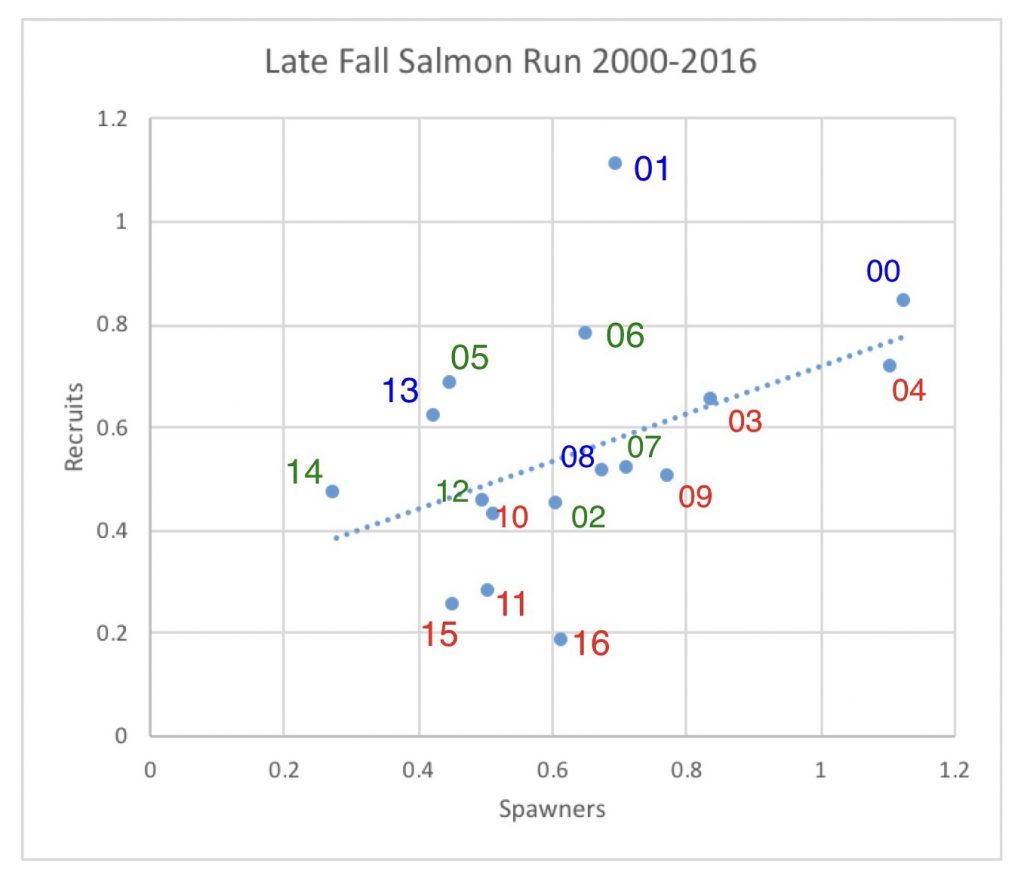
Figure 2. Spawner-recruit relationship for late-fall–run salmon. Number is log10-1.5 transformed escapement (recruits) for the fall of that year. For example, year “16” represents escapement for late fall 2016, which includes spawners from early winter 2017. Spawners represent escapement from three years earlier (brood year). In the example, spawners for year 16 were the progeny of escapement in 2013. Colors represent winter rearing condition two years earlier. In the example, red “16” represents dry winter 2014. Green represents normal years two years earlier. Blue represents wet years two years earlier.
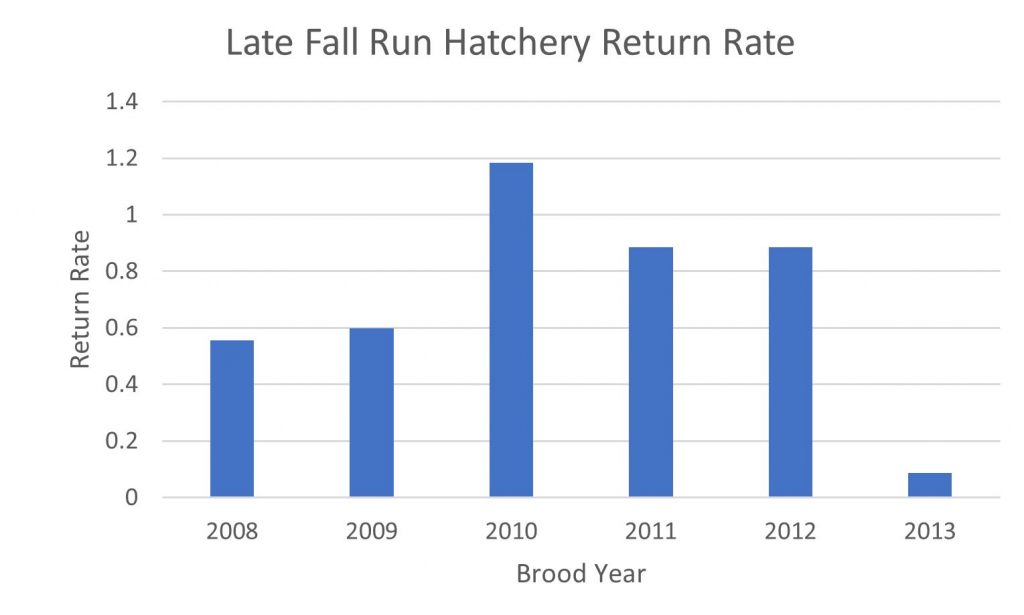
Figure 3. Hatchery smolt survival for brood years 2008-2013 based on coded-wire-tag returns.
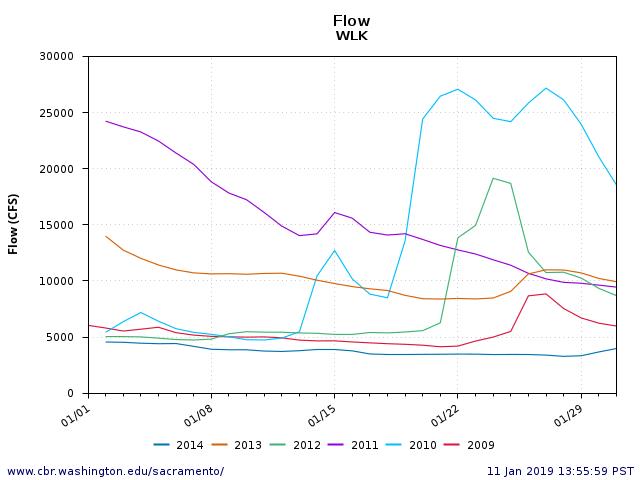
Figure 4. January river flow at Wilkins Slough in lower Sacramento River 2009-2014. Note very low flows and lack of flow pulses in January 2014.
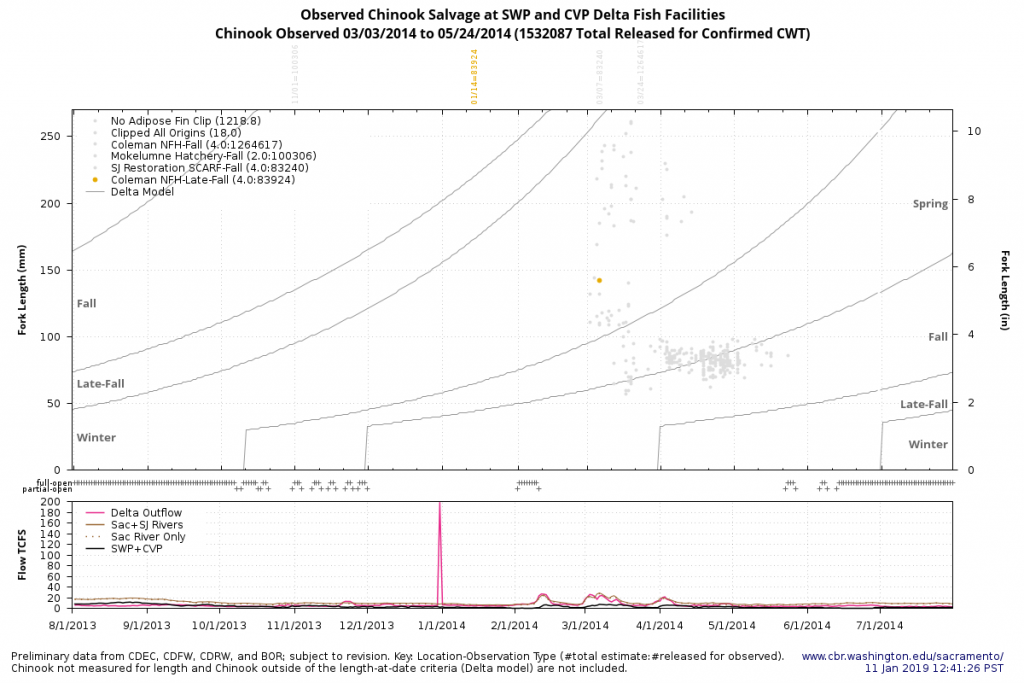
Figure 5. Salvage of salmon at the Delta pumps in water year 2014. Note only one late-fall tagged smolt (yellow dot), collected in March after January release.
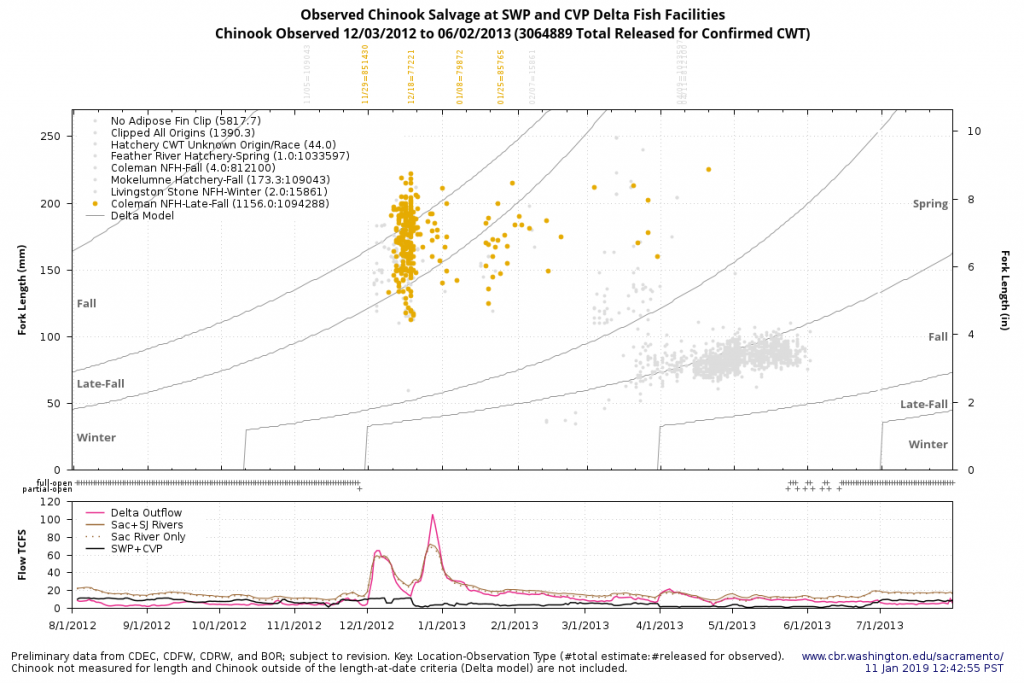
Figure 6. Salvage of salmon at Delta pumps in water year 2013. Note many late-fall tagged smolts salvaged (yellow dots) beginning in December, coincident with flow pulses after December and January releases of hatchery smolts.