Feather River Chinook Salmon Status

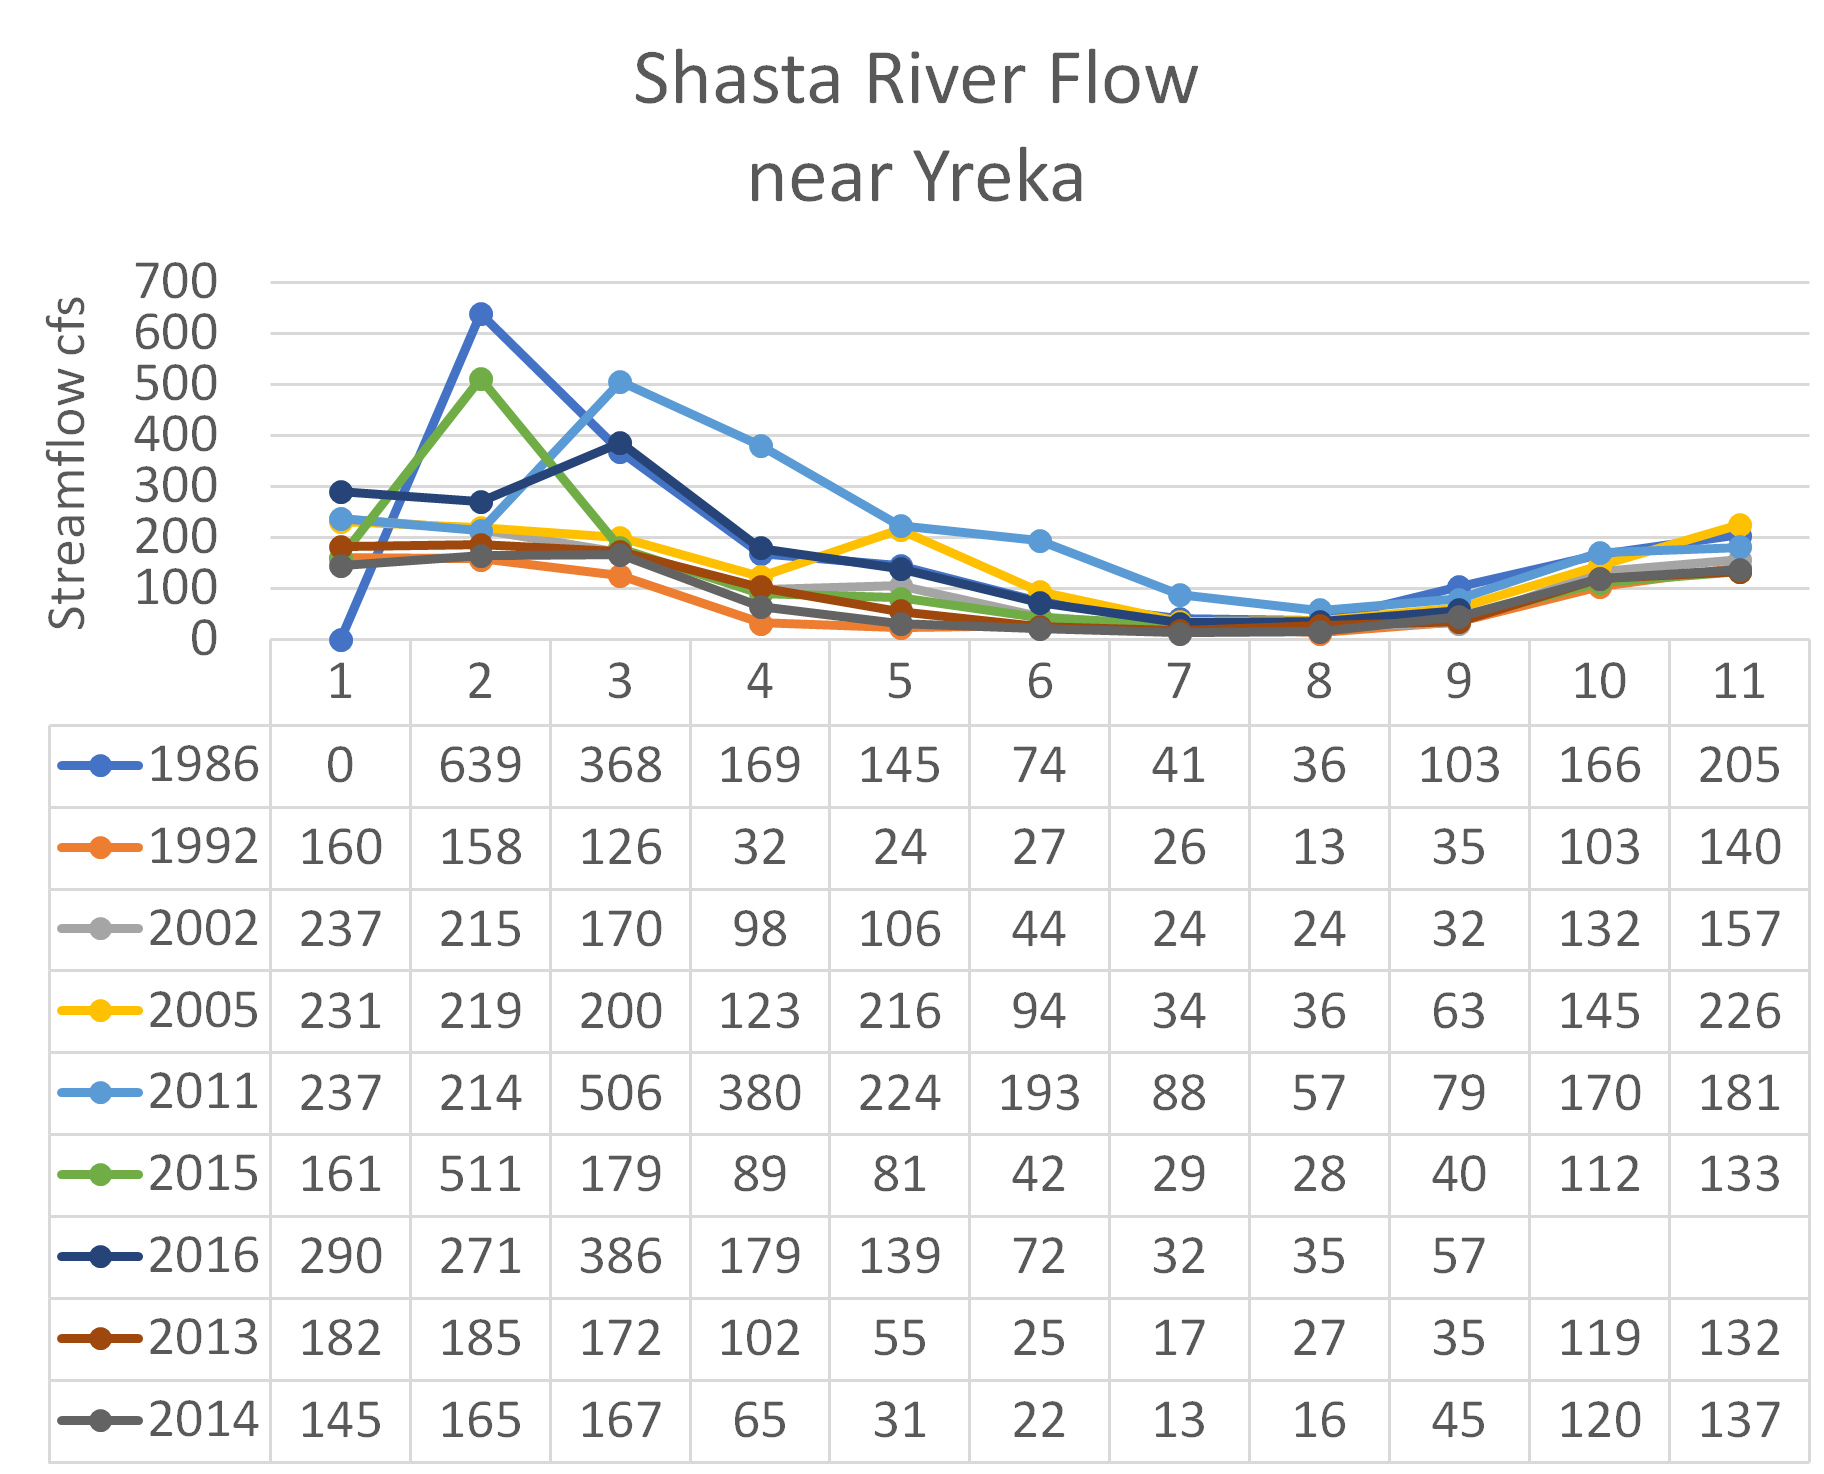
The Feather River has populations of fall-run and spring-run Chinook salmon. Both populations are heavily supplemented (up to 90%) by the Feather River Fish Hatchery near Oroville. There is some natural production in the tailwater below Oroville Dam (Figure 1). The Feather River contributes about 20-25% of the total salmon production in the Central Valley; most are fall-run Chinook.

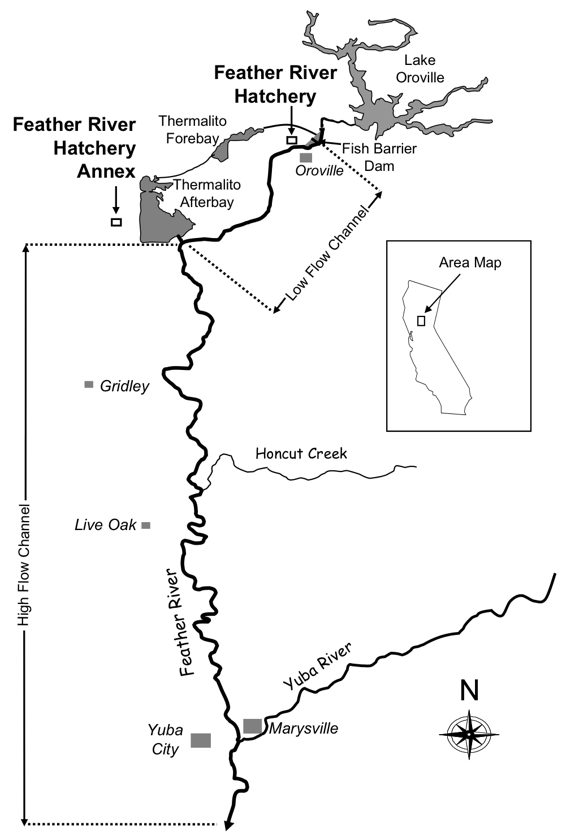
Figure 1. Lower Feather River and hatchery location. Source: CDFW.

In a recent post I discussed the Sacramento River salmon populations. In this post I discuss the Feather River populations of fall-run and spring-run Chinook.

Fall-Run Chinook Salmon

In recent decades, the fall-run salmon population (returns to the hatchery plus estimates of natural production based on carcass and redd surveys) has had two peaks and one severe low (Figure 2). The peaks were 2000-2003 and 2012-2014. These peak runs were likely the product of wet conditions in brood years 1997-2000 and 2010-2012. Strong hatchery contributions were also important, especially trucking and Bay-Delta pen acclimation of transported smolts in those years. The low population years from 2007-2009 are likely the product of a combination of poor ocean conditions (2004-05), lack of pen acclimation for hatchery fish trucked to the Bay (2003-05), the 2006 winter flood, and the drought of 2007-09.

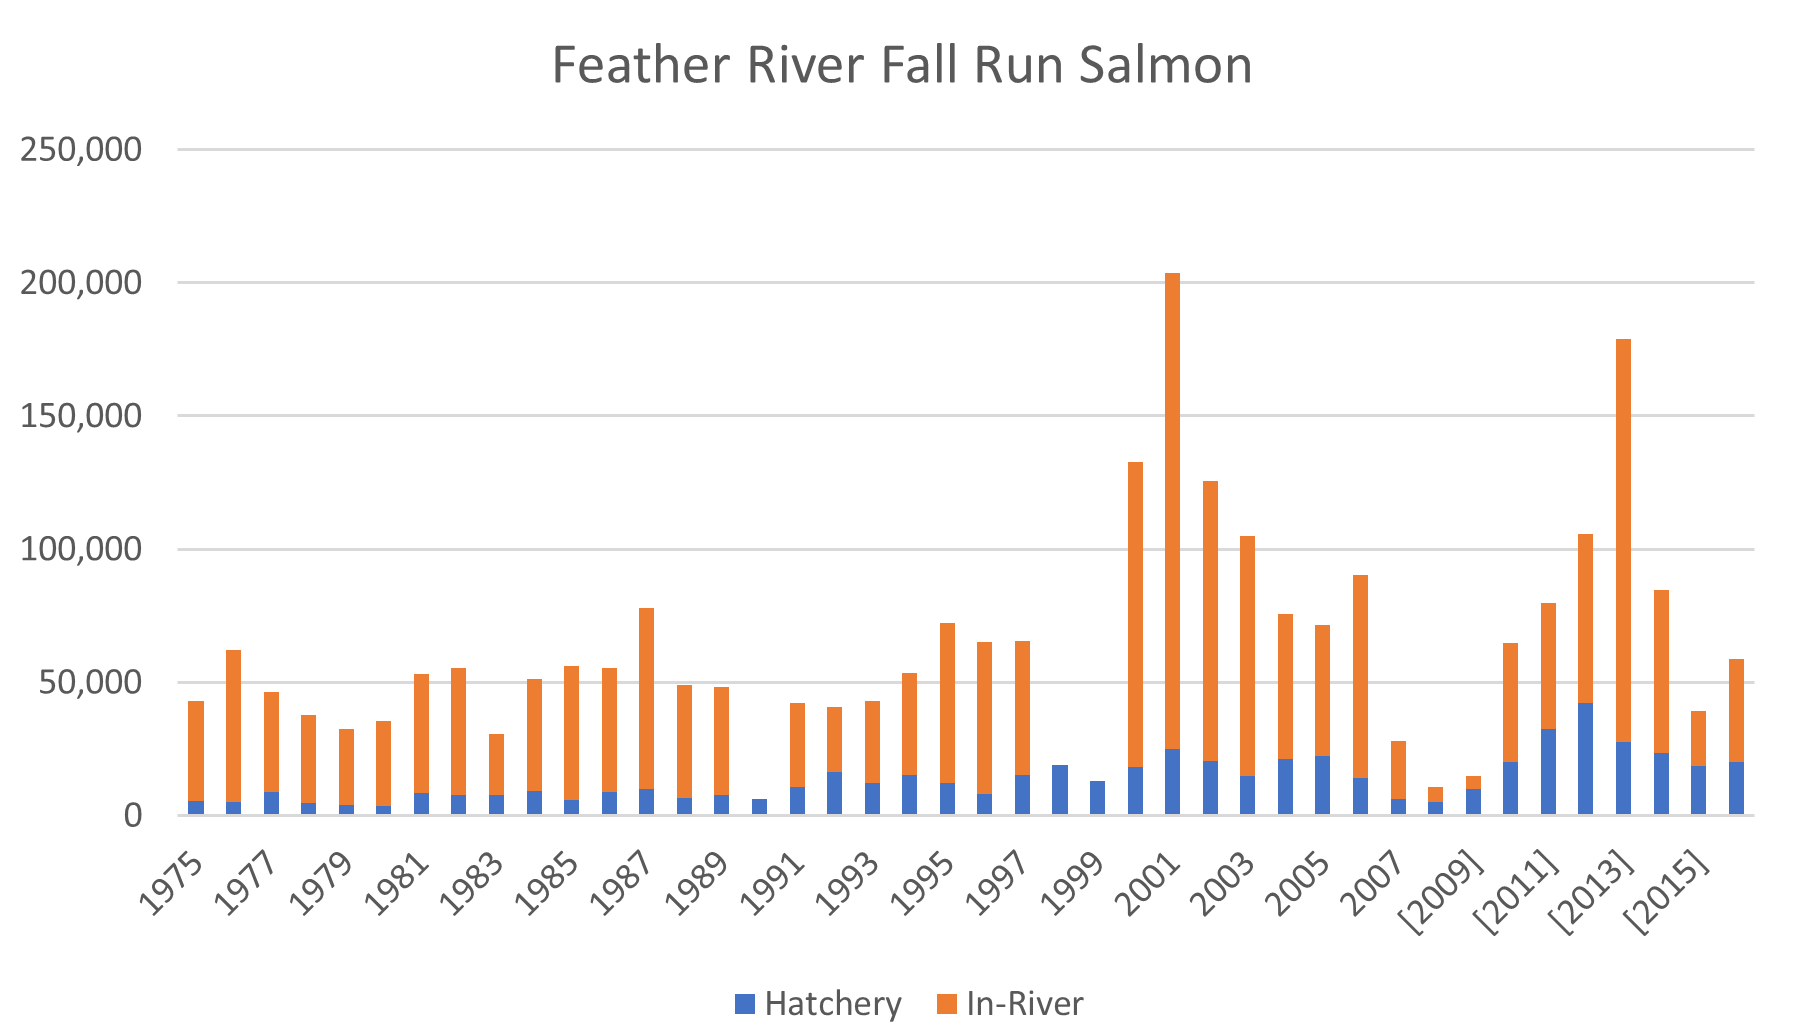
Figure 2. Fall run Chinook salmon escapement to the lower Feather River and hatchery 1975-2016. No in-river estimates are available for 1990, 1998, or 1999. Data source: CDFW GrandTab.

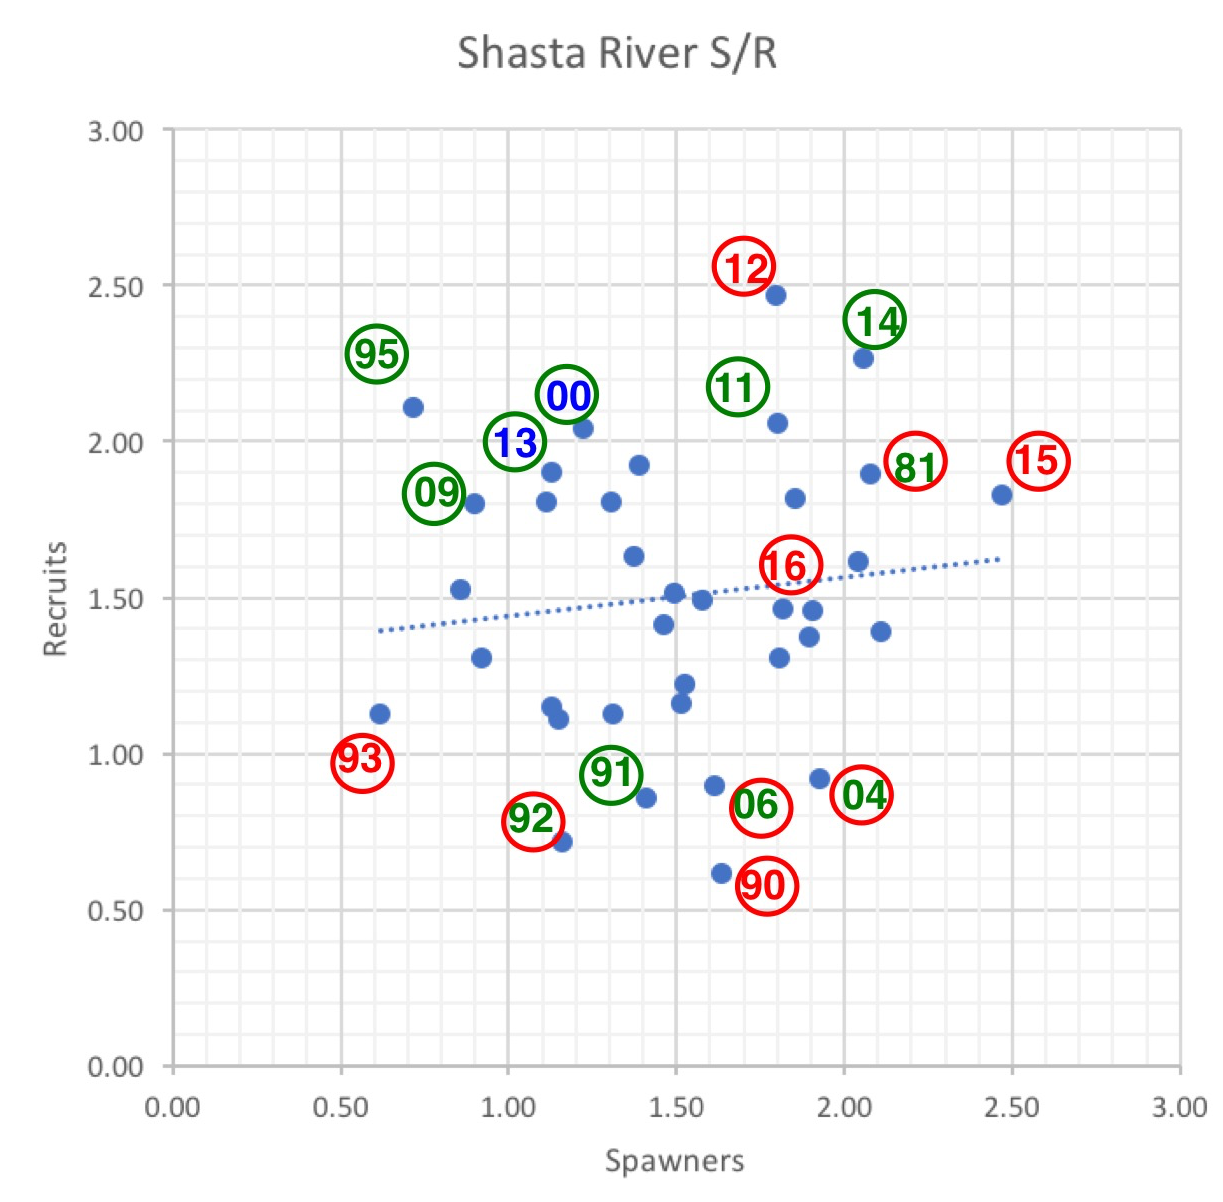
An analysis of the recruitment-per-spawner ratio in the population over the past 40 years (Figure 3) shows some of relationships described above. The relatively high escapements in periods 2011-2014 and 2003-2006, and the low escapement in 2007-2009, are explainable by river hydrologic conditions as well as ocean conditions:

  1. Recruitment is generally depressed in dry rearing years (conditions during winter-spring two years before spawning year).
  2. Recruitment is generally depressed in dry spawning years (conditions during summer-fall spawning run).
  3. Recruitment is generally depressed for brood years subjected to poor ocean conditions (recruitment years 2007-09 and 2015-16).
  4.  There is no apparent recruit-per-spawner relationship unless the outliers of 2011 and 2012 are removed. This lack of relationship is likely due to the strong role of the hatchery in recruitment. Efforts to improve hatchery smolt survival (i.e., higher hatchery smolt production, trucking, pen acclimation, and other actions) implemented during and after the 2008 “crash” likely helped the 2011-13 recruitment. It is likely that improved ocean conditions also increased recruitment in these same years.
  5. The December 2005 – January 2006 flood and associated rare Oroville Dam “spill” of 2006 may also have depressed recruitment in 2008. Only 1997 and 2017 had similar high spills in 1975-2017 period.
  6. A majority of the years had a replacement rate near 1-to-1 (17 years at center of plot), likely reflecting the stability provided by the hatchery.

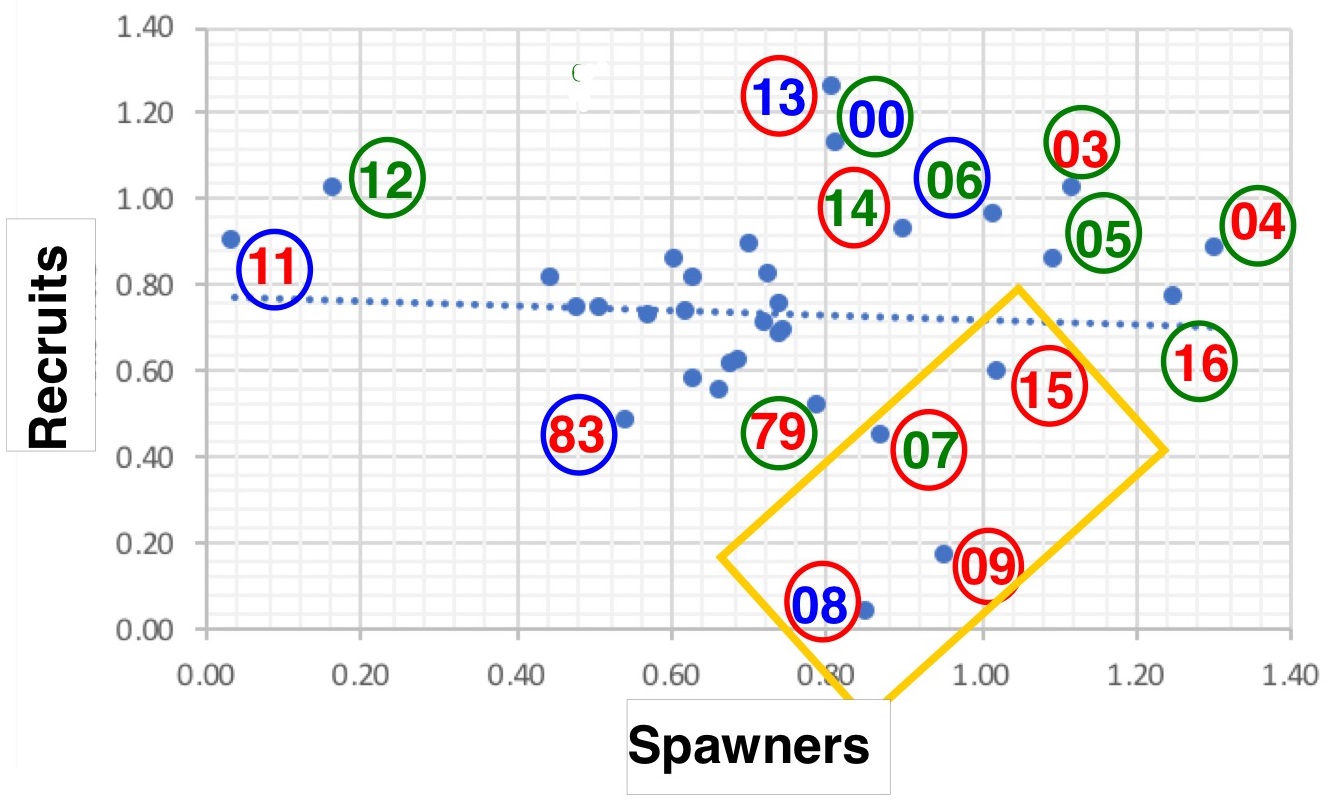
Figure 3. Recruitment-per-spawner relationship for Feather River fall-run salmon from 1975-2016 (log10X-4). Numbers show the years in which adult salmon returned to the Feather. The color of the number refers to hydrologic conditions two years previously, when those adults were juvenile fish rearing in the river or hatchery. The color of the circle shows the hydrologic conditions in the year the adults returned to spawn. Blue denotes a wet water year. Green denotes a normal water year. Red denotes a dry water year. Example: Adults that returned to the Feather River in 1983 reared during dry water year 1981: thus, the number is shown in red. 1983, when the salmon returned as adults to the Feather, was a wet year: thus, the circle around the number is blue. The orange rectangle represents poor ocean years. Recruit years 1990, 95, 98, 99, 01, and 02 are missing.

Hatchery Spring-Run

Feather River spring-run Chinook are listed as endangered by the National Marine Fisheries Service. The Feather River spring Chinook salmon run is measured by the number taken into the hatchery (Figure 4). The main patterns indicate stronger runs after 1985-1986, 1993, 1995-1999, and 2010-2012, wetter period that led to stronger runs 2 to 4 years later. Weaker runs occurred after drier periods 1987-1992, 2001-2005, 2007-2009, and 2012-2015.

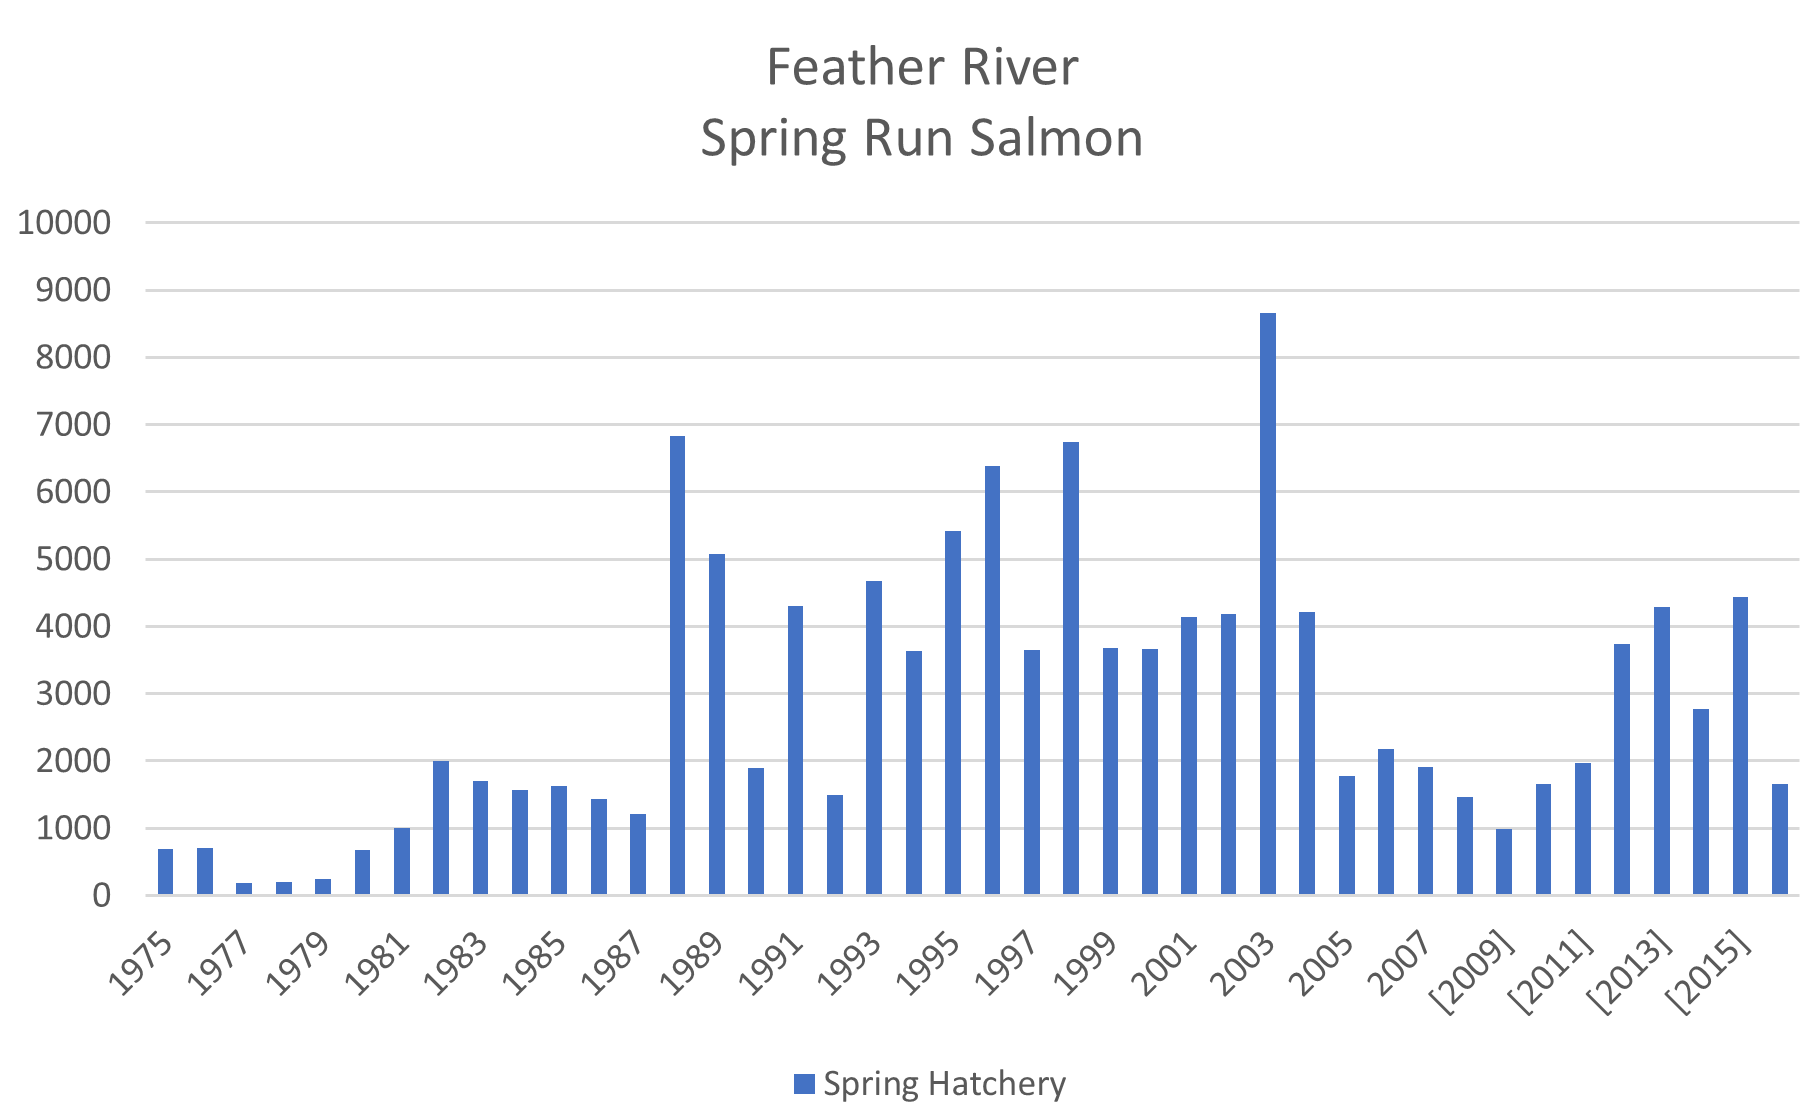
Figure 4. Feather River spring-run hatchery counts from 1975-2016. Source: CDFW GrandTab.

The spring-run accounting is complicated by inability to count in-river spring run spawners, a problem best described by NMFS:

“The proportion of hatchery-origin spring- or fall-run Chinook salmon contributing to the natural spawning spring-run Chinook salmon population on the Feather River remains unknown due to overlap in the spawn timing of spring-run and fall-run Chinook salmon, and lack of physical separation.”1

An analysis of the recruitment per spawner in the population over the past 40 years (Figure 5) shows some of relationships described above:

  1. Strong showings in the late 1990’s and early 2000’s were likely the consequence of trucking to and pen acclimation in the Bay.
  2. Lesser runs from 2005-2011 were likely a consequence of drier years during spawning and rearing, poor ocean conditions, and lack of trucking and pen acclimation upon release.
  3. The poor run in 2016 was in part due to the start of another period of poor ocean conditions that began in 2015.

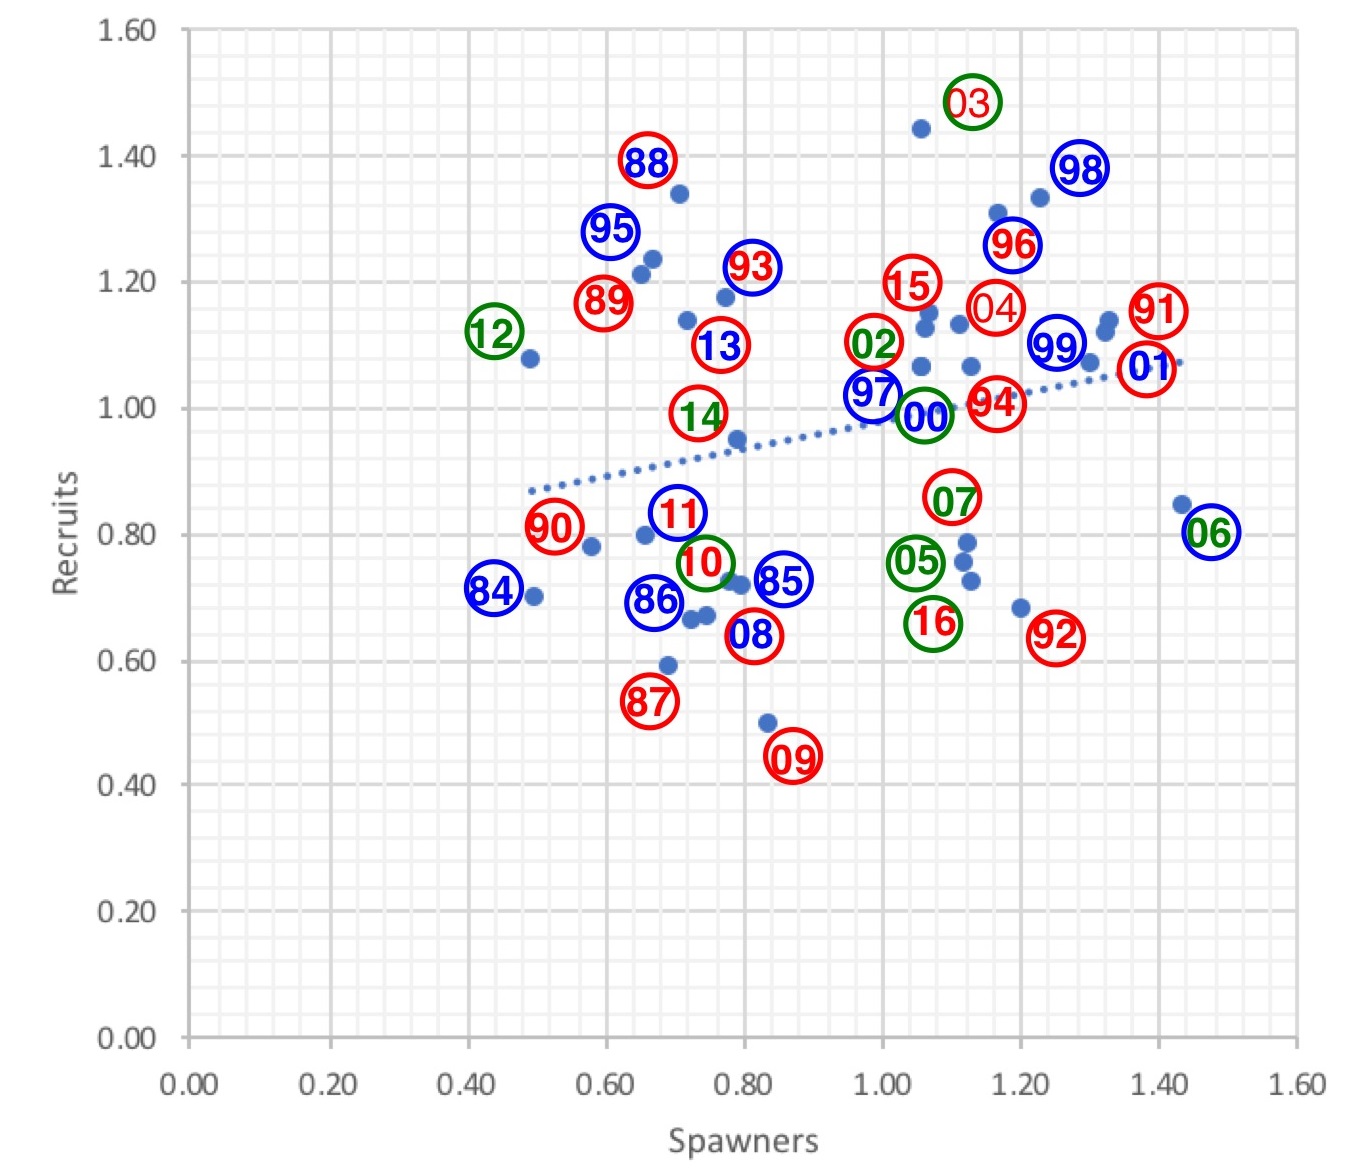
Figure 5. Recruitment-per-spawner relationship for Feather River spring-run salmon from 1975-2016 (log10X – 2.5) . Numbers show the years in which adult salmon returned to the Feather. The color of the number refers to hydrologic conditions two years previously, when those adults were juvenile fish rearing in the river or hatchery. The color of the circle shows the hydrologic conditions in the year the adults returned to spawn. Blue denoates a wet water year. Green denotes a normal water year. Red denotes a dry water year. Example: Adults that returned to the Feather River in 1983 reared during dry water year 1981; the number is shown in red. 1983, when the salmon returned as adults to the Feather, was a wet year; the circle around the number is blue.

Summary

The Feather River salmon runs are an integral part of the Central Valley salmon population, and make a key contribution to commercial and sport fisheries along the coast of California. The Feather River salmon runs are predominately hatchery runs that benefit greatly from trucking to the Bay-Delta. Trucking and pen acclimation in the Bay prior to release result in good survival to and in the ocean and good returns of spawners to the Feather.

Spring 2017 Delta Fish Salvage

Though it is counter-intuitive in a flood year, fish salvage has become a real problem this spring.

Total Delta exports reached 8,000 cfs in the first week in May, and salvage of salmon and splittail increased sharply (Figures 1 and 2). Normally, Delta standards limit export limits to1500 cfs in April-May in order to protect fish. However, higher exports are allowed when San Joaquin River inflows to the Delta are high. Even higher exports than the present 8,000 cfs are allowed, but the infrastructure cannot accommodate further exports in this wet year (demands are low and reservoirs south of the Delta are nearly full).

Figure 1. Salvage of Chinook salmon at south Delta pumping plants in spring 2017. Source: CDFW.

Figure 2. Salvage of splittail at south Delta pumping plants in spring 2017. Source: CDFW.

In past wet years, there were restrictions on south Delta exports in April and May to protect juvenile salmon, steelhead, splittail, and smelt that were rearing or passing through the Delta.  These restrictions also protected adult and juvenile sturgeon.  Figure 3 shows an example of Chinook salmon salvage in 1999.  The initial peak in February 1999 salvage was salvage of fry (1-2 inches).  The spring peaks were hatchery and river-reared smolts, primarily from San Joaquin River tributaries.  Both exports and salvage dropped after April 15.

In 2017, with the diversion of over half the San Joaquin River’s flow into the south Delta through the Head of Old River and other channels (Figure 4), there is a definite risk that high export levels will draw young salmon and splittail from the San Joaquin into the south Delta.  Once in the south Delta, they are subject to 8,000 cfs of diversions and a mix of tidal flows.  The risk is even higher than it might seem, because the reported State Water Project diversion is a daily average.  Water enters Clifton Court Forebay for only about one third of the hours in each day, during incoming tides.  The reported 5000 cfs is actually more like 15,000 cfs operating for those eight hours, adding to the pull toward the pumps of the incoming tides.

Reported salvage is just the tip of the iceberg, because predators eat up to 90% of juvenile salmon that enter the Forebay before these juveniles ever reach the salvage facilities.

In conclusion, the State Water Board needs to change the Delta standard.  It needs to limit spring exports even when San Joaquin flows are high.  In 2006 (Figure 5), the now-defunct Vernalis Adaptive Management Program limited April through mid-May exports despite high San Joaquin flows.  Salvage was markedly low during this period of limited exports.

If exports continue high through May and June in 2017, there will be detrimental effects on San Joaquin salmon, steelhead, and splittail, as well as on Delta smelt.

Figure 3. Salvage of Chinook salmon at south Delta pumping plants in winter-spring 1999. Note reduction in exports after mid-April. Source: CDFW.

Figure 4. High tide flows in the Delta at the beginning of May 2017. Blue represents positive downstream flows during high tides, where tides had minimal influence. Red denotes upstream tidal flow during incoming tides.

Figure 5. Salvage of Chinook salmon at south Delta pumping plants in winter-spring 2006. Note reduction in exports in early April. Winter-spring San Joaquin flows in 2006 were similar to those in 2017. Source: CDFW.

Shasta River Fall Run Chinook Salmon – Status and Future

In an April 10, 2017 post, I described a sharp decline in the Klamath River salmon runs after the 2012-2015 drought. In that post, I also noted the high relative contribution of the Shasta River run to the overall Klamath run, especially in the past six years. The recent upturn in the Shasta River run and its greater contribution to the overall Klamath run is likely a consequence of efforts by the Nature Conservancy and others to restore the Big Springs Complex of the upper river near Weed, Ca.

The Shasta run has increased measurably since 2010 (Figure 1). Cattle were excluded from Big Springs Creek in 2009, and flows, water temperature and juvenile Chinook densities were markedly improved in and below Big Springs Creek.1 The improved juvenile salmon production likely contributed to greater runs from 2011-2015 and to a higher than expected 2016 run given the 2013-2014 drought (Figure 2). The improvement in the Shasta run bodes well for the Shasta and Klamath runs (Figures 3 and 4). The Shasta run recovery is key to sustaining and restoring the Klamath run and coastal Oregon and California fisheries that depend on the Klamath’s contribution. The Shasta River’s spring-fed water supply comes from the Mt. Shasta volcanic complex. This water supply is resilient to drought and climate-change. The reliability of the Shasta River’s water supply makes the Shasta River’s contribution to Klamath salmon runs particularly important.

Restoration of the Shasta River and recovery of its salmon and steelhead populations has only just begun. Further improvements to the Big Springs Complex, especially to its spring-fed water supply (Figure 5) and to its spawning and rearing habitat, are planned. There is also much potential to improve habitat above the outlet of Big Springs Creek, both in the Shasta River and Parks Creek. There is further potential for habitat restoration in downstream tributaries (e.g., Yreka Creek and Little Shasta River). Reconnection of the upper Shasta River above Dwinnell Reservoir to the lower river would restore many miles of historic salmon and steelhead producing habitat.2 These improvements could make it is possible for the Shasta River to once again produce over half the “wild” (non-hatchery) salmon of the Klamath River.

Figure 1. Fall-run Chinook salmon escapement (spawning run) estimates for the Shasta River from 1978 to 2016. Data Source: CDFW GrandTab.

Figure 2. Mean annual Shasta River streamflow (cfs) as measured at Yreka, CA. Source: USGS. Designated water-year types in this figure are the author’s estimates.

Figure 3. Spawner-recruit relationship for Shasta River. Escapement estimates (log10X – 2 transformed) are plotted for recruits by escapement (spawners) three years earlier. Year shown is recruit (escapement) year. The number is the year that fish returned to the Shasta River to spawn. The color of the number depicts the water-year type in the Shasta River during the year the recruits reared. The color of the circle depicts the water-year type in the Klamath River during the year the recruits reared. Blue is for Wet water-year types. Green is for Normal water-year types. Red is for Dry water-year types. Example: 90 depicts fish that returned to the Shasta River as adult spawners in 1990. These fish were spawned in 1987 and reared in winter-spring 1988. The red number shows that the 1988 rearing year was a Dry water year in the Shasta River; the red circle shows that the 1988 rearing year was a Dry water year in the Klamath River. Note very poor recruits per spawner in 1990-1993 drought period, compared with relatively high recruits per spawner from 2011-2016, even though the latter period included the 2012-2015 drought.

Figure 4. Estimates of fall-run Chinook salmon escapement for the Klamath River, 1978-2016. Data Source: CDFW GrandTab.

Figure 5. Examples of Shasta River monthly average flows as measured at the lower end of Shasta Valley. Streamflow is low from late spring through summer because of surface and groundwater irrigation demands. October flows are higher because the irrigation season (and season of diversion under some water rights) ends on September 30. Data source: USGS Yreka gage.

Scott River Fall-Run Chinook Salmon

In an April 10 post on the Klamath Chinook salmon run, I discussed an expected record low run in 2017.  The Klamath run has six subcomponent runs, including the Scott River.  Improving the Scott River run is one means of improving the Klamath run.

Like the adjacent Shasta and Salmon Rivers, the Scott is a unique ecological gem, sitting high in the Marble and Trinity mountains before plunging north down the volcanic escarpment into the Klamath River canyon (Figure 1).  Like the Shasta River, the Scott flows through a mountain rimmed glacial valley not unlike those in the North American Rockies or European Alps.  Scott Valley is one of those “beautiful places.”  It is also one of the last great places for salmon and steelhead in California.  Unlike the Shasta River whose flow is supported by large volcanic springs from Mt. Shasta, the Scott depends on snowmelt from the Marbles and Trinities, as well as on springs from its alluvial valley.

Figure 1. The Scott River Valley in northern California west of Yreka, CA (Yreka is located in the Shasta River Valley). The Scott and Shasta Rivers flow north into the Klamath River, which runs west to the ocean. The Salmon River watershed is immediately west of the Scott River watershed. The upper Trinity River watershed is immediately to the south of the Scott River watershed.

The Scott River is home to wild runs of Chinook salmon, Coho salmon, and steelhead trout that make up significant components of the Klamath River runs of these species. In this post I address the Scott River fall-run Chinook salmon. The California Department of Fish and Wildlife has estimated the annual run size since 1978 (Figure 2).

Figure 2. Escapement of adult fall-run Chinook salmon to the Scott River from 1978 to 2016. Data source: CDFW GrandTab.

The run size, or “escapement” in fisheries science vernacular, is a consequence of the previous number of spawners; their success; survival of eggs, embryos, fry, and smolts in rivers; survival for up to several years in the ocean; and finally, the success of adults migrating back from the ocean to river spawning grounds. There is a lot that can happen at each of these life stages that may affect the ultimate escapement. I show the effect of several key factors in Figure 3, which starts from the escapement numbers in Figure 2 and shows the recruits-per-spawner relationship.

I hypothesized the following from the Figure 3 recruits-per-spawner relationship:

  1. Recruits-per-spawner is generally higher for wet (blue) rearing conditions – the winter/spring conditions of the year that followed the spawning or brood year. Note that smolts generally reach the ocean by their first summer, so conditions early in their rearing year likely affect survival prior to entering the ocean. Survival may be affected by the rearing conditions in the Scott River and/or those downstream in the Klamath River. Low late-winter and spring flows affect river rearing survival as well as the overall survival during emigration to the ocean. Ocean survival can be a consequence of success during river rearing or emigration: of the smolts that reach the ocean, larger healthier smolts generally survive better in the ocean.
  2. Recruits-per-spawner is generally lower as a consequence of dry conditions during the spawning run (red circle years have lower recruits-per-spawner). The lower Klamath River die-off of adult salmon in 2002 was an example of dry year mortality during the spawning migration.
  3. Recruits-per-spawner may be depressed in very wet rearing years when floods disturb spawning beds of salmon. An example is 1999. The number of recruits was depressed by the 1997 New Years flood, which affected the fall 1996 spawn. Similarly, floods in winter 1982, 1983, 1996, 1998, and 2006 may have reduced survival and run size in 1984, 1985, 1998, 2000, and 2008.
  4. The number of spawners three years earlier has little or no apparent effect on the number of recruits (at least at these levels of spawners). For example: recruits in 2007 and 2008 were relatively high despite low number of spawners three years earlier.

I derived the wet or dry water year designations using Figure 4. I derived the wet or dry August-September streamflow designations for the spawning run from the average monthly Scott River streamflow for those months and years (Figure 5 shows a sample range of years). Note that there is not a lot of difference among years in the August-October flows – they are all relatively low. That is because by August, the snow-melt season is over and base flows are occurring from springs and hay-field and pasture runoff or seepage.

There is also the negative effect on flows from wells and surface diversions, the predominate forms of irrigation in Scott Valley. In the drier years the late summer and early fall river flows exiting the Valley below Ft. Jones can be extremely low (less than 10 cfs – see Figure 5) because of extensive well use, driven by lower available surface water. Low late summer and early fall flows can block salmon from entering the river for several months (Figure 6). This results in loss of stored energy, lower egg viability, and high pre-spawn mortality. It also results in delayed spawning, increasing the likelihood that salmon will spawn in the lower sections of the Scott River, where there is poor spawning and rearing habitat. Low flows in the river upstream can further hinder migration and access to prime spawning tributaries (Figure 7).

It takes about 100 cfs or higher to provide full access to the upper river’s spawning areas. In most years, flows are too low to provide good access. The Scott River Water Trust purchases irrigation water in some years to help the salmon migration. In most years, the river’s baseflows increase soon after the irrigation draw on groundwater ends in late October, allowing unhindered migration.

Part of the solution to the problem of low flows during the spawning run is to cease irrigation earlier. Hay irrigators generally cease pumping water by October 1, and some say there is minimal benefit of irrigating after August. Ranchers often irrigate pastures into November, if only for stock watering. Because many wells are not operated after August, idle wells have sufficient total capacity to readily keep the river watered after September 1 to pump groundwater directly into the river (ranchers would consider this if the costs of pumping were covered). I believe the effect of the extra pumping on groundwater levels would be minimal, because the Valley aquifer recovers from well pumping over the winter-spring recharge season.

Survival during the late winter-early spring rearing and emigration period could be enhanced in drier years by limiting early spring irrigation use and using selected idle wells prior to the irrigation season to add water directly to the river.

In summary, the Scott Chinook fall-run is reduced in dry years when spawning and rearing success are compromised by low river flows in the Scott and Klamath Rivers. The Scott River Chinook salmon population would likely benefit from (1) improved late-summer and early-fall flows that would improve access of spawners to upriver and tributary spawning grounds, and (2) higher river flows in drier years during the late–winter and early-spring rearing and emigration period. A record low run is expected in fall 2017 because of low fall and spring flows in 2015, which limited the survival of the juveniles from the 2014 run.

Figure 3. The recruit-per-spawner relationship for the Scott River fall-run Chinook salmon from 1978 to 2016. Escapement by year (recruits) is plotted against escapement three years earlier (spawners). The escapement values plotted are transformed (Log10X-2). The number shown is the escapement year or recruit year – the year the run was tallied. Number color denotes rearing year water supply type – two years prior to recruit year. Red is dry. Green is average. Blue is wet. Circle represents escapement year water supply during the spawning run (August-September). For example: “04” is run size in fall 2004, which had an average winter-spring rearing year (water year 2002) and dry conditions during the late summer run in 2004 (red circle).

Figure 4. Water years (10/1-9/30) 1978-2016 average annual flow in Scott River measured at Ft. Jones gage. Source: USGS. I designated years above the blue line as wet years, years below the red line as dry years, and years between the lines as average years.

Figure 5. Scott River average monthly flow (cfs) below Ft. Jones for selected years. Source: USGS.

Figure 6. Adult fall-run Chinook salmon waiting at the mouth of the Scott River in the Klamath River in late summer for flows to improve before attempting to migrate up the Scott River to their spawning grounds.

Figure 7. Trickle of flow in the mainstem Scott River in Scott Valley during late summer below Young’s Dam irrigation diversion near Etna, CA. The dam can be seen in the distance at upper center of photo. The fish ladder at the dam is not functional at such low flows. The dam is located approximately 50 river-miles upstream from the river mouth. There is approximately 20 miles of additional Chinook salmon spawning habitat upstream of Young’s Dam.

Longfin Smelt Return from the Ocean

Back in December, I posted that longfin smelt may be gone.  Numbers were way down and early winter 2017 larvae surveys indicated a very poor spawn.  But suddenly in March, larval smelt began showing up in the CDFW 20-mm survey in San Pablo Bay and in the Napa River (Figure 1).  A bunch of adult longfin must have come in from the ocean and surrounding San Francisco Bay with this winter’s very high Delta outflows, and spawned in the Napa River.  While these larval densities are one or two orders of magnitude below previous wet year abundance (1999, 2006, and 2011), they are much higher than those observed in other years over the past decade.  Despite very low recruitment during the recent drought (2013-2015), they were able to muster enough 1-2 year-old adult spawners from around the Bay and nearby ocean to provide a decent spawn in the Napa River.  There appears to be some hope for longfin smelt after all.

Figure 1. Longfin smelt catch densities in March 2017 20-mm Survey. Source : CDFW 20-mm Survey.