The Feather River has populations of fall-run and spring-run Chinook salmon. Both populations are heavily supplemented (up to 90%) by the Feather River Fish Hatchery near Oroville. There is some natural production in the tailwater below Oroville Dam (Figure 1). The Feather River contributes about 20-25% of the total salmon production in the Central Valley; most are fall-run Chinook.
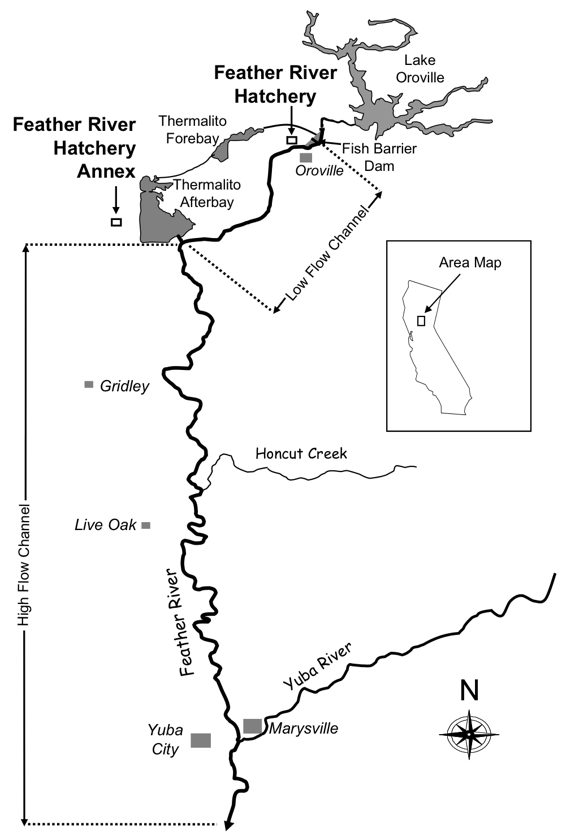
Figure 1. Lower Feather River and hatchery location. Source: CDFW.
In a recent post I discussed the Sacramento River salmon populations. In this post I discuss the Feather River populations of fall-run and spring-run Chinook.
Fall-Run Chinook Salmon
In recent decades, the fall-run salmon population (returns to the hatchery plus estimates of natural production based on carcass and redd surveys) has had two peaks and one severe low (Figure 2). The peaks were 2000-2003 and 2012-2014. These peak runs were likely the product of wet conditions in brood years 1997-2000 and 2010-2012. Strong hatchery contributions were also important, especially trucking and Bay-Delta pen acclimation of transported smolts in those years. The low population years from 2007-2009 are likely the product of a combination of poor ocean conditions (2004-05), lack of pen acclimation for hatchery fish trucked to the Bay (2003-05), the 2006 winter flood, and the drought of 2007-09.
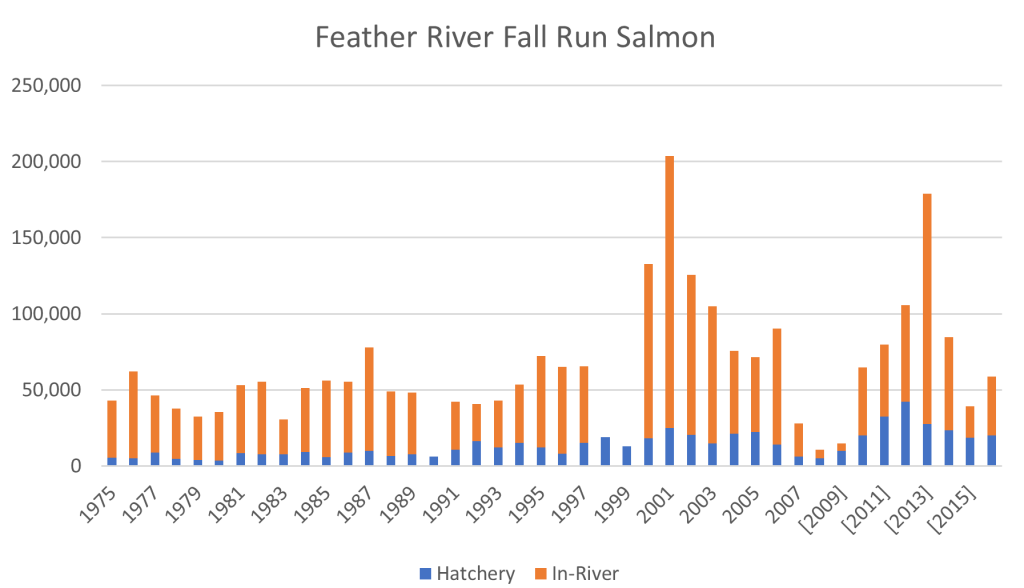
Figure 2. Fall run Chinook salmon escapement to the lower Feather River and hatchery 1975-2016. No in-river estimates are available for 1990, 1998, or 1999. Data source: CDFW GrandTab.
An analysis of the recruitment-per-spawner ratio in the population over the past 40 years (Figure 3) shows some of relationships described above. The relatively high escapements in periods 2011-2014 and 2003-2006, and the low escapement in 2007-2009, are explainable by river hydrologic conditions as well as ocean conditions:
- Recruitment is generally depressed in dry rearing years (conditions during winter-spring two years before spawning year).
- Recruitment is generally depressed in dry spawning years (conditions during summer-fall spawning run).
- Recruitment is generally depressed for brood years subjected to poor ocean conditions (recruitment years 2007-09 and 2015-16).
- There is no apparent recruit-per-spawner relationship unless the outliers of 2011 and 2012 are removed. This lack of relationship is likely due to the strong role of the hatchery in recruitment. Efforts to improve hatchery smolt survival (i.e., higher hatchery smolt production, trucking, pen acclimation, and other actions) implemented during and after the 2008 “crash” likely helped the 2011-13 recruitment. It is likely that improved ocean conditions also increased recruitment in these same years.
- The December 2005 – January 2006 flood and associated rare Oroville Dam “spill” of 2006 may also have depressed recruitment in 2008. Only 1997 and 2017 had similar high spills in 1975-2017 period.
- A majority of the years had a replacement rate near 1-to-1 (17 years at center of plot), likely reflecting the stability provided by the hatchery.
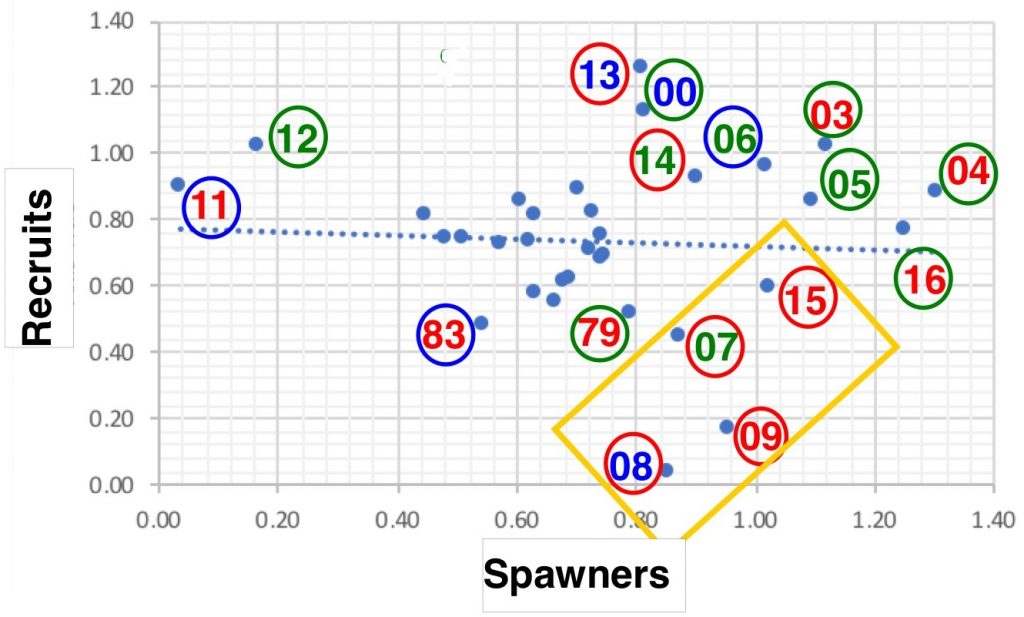
Figure 3. Recruitment-per-spawner relationship for Feather River fall-run salmon from 1975-2016 (log10X-4). Numbers show the years in which adult salmon returned to the Feather. The color of the number refers to hydrologic conditions two years previously, when those adults were juvenile fish rearing in the river or hatchery. The color of the circle shows the hydrologic conditions in the year the adults returned to spawn. Blue denotes a wet water year. Green denotes a normal water year. Red denotes a dry water year. Example: Adults that returned to the Feather River in 1983 reared during dry water year 1981: thus, the number is shown in red. 1983, when the salmon returned as adults to the Feather, was a wet year: thus, the circle around the number is blue. The orange rectangle represents poor ocean years. Recruit years 1990, 95, 98, 99, 01, and 02 are missing.
Hatchery Spring-Run
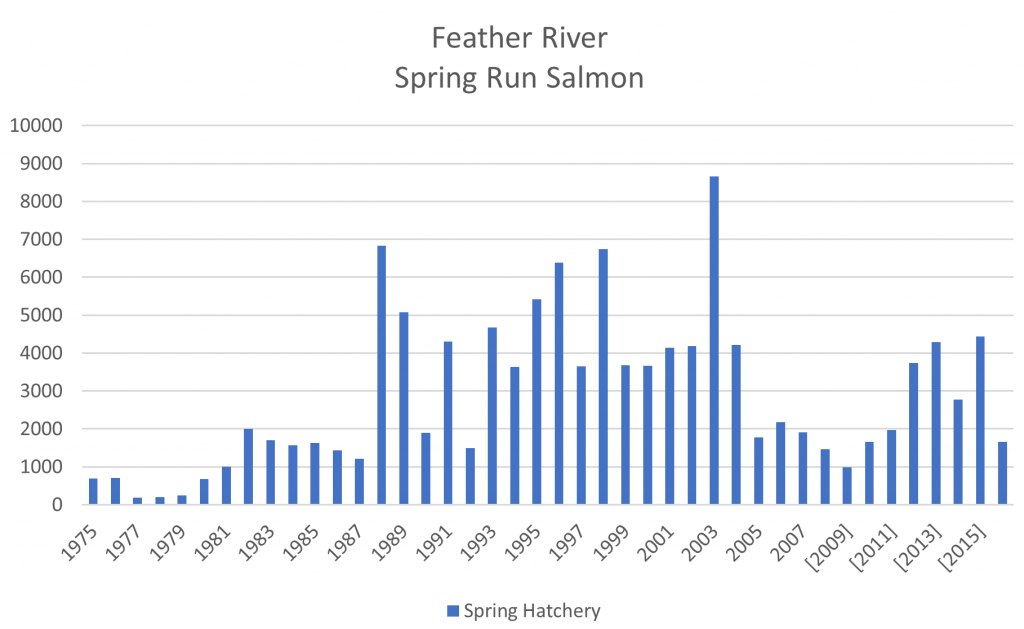
Feather River spring-run Chinook are listed as endangered by the National Marine Fisheries Service. The Feather River spring Chinook salmon run is measured by the number taken into the hatchery (Figure 4). The main patterns indicate stronger runs after 1985-1986, 1993, 1995-1999, and 2010-2012, wetter period that led to stronger runs 2 to 4 years later. Weaker runs occurred after drier periods 1987-1992, 2001-2005, 2007-2009, and 2012-2015.
The spring-run accounting is complicated by inability to count in-river spring run spawners, a problem best described by NMFS:
“The proportion of hatchery-origin spring- or fall-run Chinook salmon contributing to the natural spawning spring-run Chinook salmon population on the Feather River remains unknown due to overlap in the spawn timing of spring-run and fall-run Chinook salmon, and lack of physical separation.”1
An analysis of the recruitment per spawner in the population over the past 40 years (Figure 5) shows some of relationships described above:
- Strong showings in the late 1990’s and early 2000’s were likely the consequence of trucking to and pen acclimation in the Bay.
- Lesser runs from 2005-2011 were likely a consequence of drier years during spawning and rearing, poor ocean conditions, and lack of trucking and pen acclimation upon release.
- The poor run in 2016 was in part due to the start of another period of poor ocean conditions that began in 2015.
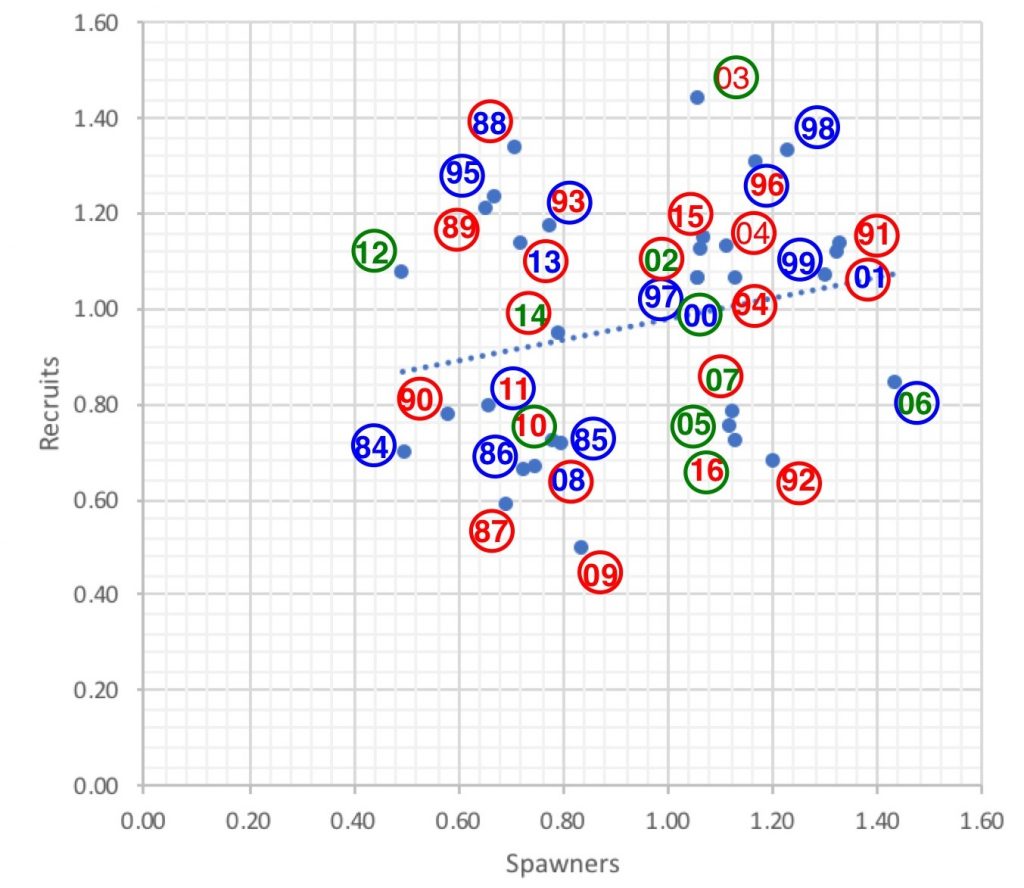
Figure 5. Recruitment-per-spawner relationship for Feather River spring-run salmon from 1975-2016 (log10X – 2.5) . Numbers show the years in which adult salmon returned to the Feather. The color of the number refers to hydrologic conditions two years previously, when those adults were juvenile fish rearing in the river or hatchery. The color of the circle shows the hydrologic conditions in the year the adults returned to spawn. Blue denoates a wet water year. Green denotes a normal water year. Red denotes a dry water year. Example: Adults that returned to the Feather River in 1983 reared during dry water year 1981; the number is shown in red. 1983, when the salmon returned as adults to the Feather, was a wet year; the circle around the number is blue.
Summary
The Feather River salmon runs are an integral part of the Central Valley salmon population, and make a key contribution to commercial and sport fisheries along the coast of California. The Feather River salmon runs are predominately hatchery runs that benefit greatly from trucking to the Bay-Delta. Trucking and pen acclimation in the Bay prior to release result in good survival to and in the ocean and good returns of spawners to the Feather.

