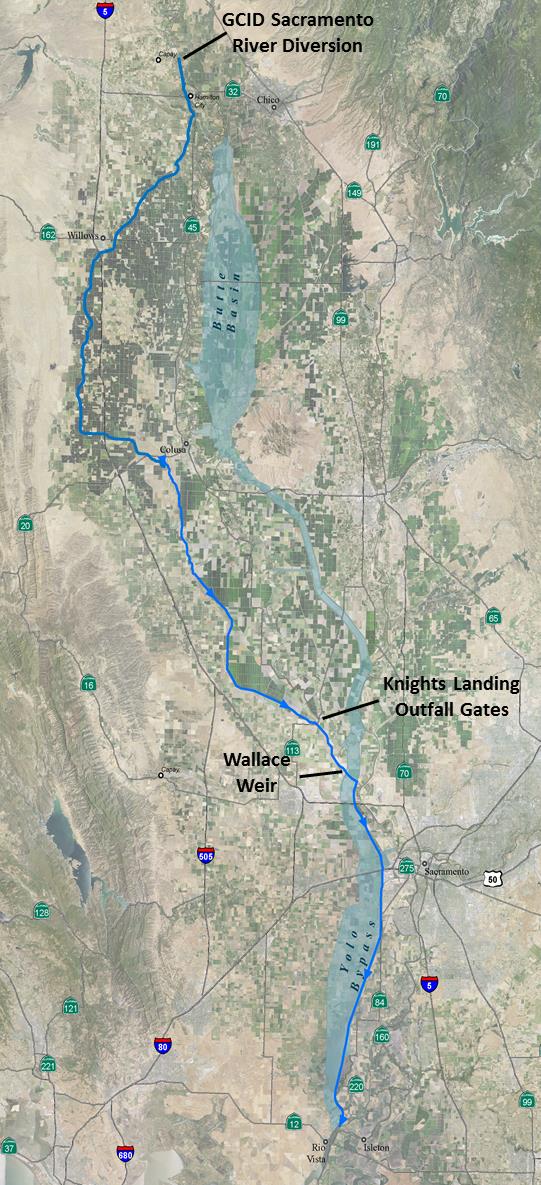
Recently I posted about an unprecedented experiment being undertaken as part of the State’s new Delta Smelt Resiliency Strategy July 2016. That experiment now underway (“Experiment 1”) involves increasing Delta outflow in the latter part of July, 2016. The Strategy also included the North Delta Food Web Adaptive Management Projects (“Experiment 2”), management actions that would benefit juvenile and sub-adult Delta smelt by enhancing the north Delta forage supply for Delta smelt. Experiment 2 involves enhancing flow through the Yolo Bypass to the north Delta by closing the Knights Landing Outfall Gates and routing water from the Sacramento River at Hamilton City (GCID intakes) via the Colusa Basin Drain system into the Yolo Bypass to promote food production in areas where Delta smelt are known to occur. The objective of Experiment 2 is to enhance flow and increase nutrient inputs into the tidal north Delta in the Cache Slough-Lower Bypass region. Future food web enhancement flows would also be considered for “additional months in ways that will not conflict with agricultural and waterfowl management actions based on the availability of water to augment flows in the Yolo Bypass. DWR will also explore options for increasing outflow from the Yolo Bypass during the spring.” Experiment 2 also commenced in July 2016 as an “Emergency Action to Help Delta Smelt”.
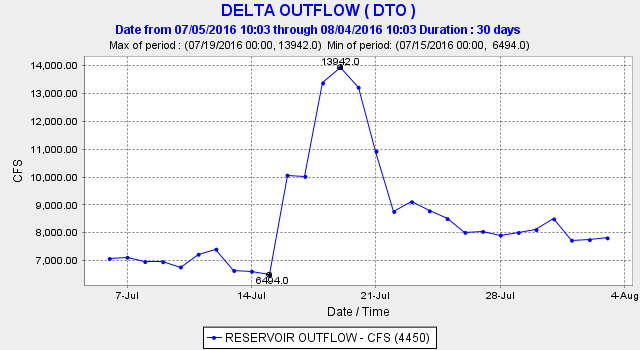
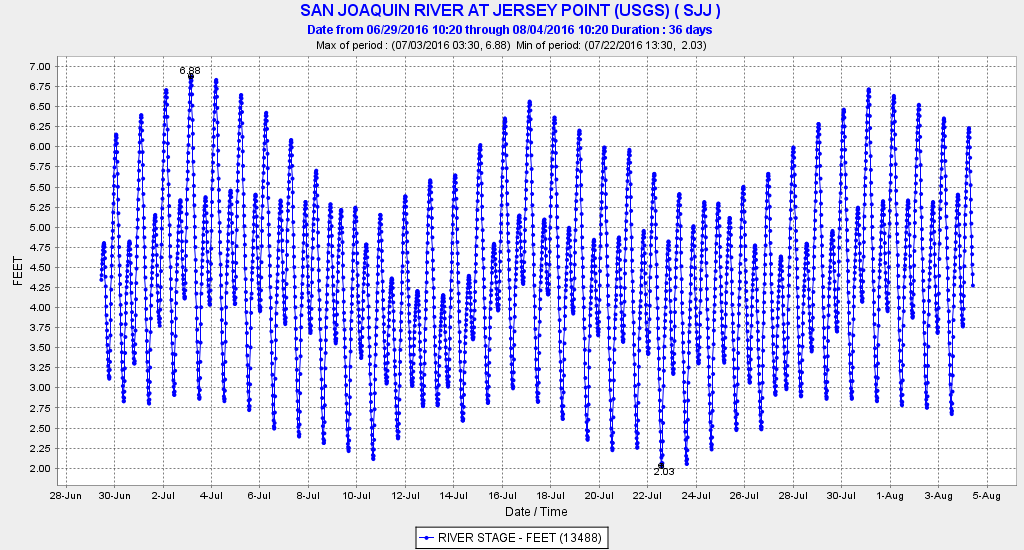
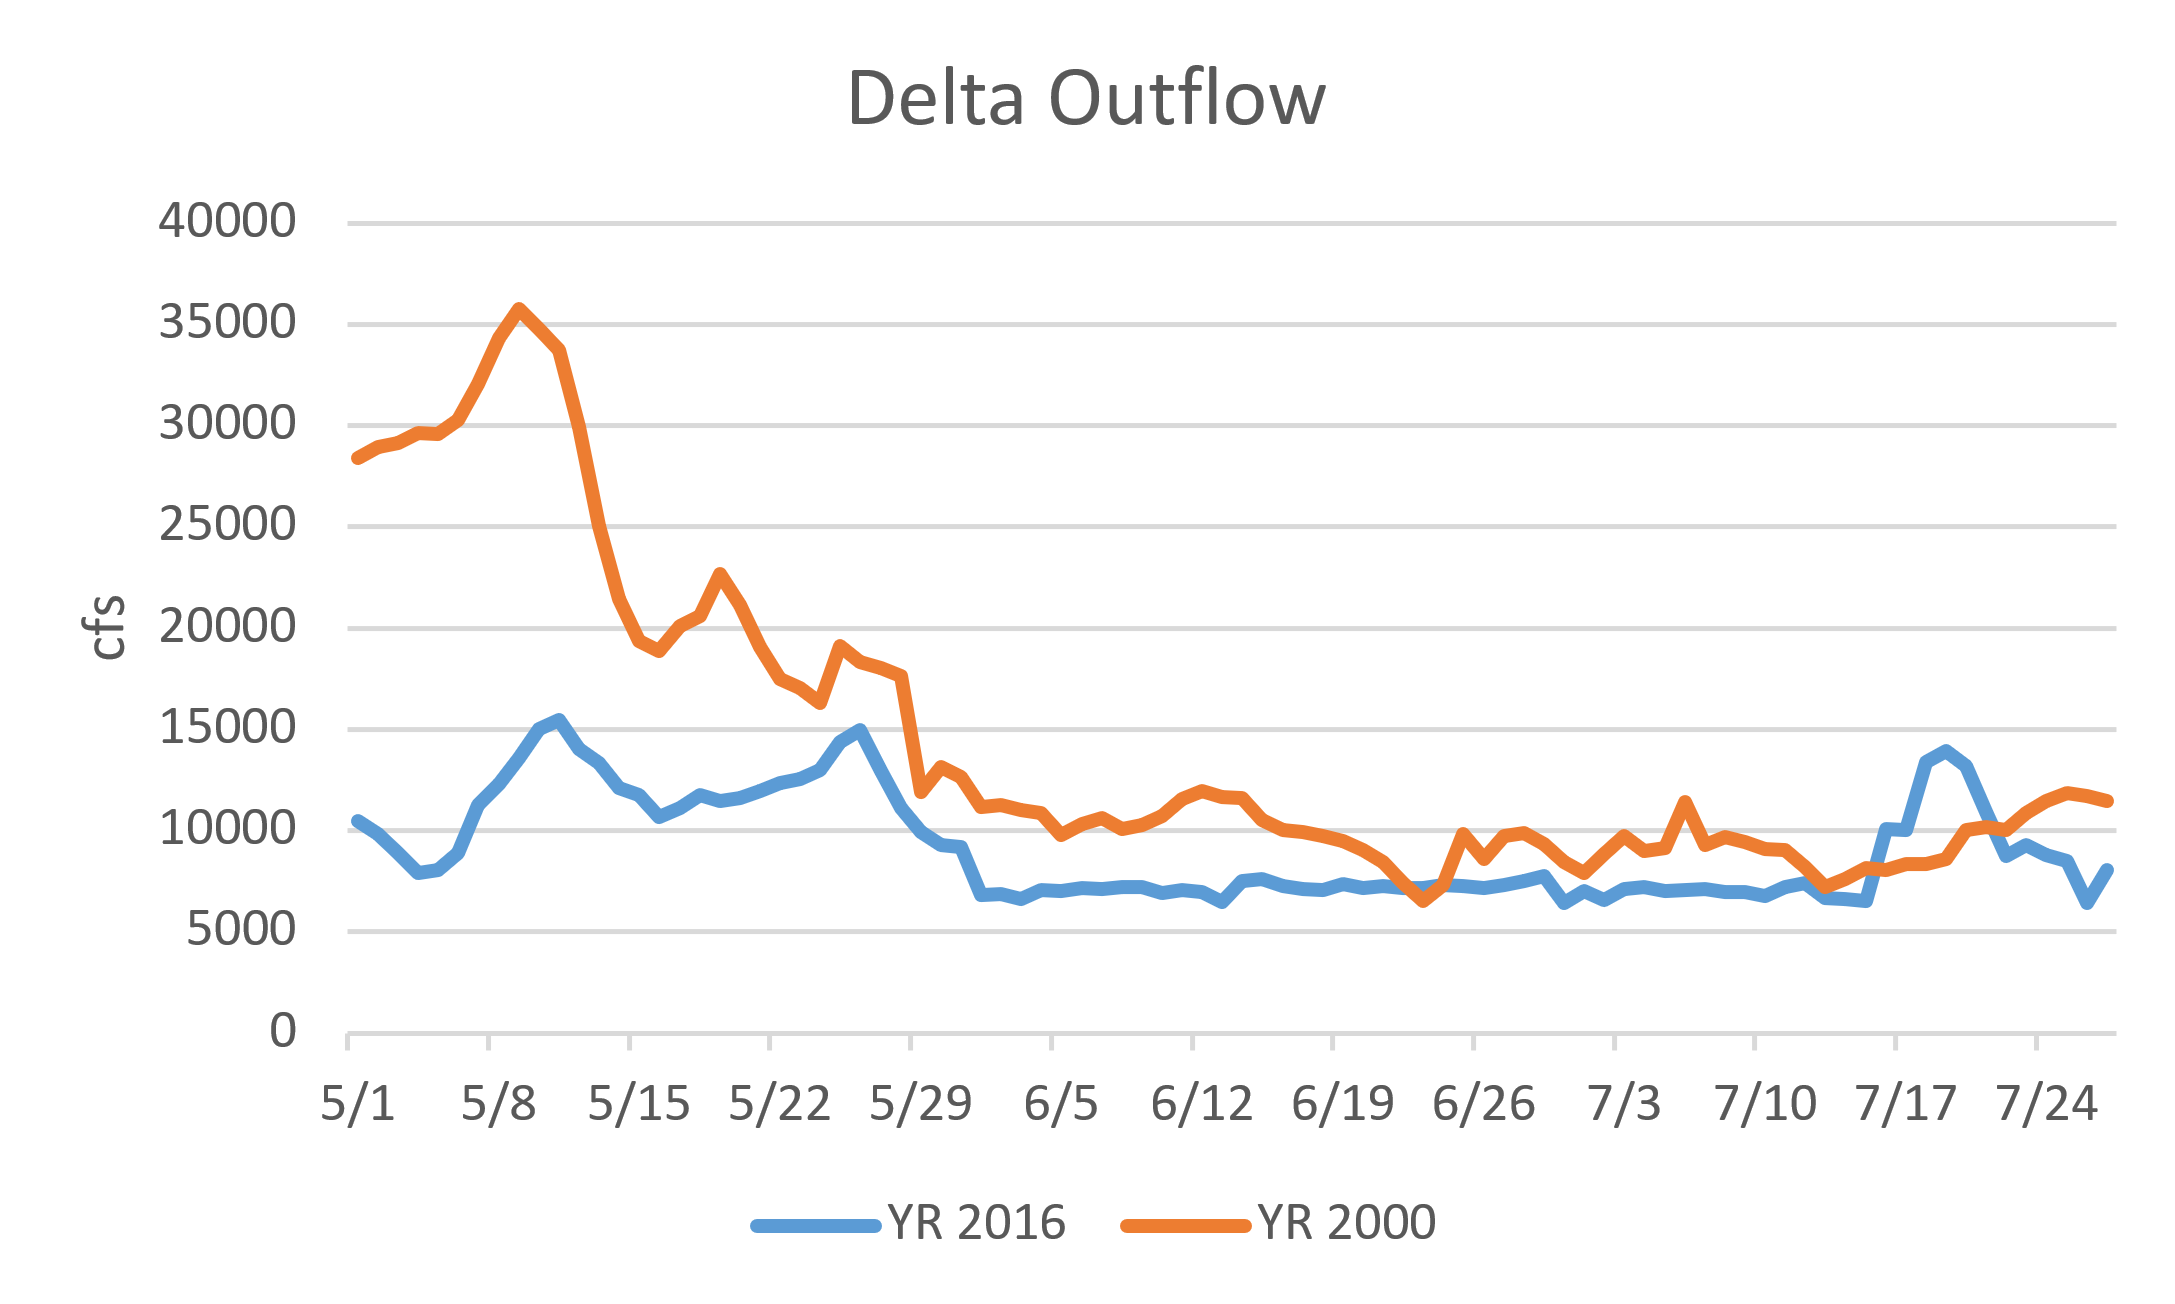
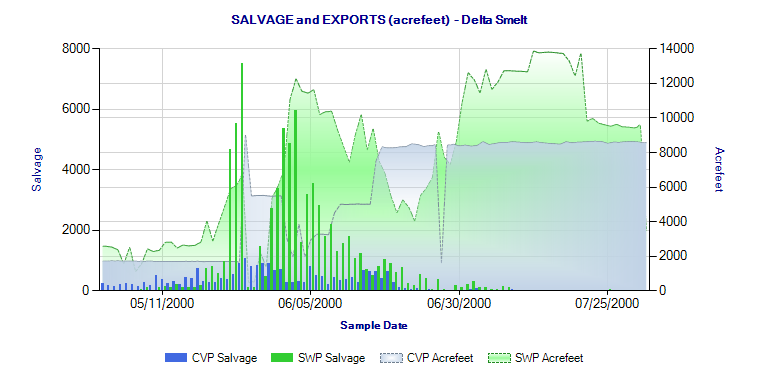
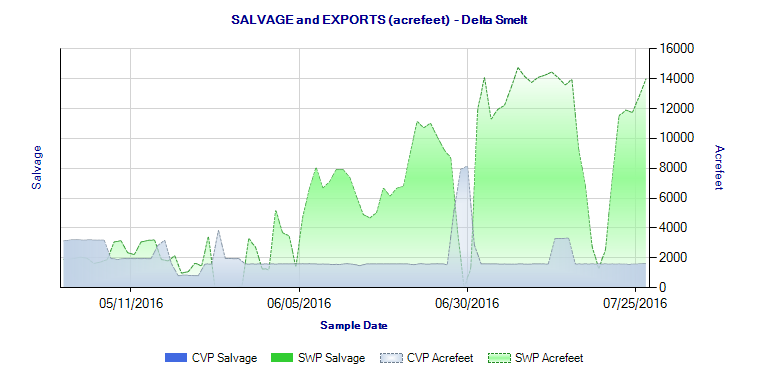
As it turned out, the two experiments were timed together, probably to complement one another. Colusa Basin Drain flows increased in mid-July in Experiment 2 via diversion from GCID intakes at Hamilton City (Figure 1). Delta outflow (Figure 2) was increased in Experiment 1 by reducing Delta exports on July 15. Flow through the Yolo Bypass was increased (Figure 3) by closing the Knights Landing Outfall Gates from the Colusa Basin Drain to the Sacramento River and routing the flow through the Knights Landing Ridge Cut to the upper Yolo Bypass on down to Cache Slough and the North Delta (see route in Figure 1). Net flow through lower Cache Slough (Figure 4) increased from the combined effect of the higher flow in Yolo Bypass and the increased flow through Miners Slough and Steamboat Slough that resulted from reduced exports.
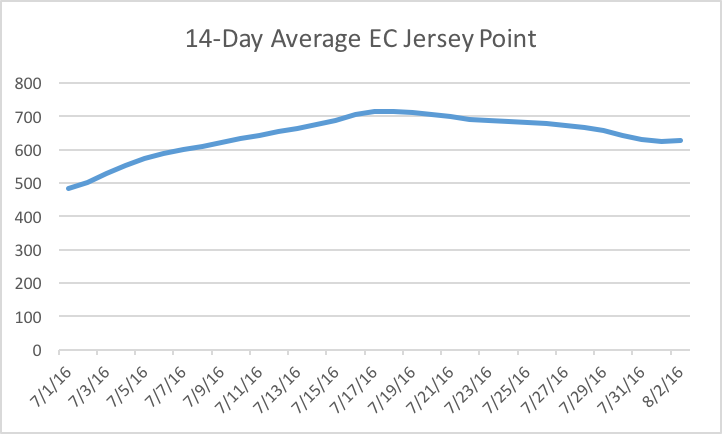
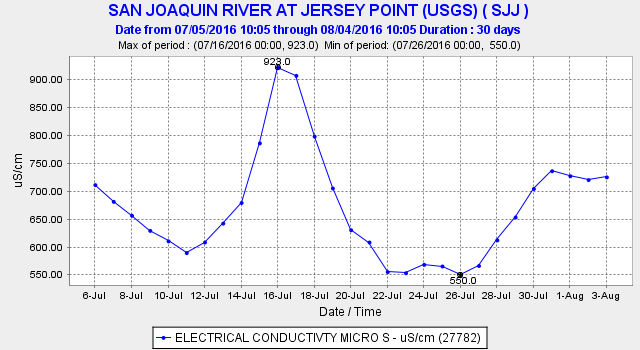
So is Experiment 2 having the desired effects? Water temperature in the upper and lower Bypass continue close to the 80°F mark due to high summer air temperatures, although the water temperature in the lower Bypass’s Tule Canal has been measurably higher than that in the adjacent Ship Channel (Figure 5). The higher flow in the Tule Canal likely carries a high organic load as is evident in the low night-time dissolved oxygen levels of 3 to 5 mg/l (Figure 6). Concentrations of salts (Figure 7) and organic matter (Figure 8) increase in the lower Bypass with higher flow. Plankton productivity as measured by chlorophyll levels in the lower Sacramento River channel at Rio Vista immediately below Cache Slough, though low (<10 micro-grams per liter), shows signs of increasing (Figure 9). However, several miles downstream in the channel at Sherman Island, there has been no sign of an increase in plankton (Figure 10). If an increase is indeed real, it is not clear if it is being caused by the higher Delta outflow, lower Delta exports, higher flow in the Bypass, or some combination thereof.
All in all, the warm nutrient- and organic-laden 500-600 cfs of water from the Colusa Basin agricultural drain moving down the Bypass appears to reach the tidal lower Bypass/Cache Slough complex. There, it mixes with higher net and tidal flows of Cache Slough and the Sacramento River. With 80,000 to 100,000 cfs going back and forth during the twice daily tide cycle between Cache Slough and Rio Vista, the Colusa Basin water from the Yolo Bypass is quickly mixed, and its signature is lost. The key question: is there sufficient “fertilizer” and extra plankton in this foreign water to stimulate plankton food production in the lower Yolo Bypass, Cache Slough and the north Delta to benefit Delta smelt? A reduction in river flow at Hamilton City from Experiment 2 might be considered an impact to Sacramento River fish unless additional water is specifically released from Shasta Reservoir for the experiment, or unless GCID water contractors forgo use of a portion of their allocated diversion at Hamilton City.
At a minimum, Experiment 2 has proved the efficacy of an action that might be even more effective from late fall to early spring when water used to stimulate plankton production in the Delta would augment the benefits of cooler, higher flows in the Sacramento River.
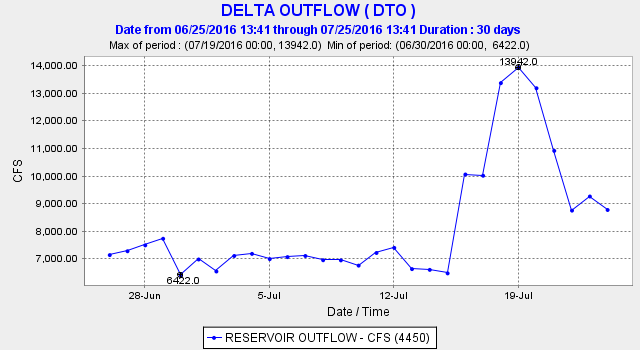
Figure 2. Delta outflow July 2016.
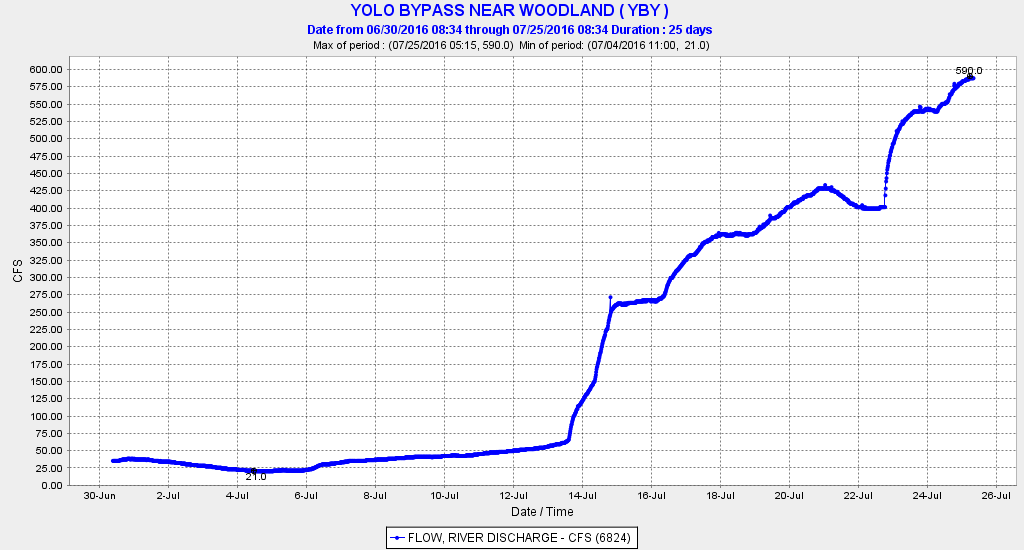
Figure 3. Flow in the upper Yolo Bypass near Woodland July 2016.
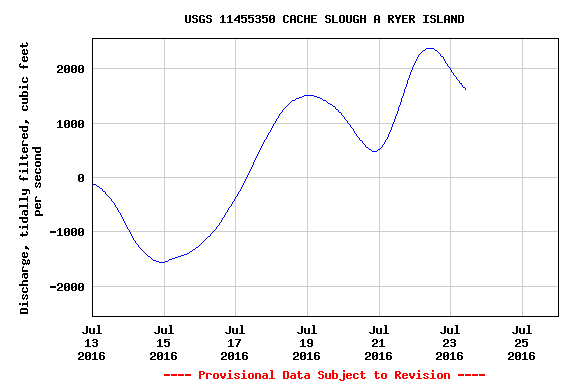
Figure 4. Net tidally filtered flow in lower Cache Slough July 2016.
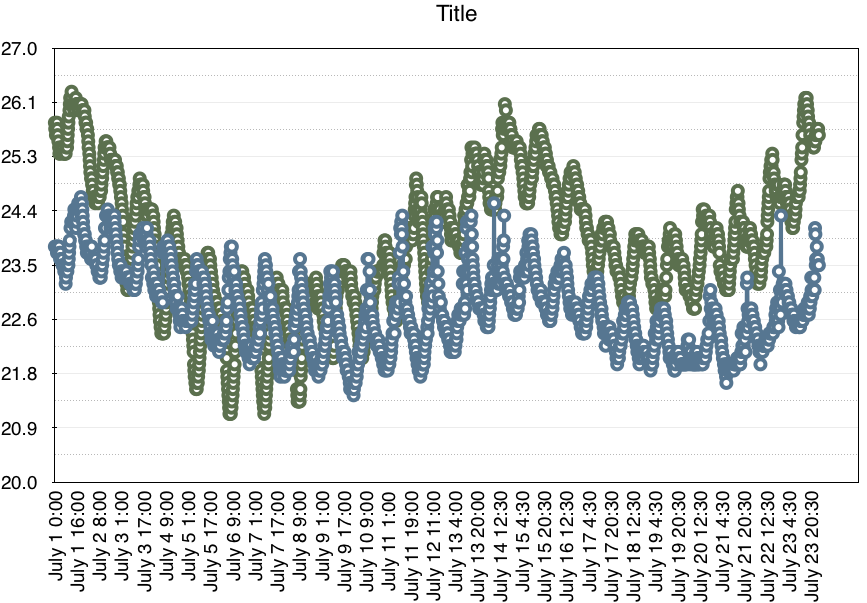
Figure 5. Water temperature at adjacent stations in the lower Bypass Tule Canal (GREEN) and Ship Channel (BLUE) during July 2016.
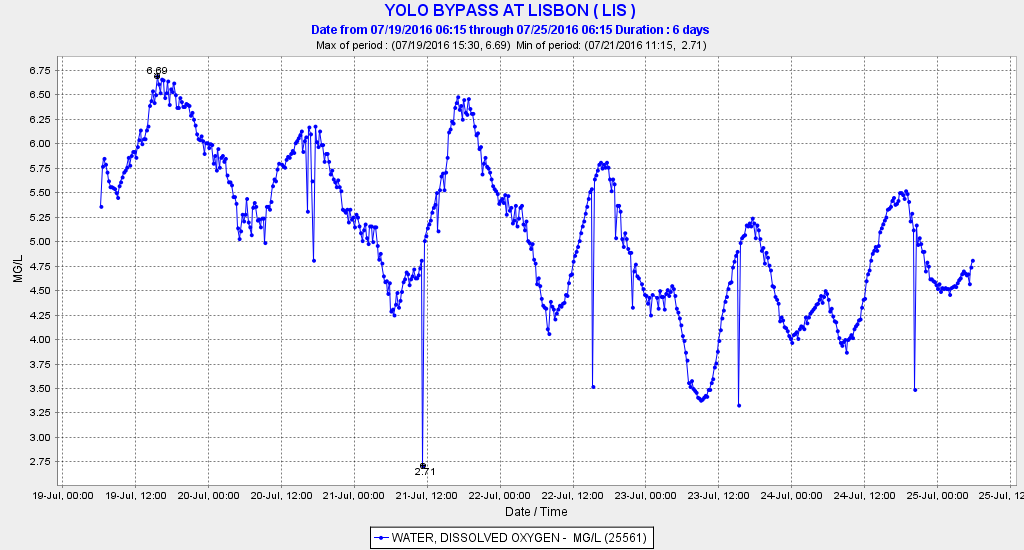
Figure 6. Dissolved oxygen level in the Yolo Bypass Tule Canal at Lisbon 19-25 July 2016.
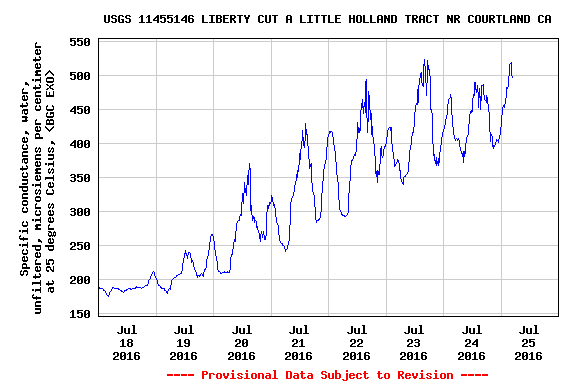
Figure 7. Specific conductance of water in the lower Yolo Bypass at Liberty Cut late July 2016.
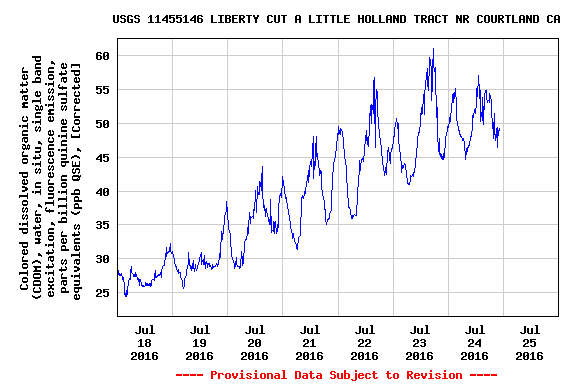
Figure 8. Concentration of dissolved organic matter in lower Yolo Bypass at Liberty Cut late July 2016.
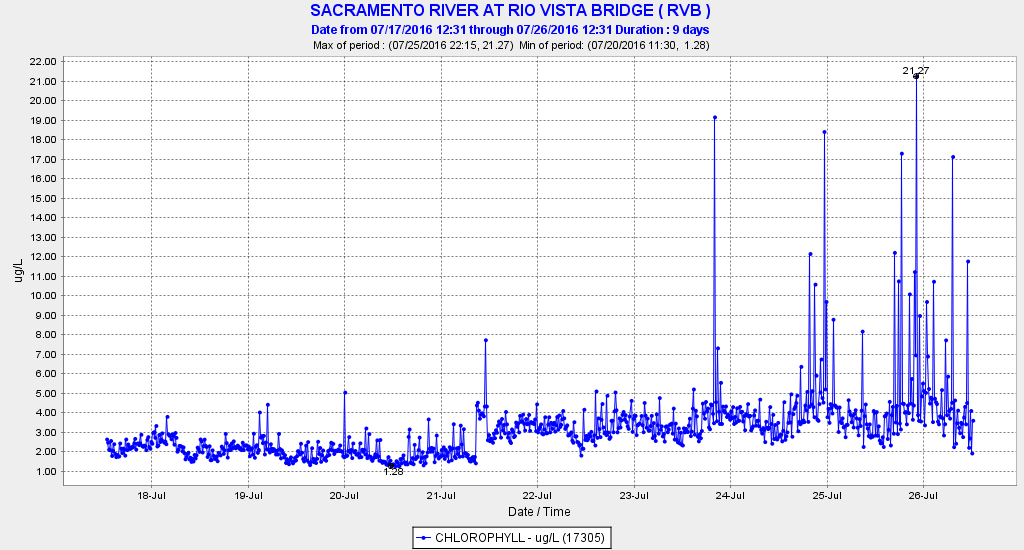
Figure 9. Chlorophyll concentrations in the lower Sacramento River in north Delta at Rio Vista 18-28 July 2016.
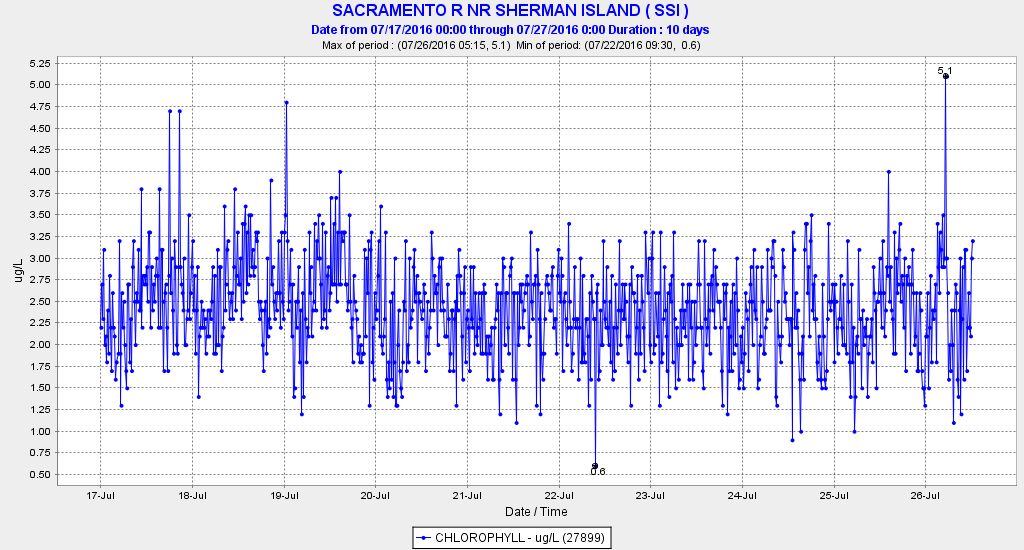
Figure 10. Chlorophyll concentrations in the lower Sacramento River in north Delta at Sherman Island 17-28 July 2016.