I have been analyzing the declines in Bay-Delta and Central Valley fish populations for over 40 years. Fish population dynamics were the focus of my college education and my 50-year career in environmental impact assessment. I have participated in all the major efforts to understand the Bay-Delta fish population declines. From all of these efforts, it is clear to me what has caused the major fish population crashes.
Pre-1970
First and foremost are the well known historic factors, the original sins pre-1970s of diverting water, building levees and dams, urban development, gold mining, cutting forests, polluting rivers, over-fishing, and introducing non-native species. These explain many of the major native fish population declines and extinctions such as the Sacramento perch and San Joaquin spring-run Chinook salmon, and the near extinctions of Delta smelt, green sturgeon, winter-run and spring-run salmon, and steelhead.
Post-1970
Since 1970, there have been dramatic declines in salmon, steelhead, smelt, sturgeon, splittail, and striped bass, often described as “recruitment failure” or failure to reproduce. While some of the blame most certainly is on continuing effects of the aforementioned original sins, the major post-1970 shifts were the consequence of a new array of stresses that hit the whole fish community, especially native fish populations. Most certainly the droughts of 76-77, 87-92, 01-02, 07-09, and 12-15 were a major underlying factor; however, it was the man-made responses to the droughts that caused most of the damage. Asian clam and other non-native aquatic invertebrate invasions to the Bay-Delta in the 80s were another stress, in part brought on by the aforementioned factors. Poor water management response to these new threats has caused further damage. The big culprits of change were the water management stresses described below.
1. State Water Project
The addition of the State Water Project (SWP) in the mid-1970s nearly tripled Delta export capacity (4400 to 11,400 cfs pumping rate) and annual exports (2 million acre-feet to 6 million acre-feet annual exports). The additional Delta exports had huge fish population effects in the mid-70s from salvage mortality and entrainment of young fishes, as well as on fish habitat conditions in the rivers, Delta, and Bay. These stresses resulted in major population declines, which in turn resulted in the imposition of export restrictions in new water quality standards in 1978 (D-1485), and eventually to species listings under the Endangered Species Act in the 1990s.
2. Reservoir Operations
The increase in exports changed reservoir operations, including within-year reservoir release strategies and long-term multiyear reservoir storage patterns. Reservoir storage was depleted faster in droughts because of higher water supply demands. These effects continue today.
3. Water Supply Demands
Ever-increasing water supply demands from agricultural and municipal users have reduced river flows, Delta outflow, and reservoir storage. It’s not only the Delta’s 6 million acre-feet of exports, but the more than 20 million acre-feet from other Central Valley water diversions.
4. Invasive Species
Invasions of non-native clams, shrimp, fish, and zooplankton species since the 1970s have occurred in-part due to changes in Bay-Delta hydrology and water quality, as well as physical and biological habitat conditions. Delta pelagic (open water) habitat is now dominated by low-productivity reservoir water. The low salinity or mixing zone of the estuary became far less productive because of species invasions and reservoir water moving through to the south Delta export facilities, taking productive low-salinity habitat with it. The Delta is warmer from higher warm river inflows from spring through fall to feed water project exports, further favoring non-native warm-water fishes. Turbidity is lower, favoring non-natives. Invasive aquatic vegetation benefits from low turbidity, and the vegetation further favors non-native fishes over native fishes.
Post-1990
Since 1990, there have been steps backward that have undermined effective strategies and actions that had been undertaken beginning in the late 1970s to help depressed fish populations. Below are five examples in a long list of actions/changes.
1. Changes to D-1485
Beginning In 1978, Delta water quality standards in Decision 1485 placed restrictions on Delta exports, improved Delta outflows, and set salinity standards that had benefits for native fishes. Beginning in the 1990s, these post-1970 constraints on water diversions were changed, ignored, or eliminated. For example, new standards in D-1641 (1995 Accord) dropped the D-1485 June-July export restrictions.
2. Eliminating VAMP Export Restrictions and Higher Outflow Requirements in April and May
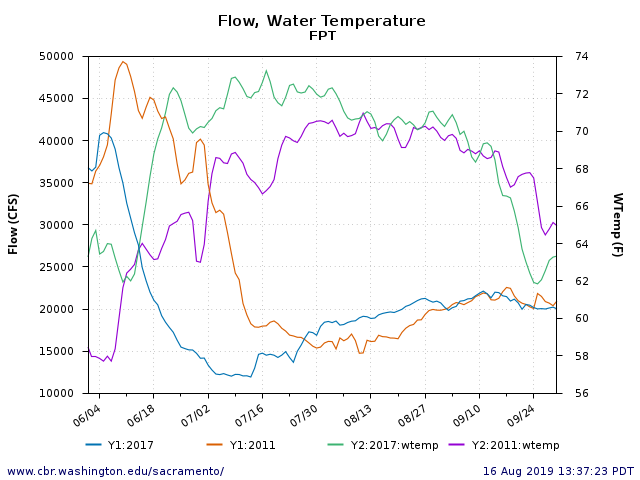
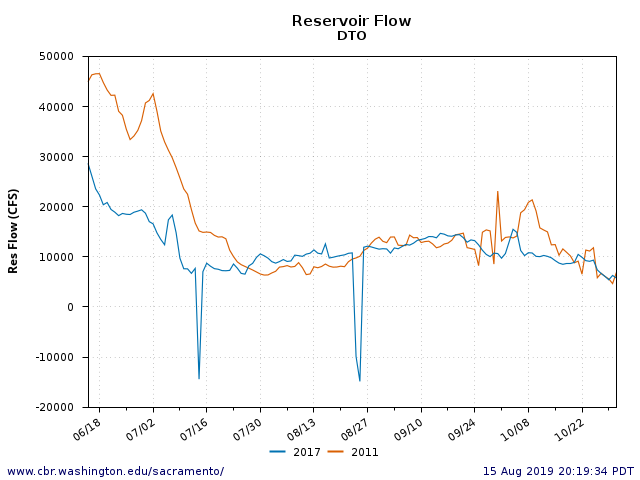
The Vernalis Adaptive Management Plan (VAMP) from 2000-2009, and its operational precursors under the CVPIA (1991) and the 1995 Accord, sought to protect Central Valley salmon and Delta native fishes by reducing April-May Delta exports and increasing spring Delta inflows and outflows. During the VAMP years, exports were restricted to less than 2000 cfs in April-May to protect fish (Figure 1). In the post-VAMP decade, restrictions were lifted and exports increased, especially in post-drought recovery wet years 2011 and 2017 (Figure 2).
3. Temporary Urgency Change Petitions (TUCPs) and Orders
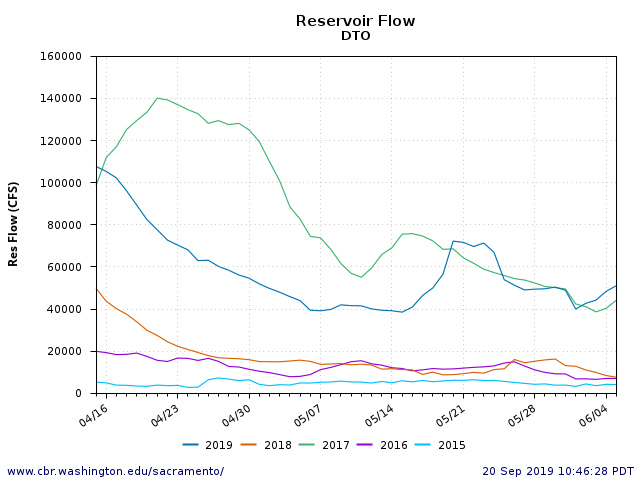
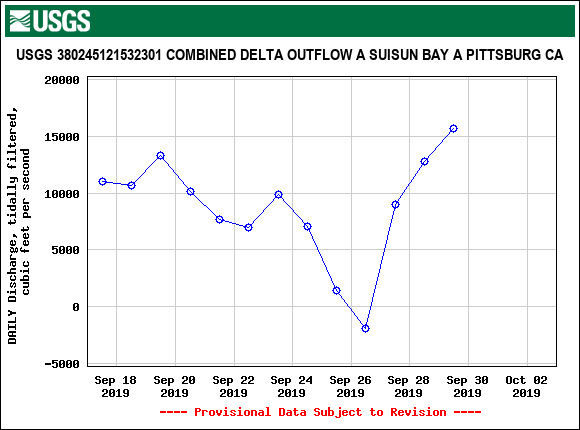
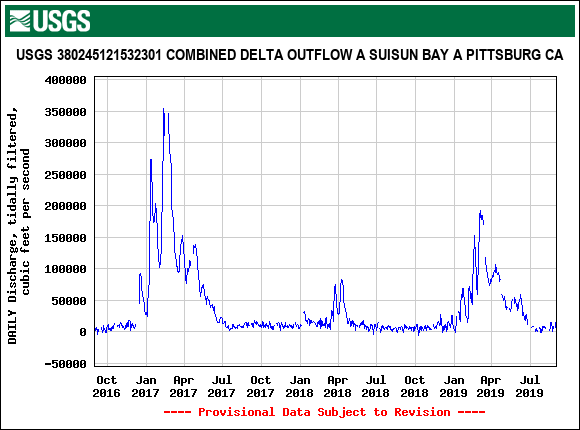
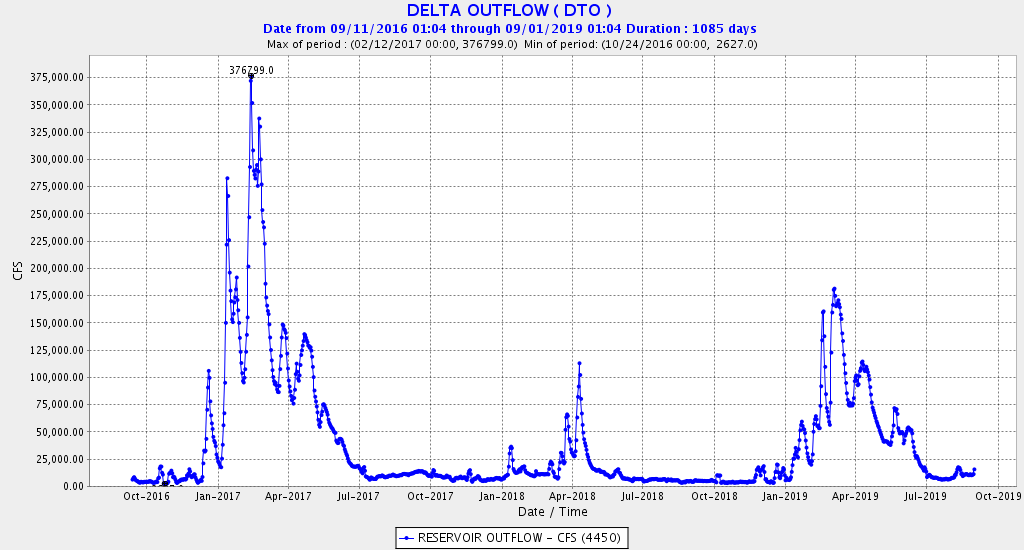
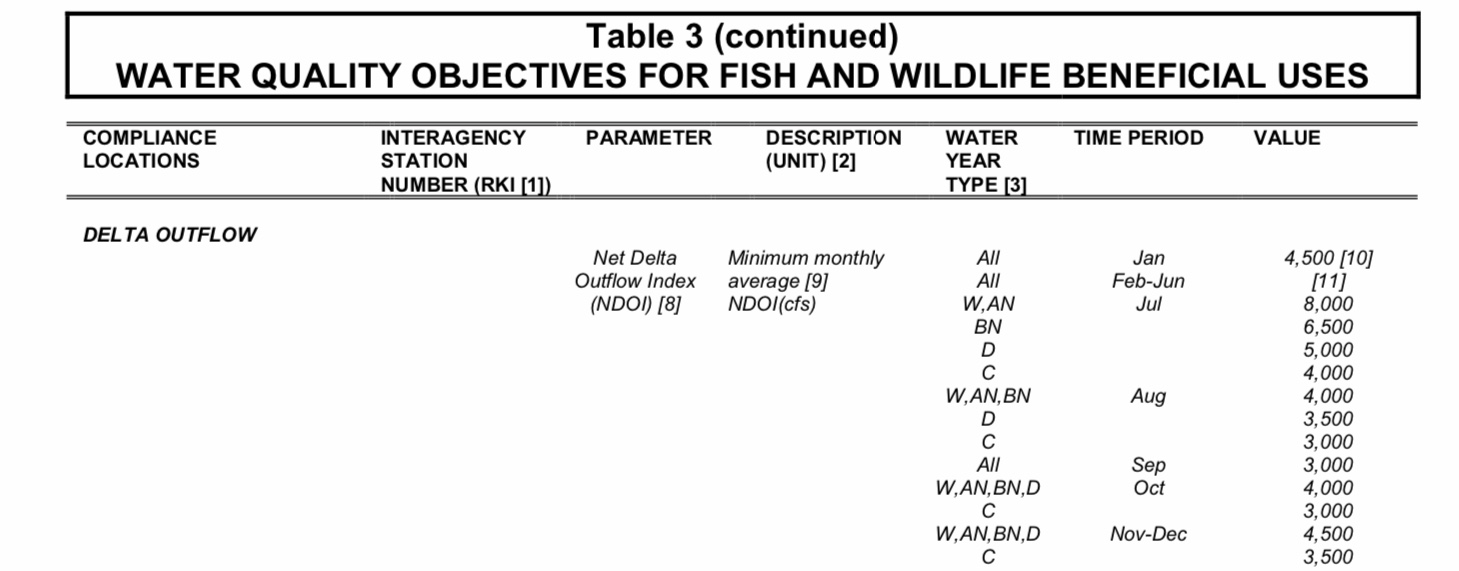
Temporary urgency change orders during the recent drought allowed April-May Delta outflow to fall to around 5000 cfs in 2014 and 2015, from the normal near-10,000 cfs lower limit (Figure 3). Such low outflows in combination with Delta exports are devastating to Delta native fishes and Central Valley salmon and steelhead.
4. Delta Channel Barriers
The operation of the Delta Cross Channel, Head of Old River, South Delta, and False River barriers helps to keep export salinity down by funneling the fresher Sacramento River water to the south Delta export pumps. This increases the efficiency of exports in taking reservoir water in drier years and seasons. With the exception of the Head of Old River, barrier operation also funnels Delta native fish production (pelagic eggs and juveniles) and migrating young salmon (and their low salinity habitat and food sources) directly to the export pumps instead of to the Bay.
5. Suisun Marsh Salinity Control Gates
Since the installation of the Suisun Marsh Salinity Control Gates (SMSCG) in Montezuma Slough in 1989, the Slough and Marsh no longer function as critical low salinity habitat in drier years and seasons. Without high freshwater inflow, the Slough and Marsh no longer maintain the high biological production the once contributed to the Bay. The following excerpt from a DWR 2019 blog post inadvertently describes how limited the benefits of Suisun Marsh have become in the absence of flow:
DWR launched a pilot project last year that directed more fresh water flow into Suisun Marsh. The action involved opening salinity control gates in the summer months instead of during fall and winter, as is customarily done to reduce salinity in the marsh for migrating ducks and other waterfowl. The Delta smelt relies on low-salinity water – opening the salinity control gates allowed the smelt to enter the marsh from the Sacramento River, where it can access greater amounts of food and shelter.
Extinction looms so closely over the Delta smelt population that the project could have been considered a success even if it didn’t lure any countable Delta smelt to the marsh, said DWR Lead Scientist Ted Sommer. Just creating the conditions that allow smelt to thrive – that is, low salinity levels, lots of food, and high turbidity or muddy water that magnetizes smelt – would have been a cause for celebration.
Conclusion
There are many, many other examples of adverse changes that have put fish population dynamics in the Delta in a perpetual downward spiral. Since 1970, almost of all them involve reduction of Delta inflow and outflow, elimination of measures to mitigate the effects of reduced Delta inflow and outflow, and/or the biological response to reduced Delta inflow and outflow.
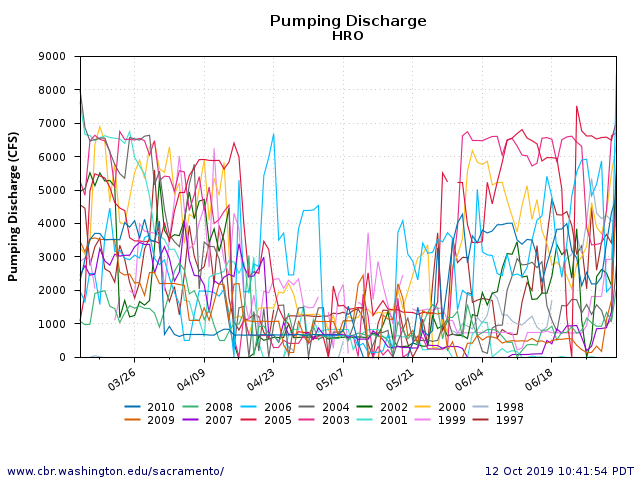
Figure 1. State south Delta exports (Harvey Banks pumping plant) in spring 1997-2010.
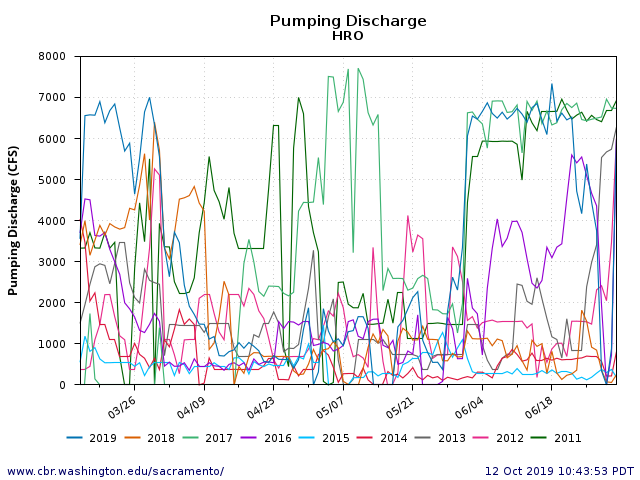
Figure 2. State south Delta exports (Harvey Banks pumping plant) in spring 2011-2019.
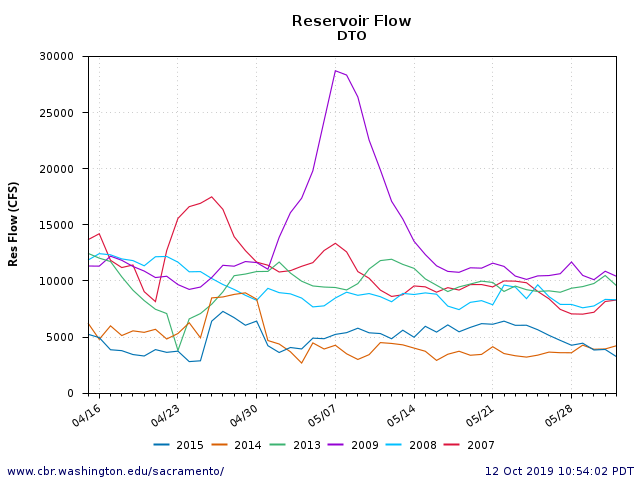
Figure 3. Delta outflow April-May 2007-2009 and 2013-2015 droughts.