Nearly everyone supports the concept of restoring salmon and their habitats within the existing geographic range of the Central Valley. But why is it so difficult to implement relatively low-cost, simple actions that would unquestionably benefit salmon? The following is a recent example of the problem and its ultimate, surprising solution.
In 1986, a colleague (Dick Painter) with the Department of Fish and Game [now Department of Fish and Wildlife (DFW)], through a lot of planning and hard work, created an excellent salmon habitat project in a side channel on the main stem Sacramento River in Redding, California. Many years later, I named this area “Painter’s Riffle” in recognition of the dedicated biologist. The modified channel worked well for many years but, inevitably, the habitat quality diminished due to lack of fresh gravel replenishment that would have been historically provided from upstream areas prior to construction of Shasta and Keswick dams. Nevertheless, the area proved beneficial for 25 years by being hydraulically connected to the main river and provided habitats for the river’s four runs of salmon and steelhead. This circumstance changed dramatically after the City of Redding widened the Highway 44/299 Bridge spanning the Sacramento River just upstream of Painter’s Riffle. As is now usual and customary for such in-river projects, DFW required the bridge contractor to lay clean spawning gravels in the riverbed (amounting to 20,000 cubic yards) as a platform to commence work. The concept being, after the bridge project was complete, high reservoir releases from Shasta Dam would eventually wash those gravels downstream and contribute to new salmon spawning areas. The strategy worked … somewhat. The gravel mobilized en masse during March of 2011 when Shasta Reservoir went into flood-control releases and 50,000 cubic feet per second surged into the river below Keswick Dam. The gravels placed under the highway project flushed downstream, but left 8,000 cubic yards in the channel’s entrance, forever plugging Painter’s Riffle.
In early February 2013, while driving across the new Highway 44/299 Bridge, I looked downstream and could readily see what had happened — Painter’s Riffle had been hydraulically disconnected from the river. I drove to the site (a City of Redding municipal park) to take some photographs and measurements. That night, I wrote a Proposal to restore the site to its original ecological function and presented the concept to the City of Redding, obtaining its support. However, when I met with DFW representatives (including a “Habitat Restoration Coordinator”) to garner the agency’s support, you would have thought I’d wacked a hornet’s nest! My read on the less-than-enthusiastic response was that any “outsider” involvement and alternative scientific perspectives in their internal plans for salmon restoration were unwelcomed. This was revealed months after my original Painter’s Riffle proposal when a radically different proposal for the site surfaced and was sanctioned by the fish agencies. They recommended slicing a 10-foot wide trench through the same side channel and only allowing it to function at flows above 10,000 cfs, instead of my submittal which recommended the channel perform at 3,250 cfs, or the minimum reservoir releases. In my written response to the agencies’ proposal, I explained that winter-run Chinook salmon redds would become stranded and eggs would perish in the side channel if the fish spawned during normal flows above 10,000 cfs (among many other problems). After many months of valuable time lost, logical minds prevailed and the agencies’ proposal was quietly removed from consideration.
To gain momentum, the project needed an advocate and was proposed to the Golden Gate Salmon Association’s (GGSA Interview) Task Force which includes the three fish agencies: DFW, USFWS, & the National Marine Fisheries Service (NMFS). DFW & NMFS representatives were contemplatively silent, but a USFWS representative asserted he had already looked at the site and the gravels appeared to be too large for suitable salmon spawning (paradoxically, in direct conflict with DFW’s in-river project gravel requirements). The effort was rapidly dying on the vine and, without badly-needed support, GGSA was forced to put the proposal on the back burner.
Trying a different venue, the project was presented to northern California water districts. Surprisingly, the Glenn-Colusa Irrigation District (GCID), located nearly 100 river miles downstream of Painter’s Riffle said they would champion the cause (aka, do the on-the-ground work). At this point, with the winds shifting once again in the salmon’s favor, GGSA went to the U.S. Bureau of Reclamation (USBR) and requested their staff to take the task on as part of GGSA’s Salmon Plan. They were successful. Although it was still 2013, the reality of the extensive regulatory permitting hurdles forced USBR staff to eventually concede that it would be impossible to implement the project until the following year, even though low river flows (Shasta Reservoir releases) due to the severe drought would have provided perfect conditions for construction. Regrettably, the salmon would have to wait until the fall of 2014.
As anticipated from long-range weather forecasts, the heavy rains never arrived during the winter of 2013-2014, but the meetings, conference calls, and draft environmental documents on the proposed Painter’s Riffle project came on like a deluge. The scales were now tipping against restoration. In fact, except for GCID, USBR, and GGSA, it seemed no fish entity would formally support the project. For example, the USFWS suggested “pre-project monitoring” be conducted at the sealed-off side channel before any gravel was moved, perhaps for many years. Undefined “concerns” were voiced about effects on threatened and endangered fish, but without remedial recommendations and recognition of the benefits. With this much resistance, it seemed as though we were proposing to build a new waste-water treatment plant on the river that would spew raw sewage into the middle of prime salmon habitats. The quagmires of state and federal bureaucracies were sucking the enthusiasm for the restoration effort down into the black hole of oblivion. Nevertheless, after numerous speed bumps in the process and a seemingly endless series of meetings and conference calls, the log jam broke and key pragmatic agency individuals came on board with the project.
Now, at this late date, with renewed zeal, a Herculean effort was set in motion by USBR and GCID staff who worked overtime to update and finalize the numerous regulatory permits to implement the project in the fall of 2014. But wait, not so fast! This simple project almost came to a screeching halt when Endangered Species Act restrictions nearly imposed insurmountable obstacles to conduct the in-river work. At the 11th hour, several knowledgeable, rational DFW biologists stepped up to the plate and delivered on all fronts with support, cooperation, and assistance resulting in NMFS allowing the work to proceed.
Once NMFS gave its blessing, the field implementation to restore Painter’s Riffle went into overdrive because of advanced planning and the due diligence of highly experienced GCID heavy equipment operators. Two massive front-end loaders, a D-6 cat bulldozer, and an excavator simultaneously went into close-quarter action. Their execution was well choreographed with all four earth-moving machines weaving up and down and across Painter’s Riffle. Each operator knew the movements of others through radio communication, hand signals, or most often, years of experience in skilled operation of the machines. It was mesmerizing to watch the quick transformation of the river channel: Video of Equipment in Action
With everything going smoothly and swiftly, Mother Nature had another plan. One of the largest storms to hit northern California in years (ironically, in a fourth-consecutive drought year) slammed into the area during the two weeks of construction. With heavy rains and winds pummeling the equipment crew, they relentlessly proceeded nonstop during permitted hours. And, to be sure, this was no ordinary storm. The so-called “Atmospheric River” or “Pineapple Express” parked itself on top of Redding for an extended period and localized flooding was reported everywhere. Caltrans even made an emergency stop at the job site to clear plugged culverts spewing heavy rain runoff in the municipal park. Although Shasta Reservoir was extremely low due to the three prior years of drought, the downstream re-regulating Keswick Dam suddenly had to increase water releases due to localized flooding concerns in the vicinity of the dam. River flows at the construction site increased dramatically, jeopardizing the work in progress … but the crew diligently kept on working and completed the project ahead of schedule and below budget.
Ultimately, all involved agencies, groups, and individuals praised the project and the unprecedented collaboration. The finished product is anticipated to benefit the Sacramento River’s four runs of Chinook salmon and steelhead. As a result, new salmon restoration projects are planned for implementation this and next year … using more-active stakeholder involvement and “outsiders” perspectives. Perhaps there is hope for salmon after all: Video of Completed Project
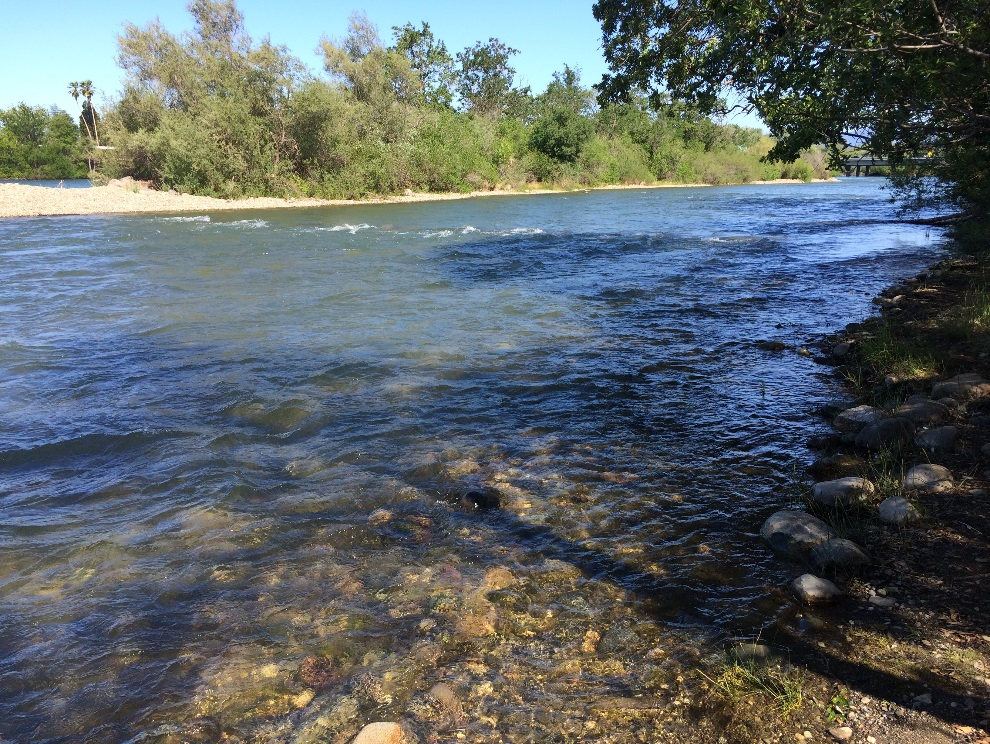
The completed Painter’s Riffle Project.