Common sense says salmon recovery efforts should focus on the most important factors that control fish population dynamics. In reviewing Central Valley population dynamics, I have seen each life stage and each individual controlling factor become important at one time or another. In my experience, the estuarine rearing and migrating stage is an essential component that is not given enough attention.
Central Valley salmon populations are nearly all “ocean-type” Chinook salmon, meaning they move to the ocean usually during their first six months of life, with substantial estuary rearing as fry, fingerlings, and pre-smolts. That is not to say that yearling smolts contributions are not important. It is that they are a minor contribution in “ocean-type” Chinook (note that late-fall-run are “river-type”).
I have always believed the survival of wild salmon fry in the Bay-Delta to be a key limiting factor in wild salmon production in the Central Valley. Hatcheries have kept smolt numbers to the ocean up, while the survival of wild salmon eggs, fry, fingerlings, and smolts has worsened. Fry-fingerling estuary survival is important, if only in the sense of sheer numbers and the resulting potential to increase overall smolt production. This is true for fall-run, spring-run, and winter-run populations. There is substantial evidence that returning wild adult salmon are predominantly from the estuarine-reared groups. Such evidence exists from fish surveys, scale analyses, and genetic studies. Thus, a recovery program for wild salmon should include a strong focus on estuarine rearing and survival.
My beliefs are shaped in large part from my personal experiences in conducting winter seine and screw trap surveys throughout the Bay-Delta and lower rivers. Young wild salmon classified as fry and fingerlings, 30-50 mm (1-2 inches), dominate the inshore landscape and screw trap collections. Millions of fry and fingerlings pour out of the spawning rivers and tributaries into the main rivers and into the Delta, where they dominate the winter fish community. Larger, more elusive pre-smolts, mostly winter-run, are also present in smaller numbers, but in numbers important to the winter-run population. Yes, there are millions of fry left to rear in highly regulated and disturbed river habitat, but their overall numbers are fewer, with less potential for ultimate survival to smolts entering the ocean than their estuarine counterparts.
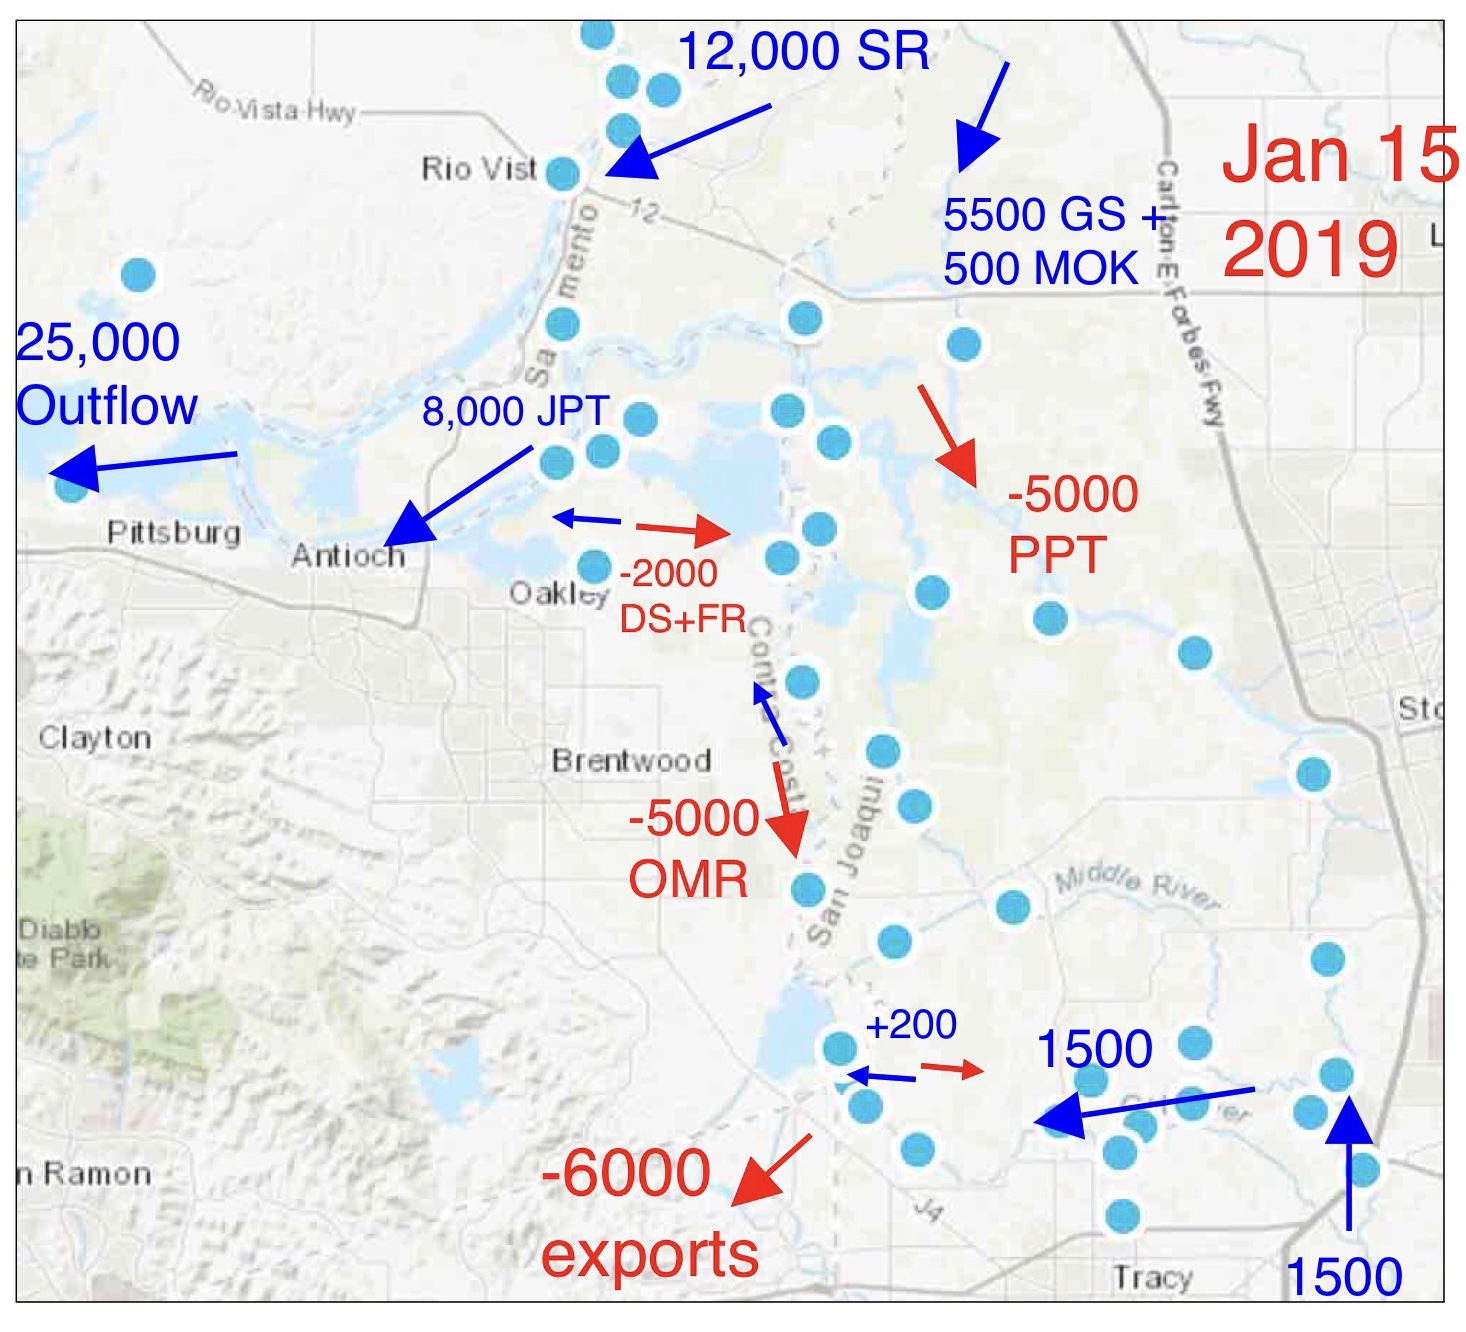
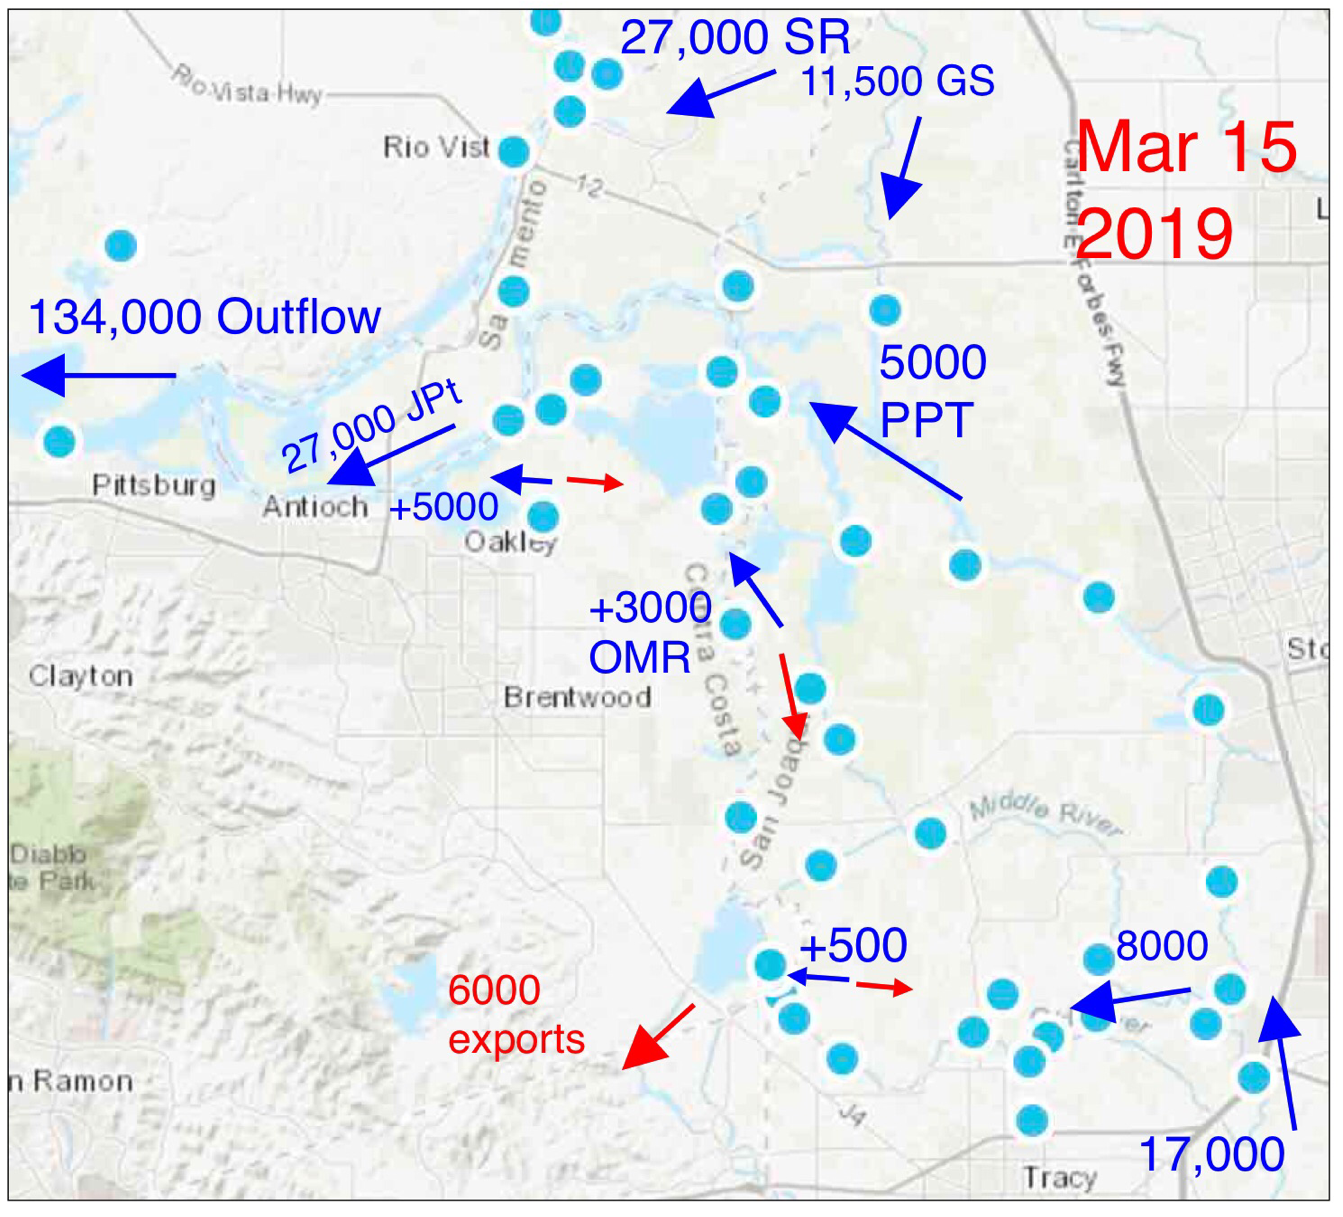
One of the better indicators of the general pattern of estuarine use by salmon is fish salvage collections at the massive federal and state pumping plants in the south Delta. As shown in Figure 1, December is important in the estuary for winter-run and late-fall-run pre-smolts and yearlings, respectively. The January through March period is important for spring-run and fall-run fry/fingerlings. The April through June spring period is important for spring-run and fall-run pre-smolts.
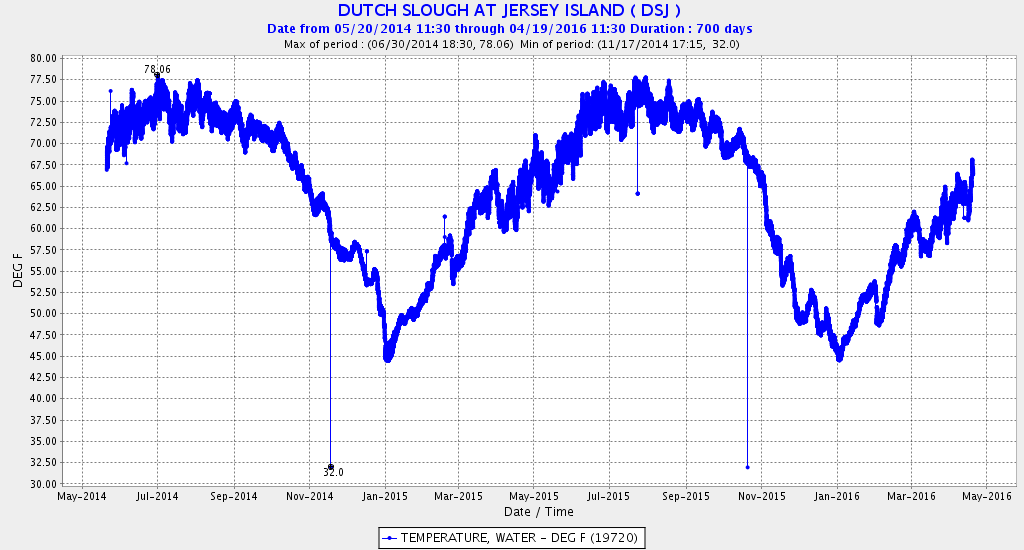
To support juvenile salmon in the estuary, Delta habitat therefore needs protection from December through June. Natural flows and flow direction patterns are important habitat features. Water temperature is important in late spring. Exports affect such habitat, especially in dry, low-flow years.
The State Water Resources Control Board is in the process of revising water quality standards in the Bay-Delta watershed. Salinity, flow, water temperature, and export-limit standards need updates to protect salmon using the Bay-Delta through the winter and spring. Such protections will be key to wild salmon recovery in the Central Valley.
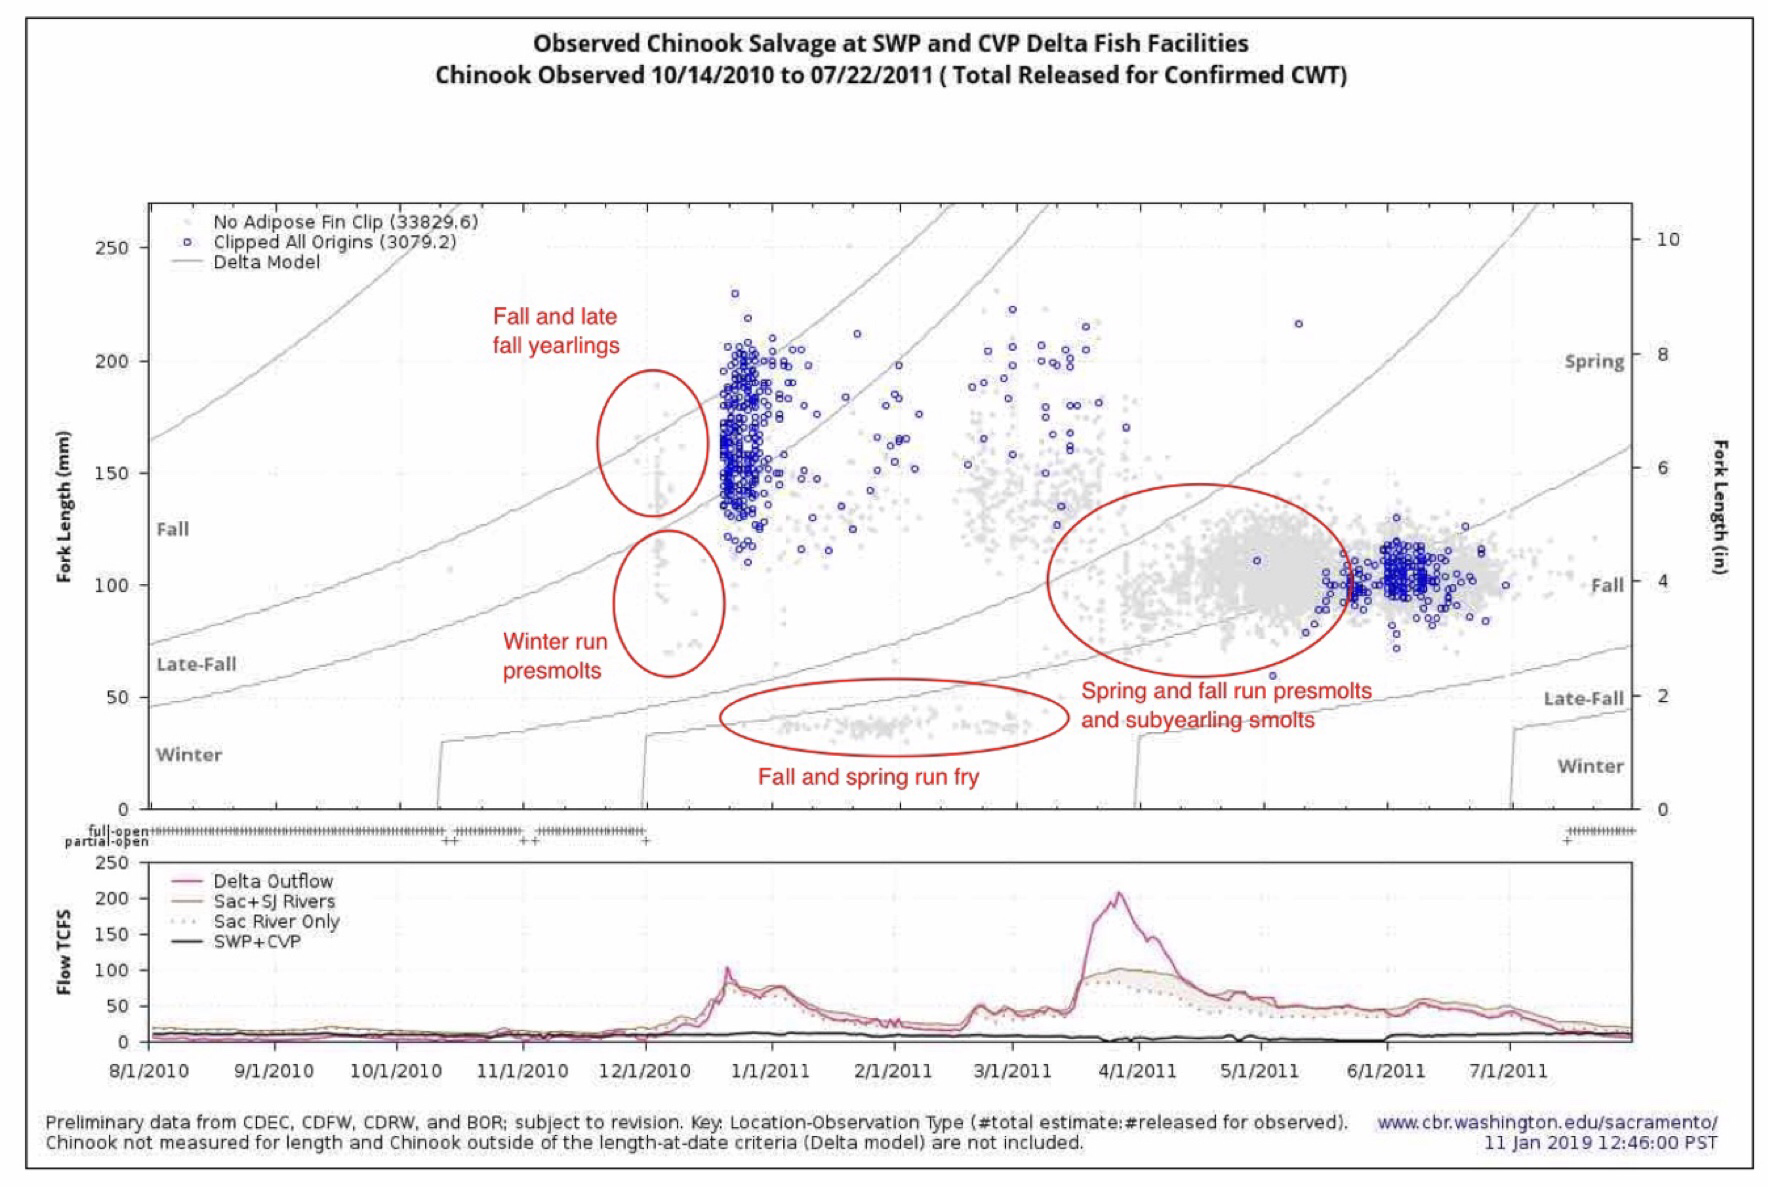
Figure 1. Salmon salvage at south Delta pumping plants in 2011. Note red-outlined groups of predominately wild salmon. Blue dots depict salvage events for hatchery salmon.