The Delta’s Trophic Collapse Explained

A just-released UC Davis Study1 concludes that the decline in the Delta pelagic open water habitat and fishes is strongly related to non-native clam invasions and water exports. This long-held theory now has strong supporting evidence.

“The low pelagic productivity of the SFE [San Francisco Estuary] is considered a primary cause for the low abundance of several resident fish species (Sommer et al. 2007), including the imperiled Delta Smelt (Feyrer et al. 2003; Sommer et al. 2007; Hammock et al. 2017; Hamilton and Murphy 2018).”

In their study paper, the authors reviewed five theories on the decline in estuary productivity:

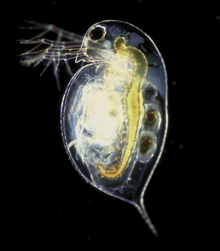
  1. Grazing by invasive clams.
  2. Ammonia inhibition from sewage treatment plants.
  3. Phosphorus limitation
  4. Elevated nitrogen.
  5. Freshwater exports.

The paper concludes there is “a growing consensus that the decline in pelagic fish abundance in the SFE is at least partially due to a trophic cascade, triggered by declining phytoplankton (Feyrer et al. 2003; Sommer et al. 2007; Hammock et al. 2017; Hamilton and Murphy 2018)”.

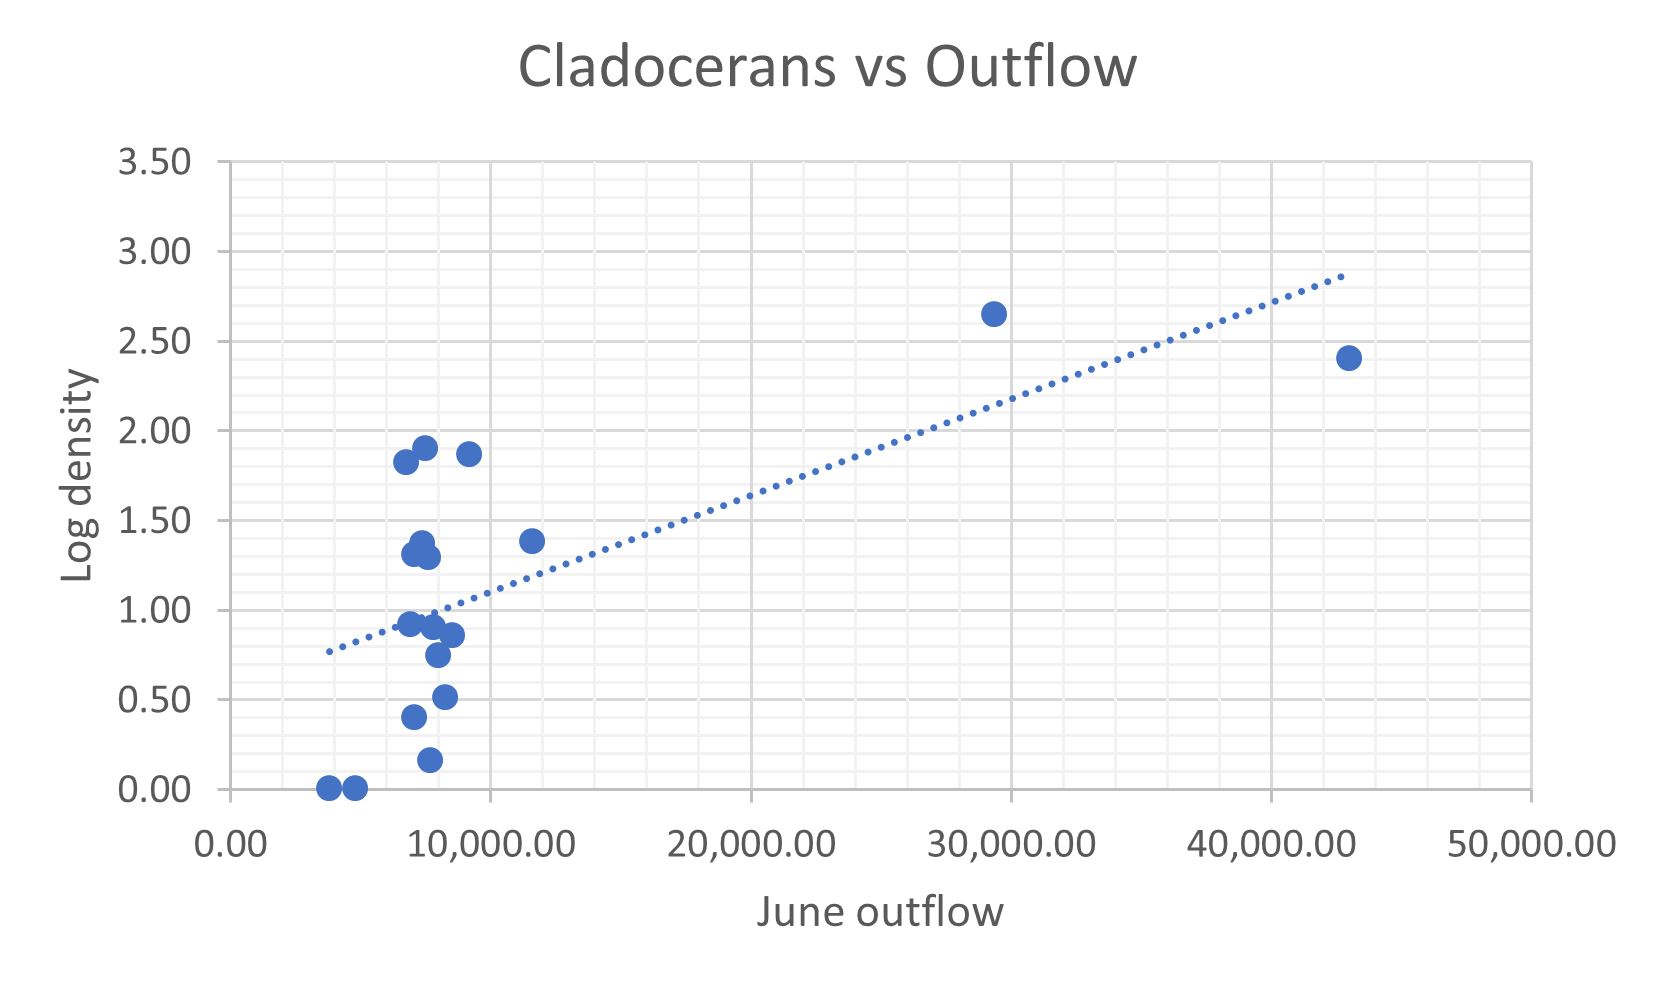
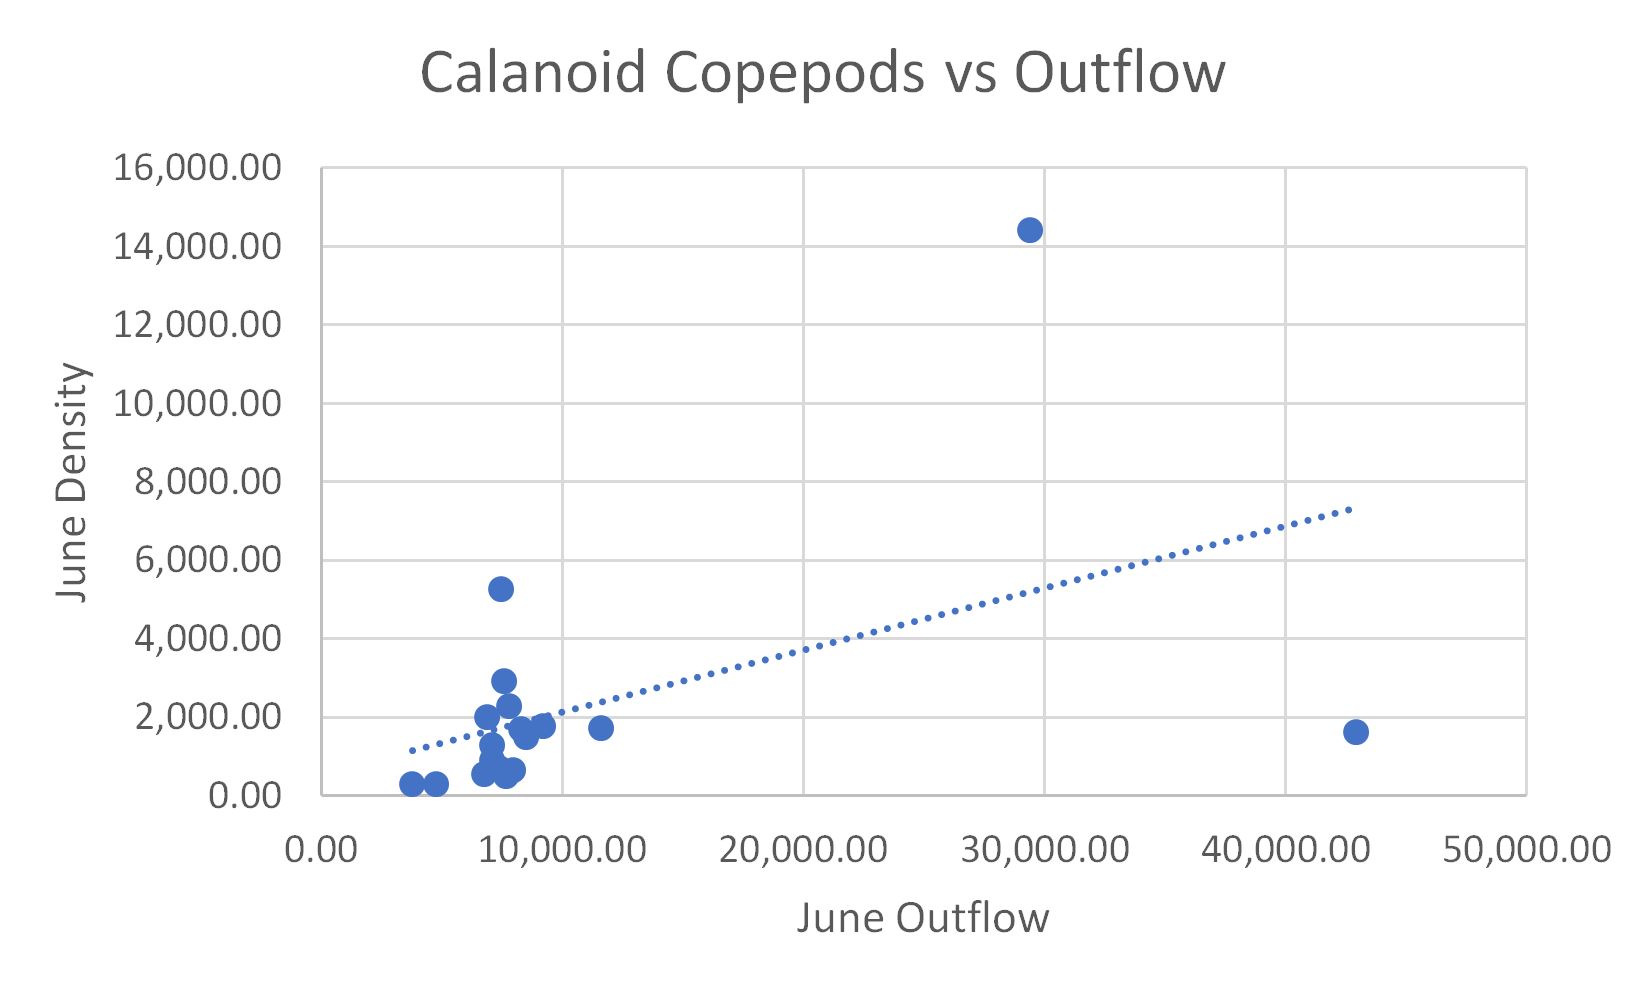
The authors noted that “the suppression of phytoplankton abundance due to exports cannot be reversed with equivalent releases from upstream reservoirs. Releasing water in late summer/fall increases flow, which decreases residence time, and therefore suppresses phytoplankton abundance (Table 2, Fig. 6).” This finding is extremely important because the primary form of mitigation for Delta exports has been maintaining outflow by increasing inflow with reservoir releases.

The study’s analyses strongly indicate that the decline in estuary productivity is associated with the clam invasion and increasing exports over the past five decades. The effects are most pronounced in non-wet years when fish production is most negatively affected.

There are factors not discussed in the study paper that deserve mention:

  • The increase in invasive clams and the more upstream distribution of clams are also enhanced by the increasing exports and lower Delta outflows resulting from higher exports.
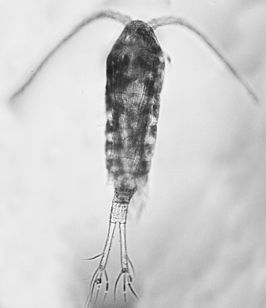
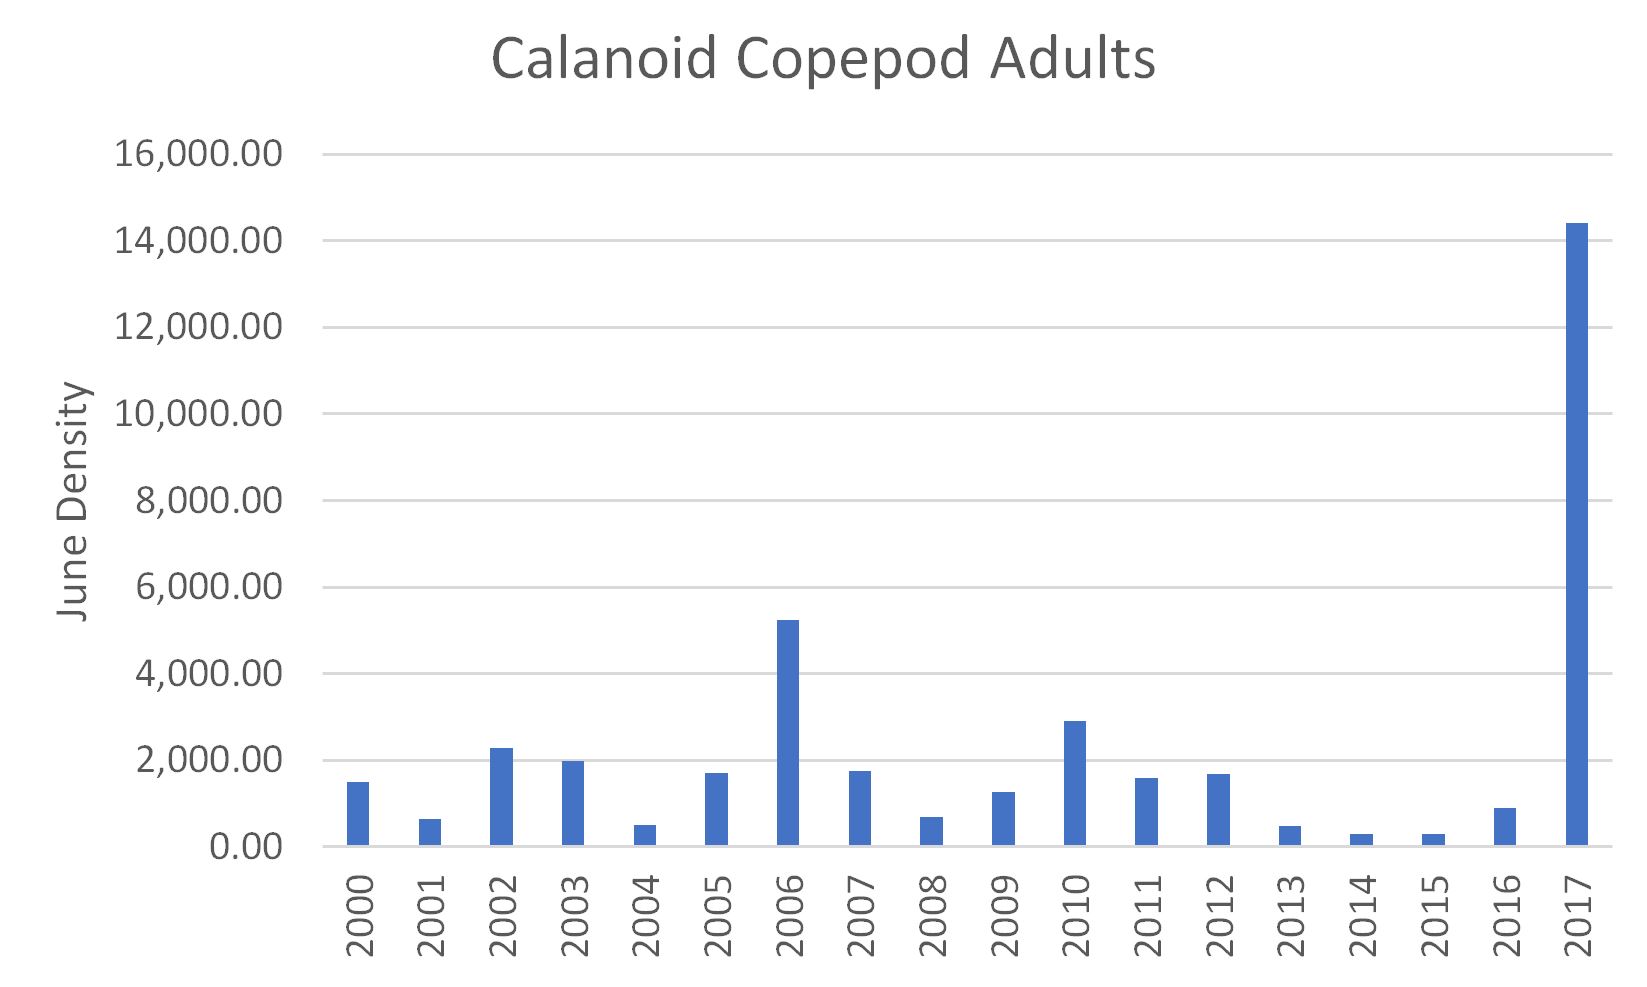
  • The reduction in zooplankton (fish food) and fish abundance is also directly affected by the entrainment of both in exports.
  • The trophic collapse is also related to an increase in invasive rooted and floating aquatic plants, including Egeria and hyacinth over the same period. These plants compete with phytoplankton for nutrients and pelagic habitat. They also mechanically trap phytoplankton. For example, when flood tides carry turbid phytoplankton and water laden with suspended sediment into margin habitats that have an abundance of aquatic plants, ebb tides return clear water. Invasive aquatic plants have also benefitted from declining phytoplankton and suspended sediment, setting off a vicious circle of declining pelagic productivity.


  1. Hydrodynamic Modeling Coupled with Long-term Field Data Provide Evidence for Suppression of Phytoplankton by Invasive Clams and Freshwater Exports in the San Francisco Estuary, April 8, 2019. See description (“Clams and Water Pumping Explain Phytoplankton Decline in San Francisco Estuary” at: https://www.ucdavis.edu/news/clams-and-water-pumping-explain-phytoplankton-decline-san-francisco-estuary.

Revised Delta Smelt Take Permit

The Interior Department’s US Fish and Wildlife Service (USFWS) issued a memo1 on January 30, 2019 that revised the federal take permit for Delta smelt for the combined operation of the Central Valley Project and the State Water Project. The memo stated:

“It has become clear over the past several years that surveys are reaching their detection limits given the declining population of delta smelt, and in 2018, the FMWT [fall midwater trawl] Index was zero, indicating that the FMWT Index may no longer provide an accurate predictor of incidental take.”

The new take criteria are now the old action criteria of limiting Old and Middle River (OMR) reverse flows during the winter and spring under certain conditions. When smelt would normally be expected to be present, OMR flows would be restricted to being no more negative than -2000 or -5000 cfs. The new “surrogate” criteria essentially keep the south Delta pumping plant operations at status quo until such time as the ongoing reinitiated Endangered Species Act (ESA) consultation is completed and new take permits are issued.

The importance of the rule change is diminished by the fact that Interior (combined action of US Bureau of Reclamation and USFWS) has not enforced the rules to protect Delta smelt. The state of California has also failed to protect Delta smelt as well as California ESA-listed longfin smelt. One only has to review recent early winter information to see this is the case. After the first Delta outflow pulse at the beginning of December 2018, outflow fell to only 4000 through mid-December (Figure 1). High exports (Figure 2) contributed to the low outflow and exceptionally low (negative) OMR flows (Figure 3).

These low outflows and high exports created very high risk conditions for the two smelt species. What few Delta smelt remained were observed in the west Delta (Figure 4). Longfin smelt were spawning in Suisun Bay and the west Delta (Figures 5 and 6).

Smelt are not being protected. The Smelt Working Group mandated under the Federal and State take permits has been inactive and has not provided mandatory guidance. New take permits are needed immediately to protect the two listed smelts. The State Water Board, in revisiting water right permits and water quality standards for the Delta, should also adequately protect the listed smelts. To protect the smelts, the OMR limit for December should have been no more negative than -2000 cfs. The export-to-inflow limit criteria for December should be 35%, not the present 65%. December outflow minimums should be 6000-8000 cfs, not the present 3500-4500 cfs.

Figure 1. Delta outflow 11/10/18 to 1/8/19. Note very low outflow in early December after initial rainfall pulse.

Figure 2. State project exports at Clifton Court December 2018 to February 2019. Federal exports were near maximum (3500-4200 cfs) for most of period.

Figure 3. OMR flows November 2018 to January 2019.

Figure 4. December 2018 Kodiak trawl survey catch of Delta smelt.

Figure 5. December 2018 midwater trawl longfin smelt catch.

Figure 6. Smelt Larvae Survey #1 for 2019 catch of newly hatched longfin smelt.

Longfin Smelt February 2019

In my last update on the status of longfin smelt (February 2018), I decried the continuing decline of the Bay-Delta population of longfin, which are listed under the California Endangered Species Act.  The fall index for 2018 indicates continued low population levels (Figures 1 and 2), with 10 to 100 times higher production in wetter years than dry years.  After the very poor recruitment in 2015 and 2016, there was some recovery in wetter years 2017 and 2018.  Despite record low spawner numbers in 2015 and 2016, recruits increased with wetter years 2017 and 2018, which in turn could lead to improvement in 2019 and beyond with indices above 100 (log 2.0 in figure 2) or perhaps even near 1000 (log 3.0 in figure 2).  If drought returns, bets are off.

Figure 1. Fall Midwater Trawl Index for longfin smelt, 1967-2018. Source: http://www.dfg.ca.gov/delta/data/fmwt/indices.asp

Figure 2. Longfin Recruits (Fall Midwater Trawl Index) vs Spawners (Index from two years prior) in Log10 scale. The relationship is very strong and highly statistically significant. Adding Delta outflow in winter-spring as a factor makes the relationship even stronger. Recruits per spawner are dramatically lower in drier, lower-outflow years (red years). Data source: http://www.dfg.ca.gov/delta/data/fmwt/indices.asp.

Winter Pulsed Flows for Fall Run Salmon

There has been a series of storms in the Central Valley in early winter 2019 that have stimulated the migration of salmon fry and smolts in the lower Sacramento River toward the Bay-Delta (Figure 1). However, these storms have not created flow pulses in the 25 miles of prime spawning habitat in the Sacramento River directly downstream of Keswick Dam (River Mile 300) (Figures 2 and 3). High flows at Bend Bridge (RM 250) have originated from largely un-dammed Cow, Cottonwood, and Battle creeks. Although inflow to Shasta and Keswick reservoirs has exceeded 50,000 cfs during two recent storm events (Figure 4), these reservoirs are releasing only a few thousand cfs.

Based on the Red Bluff screw trap catch (top chart in Figure 1), there are likely many wild fry in the upper river directly downstream of Keswick Dam that could take advantage of flow pulses to start their 300–mile journey toward the San Francisco Bay-Delta and its optimal fry rearing habitat. Flow pulses of 3000-5000 cfs during storm events added to the existing Keswick release could go a long way toward increasing the production of wild fall-run Chinook salmon.

Figure 1. Screw trap collections of fry fall-run salmon at Red Bluff (RM 240) and Tisdale Weir (RM 120) August 2018 to mid-January 2019.

Figure 2. Sacramento River flow at Keswick Dam (RM 300) (red line) and Bend Bridge (RM 250) (green line) 10/1/18-1/16/19.

Figure 3. Map of upper 100 miles of Sacramento River downstream of Keswick Dam with approximate percent of salmon spawning by sub-reach. (CDFW data)

Figure 4. Inflow to Shasta Reservoir in January 2019.

Suisun Bay Zooplankton in Droughts

Suisun Bay zooplankton are important prey for Bay-Delta fish populations, including smelt and juvenile salmon.  During the recent 2012-2016 drought, the State Water Board issued temporary urgent change orders (TUCOs) that allowed lower Delta outflow than would normally be required in Critically Dry water years.  Specifically, those Board orders allowed lower outflow in spring of 2014 and 2015. To evaluate the effects of these orders, I looked at June outflow versus June density of cladoceran and calanoid copepods, the primary fish prey in Suisun Bay and Marsh, the prime east Bay nursery area.

Zooplankton sampling stations in area of Suisun Bay and Suisun Marsh. I used June survey densities for stations 28, 32, 48, 54, and 60 to represent food available to young salmon and smelt.

Cladocerans

Cladocerans, sometimes called “water fleas,” are generally most prevalent in freshwater portions of the estuary, and would be expected to have lower density as brackish water encroaches in Suisun Bay with lower outflow. Cladoceran density was near zero in June 2014 and 2015, when outflow fell below 5000 cfs under the TUCOs (Figures 1 and 2) and EC reached an unprecedented 13-16 millimhos in June at Mallard Island in Suisun Bay (CDEC data). Cladoceran densities were highly variable in the outflow range of 6000-8000 cfs.

Calanoid Copepods

Calanoid copepods are another important prey of juvenile fish in Suisun Bay/Marsh. They reside in fresh and brackish waters of the Bay-Delta estuary. Calanoid copepod adult density was near zero in June 2014 and 2015, when outflow fell below 5000 cfs under the TUCOs (Figures 3 and 4) and EC reached an unprecedented 13-16 millimhos in June at Mallard Island in Suisun Bay (CDEC data). Calanoid copepod adult densities were highly variable in the outflow range of 6000-8000 cfs.

Conclusion

Maintaining Delta outflow in spring at least as great as is required by existing water quality standards is important in maintaining the productivity of zooplankton in Suisun Bay and Suisun Marsh. June outflows greater than existing requirements generally increased the productivity of these important prey for fish.

Figure 1. Density/m3 (log transformed) of total cladocerans in Suisun Bay/Marsh in June surveys 2000-2017. Note very low densities during 2012-2016 drought, especially in 2014 and 2015 when TUCOs allowed outflow to fall below 5000 cfs.

Figure 2. Density/m3 (log transformed) of total cladocerans in Suisun Bay/Marsh in June surveys 2000-2017 versus average daily June Delta outflow for the year. Note the high variability in density in the outflow range of 6000-8000 cfs. The two dots on the x axis represent 2014 and 2015.

Figure 3. Density/m3 of calanoid copepod adults in Suisun Bay/Marsh in June surveys 2000-2017.
Note very low densities during the 2013-2015 drought, especially in 2014 and 2015 when TUCOs allowed outflow to fall below 5000 cfs.

Figure 4. Density/m3 of calanoid copepod adults in Suisun Bay/Marsh in June surveys 2000-2017 versus average daily June Delta outflow for the year. Note the high variability in density in the outflow range of 6000-8000 cfs. The two dots just above the x axis represent 2014 and 2015.