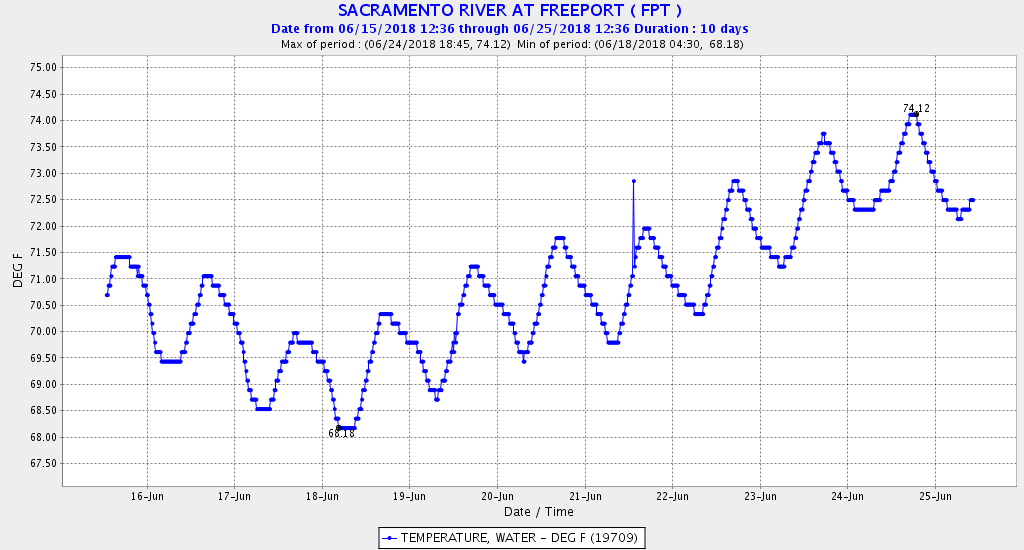
Nearly three decades ago, state and federal regulators made prescriptions that required the maintenance of water temperatures in the lower Sacramento River below 68oF (20oC) in summer to protect salmon, sturgeon, steelhead, and water quality. The condition was put in water right permits, anadromous fish restoration plans, and in the state’s water quality plan for the basin. Summer is the season when once-abundant spring, fall, and winter run salmon ran up the river and to tributaries to spawn. It is also the rearing season for spring-spawning sturgeon, striped bass, American shad, splittail, and trout, all once abundant in the lower Sacramento River watershed.
The effect of how the prescription was administered in the early 1990’s can be seen in water temperature record for Wilkins Slough in the lower Sacramento River near Grimes (Figure 1). The gradual erosion in the application of the prescription is also apparent over the past two decades. Lack of enforcement of the prescription by federal and state regulating agencies in the last five years is also apparent even in the recent wetter years following the critical drought years of 2013-2015.
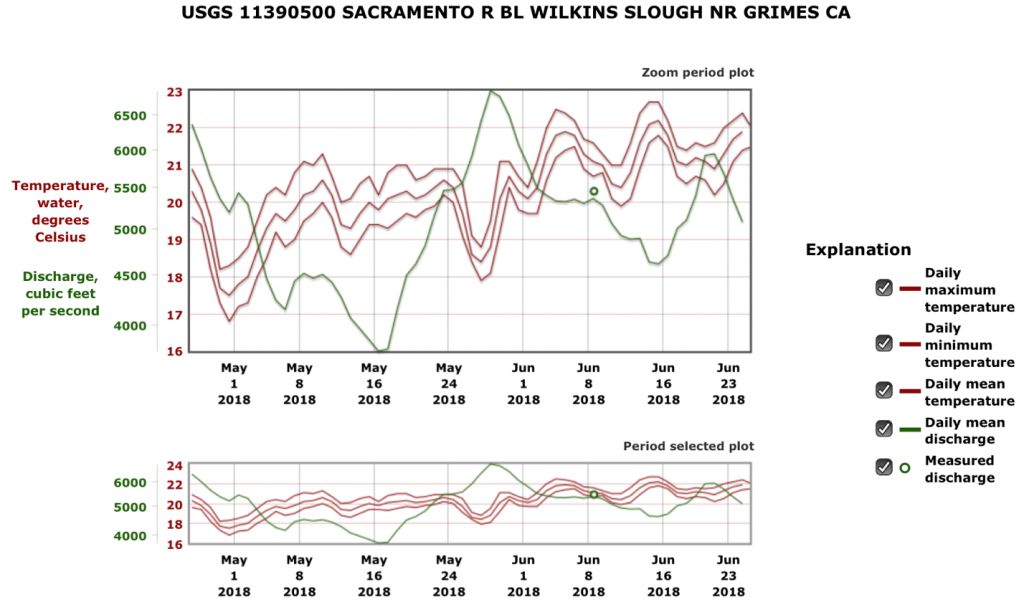
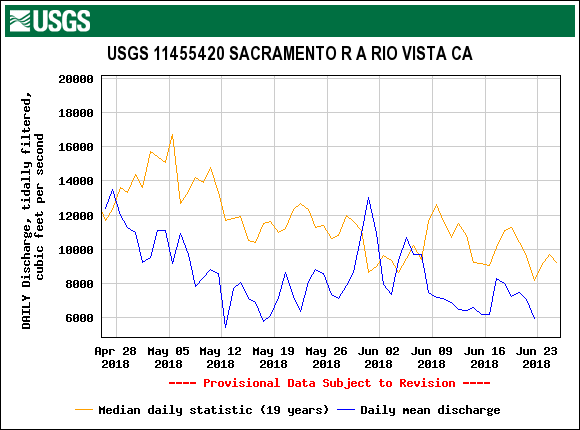
I looked at the last five years, 2014-2018, as an adaptive management study to determine how to maintain the 68oF prescription. Plots of water temperatures and river flow from Wilkins Slough (Figures 2-6) are unequivocal evidence that river flow is the primary driver of summer water temperatures in the lower Sacramento River near Wilkins Slough. Air temperature is a lesser factor in summer because it is nearly always warm. A rise in flow over the summer of 2018 (Figure 6) shows clearly that keeping flows in the 6000-8000 cfs range (depending on air temperature) can maintain water temperature near the 68oF target. Flows in the 3000-5000 cfs range lead to water temperatures of 72oF or higher, which are very detrimental to the dependent fish.
Finally, the gradual decline in summer river flow at Wilkins Slough over the past two decades (Figure 7) matches the rise in summer temperatures (Figure 1). It is not a question of changing water quality standards to protect fish. It is simply a question of enforcing the existing standards and water right permit requirements. Increasing Shasta Reservoir releases, limiting water diversions, or some combination thereof, could provide the necessary flows.
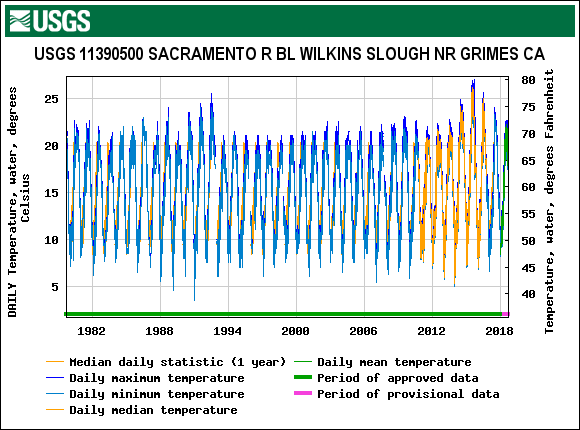
Figure 1. Water temperatures recorded at Wilkins Slough in the lower Sacramento River from 1980 to 2018.
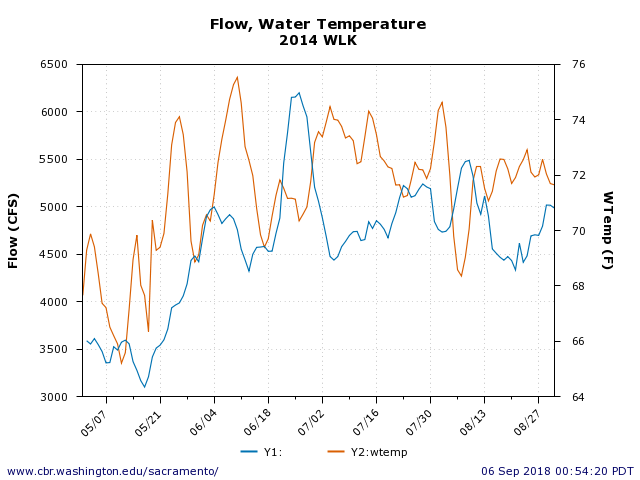
Figure 2. Water temperature and river flow at Wilkins Slough May-August 2014.
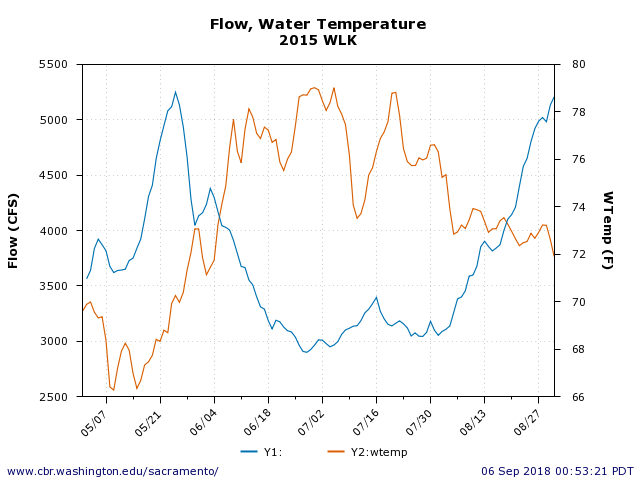
Figure 3. Water temperature and river flow at Wilkins Slough May-August 2015.
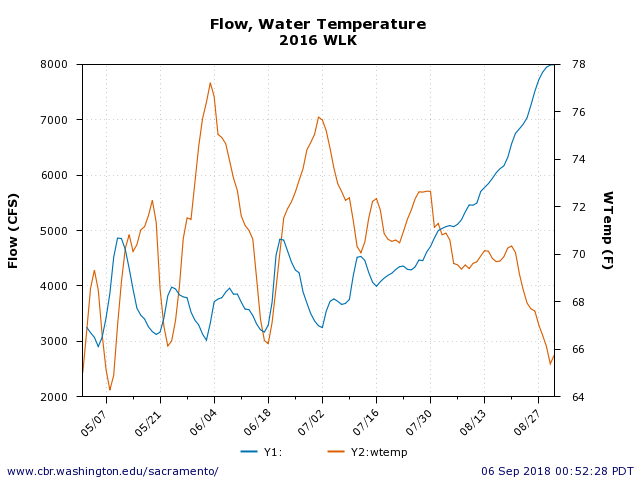
Figure 4. Water temperature and river flow at Wilkins Slough May-August 2016.
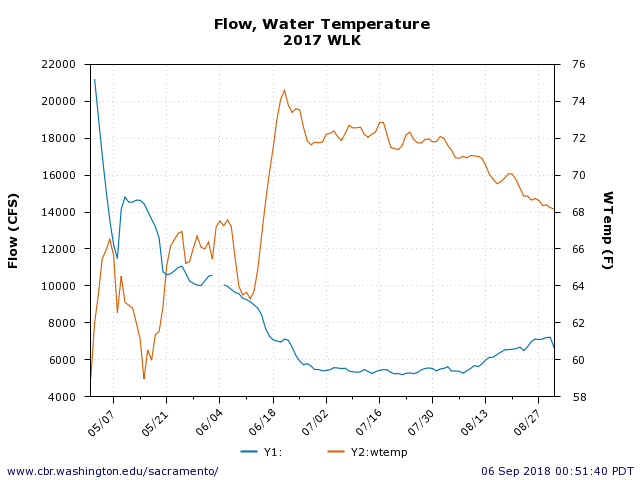
Figure 5. Water temperature and river flow at Wilkins Slough May-August 2017.
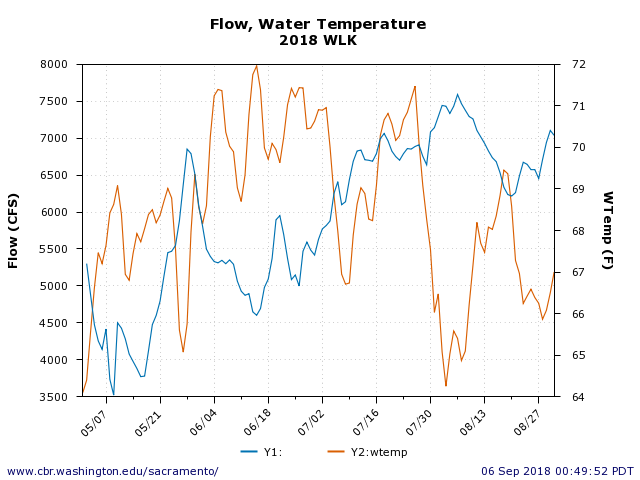
Figure 6. Water temperature and river flow at Wilkins Slough May-August 2018.
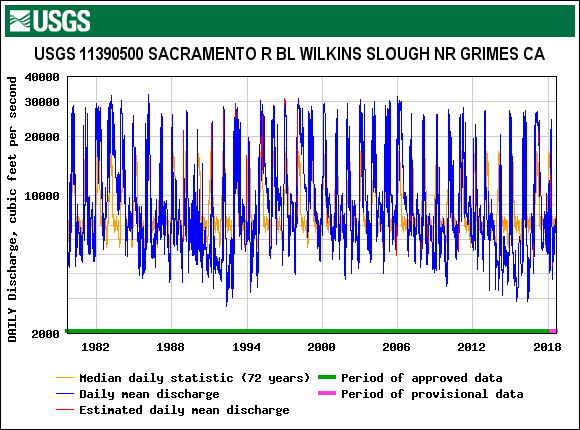
Figure 7. River flow recorded at Wilkins Slough in the lower Sacramento River from 1980 to 2018.