 This past November’s science conference on the Bay-Delta included a discussion on Delta smelt. Some of the discussion points are presented in this post, with my comments.
The Delta smelt is adapted to an ecosystem that no longer exists. “Looking at the Delta smelt’s life history, their adaptations, their tolerances to different environmental conditions, and looking at the landscape of the Delta, that the state that the estuary is in now basically does not favor the continued existence of the species. Looking at its physiology or biology, it’s no longer adapted to this particular ecosystem, as we’ve progressively changed things through time.”
Comment: Delta smelt remain highly adapted to the Bay-Delta Estuary. However the habitats are so disturbed, especially during droughts, that little recruitment is possible, resulting in a long term decline in the adult spawning population that may not be reversible. Wet years and improved water management could possibly reverse this pattern and bring population recoveries, similar to those in 2010 and 2011.
There is no smoking gun. The proximate causes of the decline are interactions among multiple factors that have altered their habitat, making it increasingly unsuitable. “Looking at all the drivers that are associated with their population status, it doesn’t really appear to be a single smoking gun,” said Dr. Hobbs. “In each particular year, that there could be a series of different drivers that creep up that could basically lop off the population at any given time, and every year it could be somewhat different at different spatial and temporal scales, so it makes it really difficult to really point the finger at one particular driver, at least as the way the data was presented and analyzed in different papers.”
Comment: In nearly every case the “smoke” emanates from poor water management in dry and average water years, when Delta inflows, outflows, and exports are manipulated in ways that disturb the ecosystem. The other factors are simply secondary reactions to the gun’s discharge.
The population exhibited some resilience when in 2011, environmental conditions were good and abundance was at near historic levels, but unfortunately the current drought may have eroded such resilience. “In 2011, we saw good flows and cold temperatures, particularly through the summer and fall, and we got a pretty large return in adult abundance that year, so up through that time period, it appears that even though the population abundance was declined, the population still had the capacity to return, so there was still some resilience left in the population,” he said. “With this ongoing drought, we may be getting to the point where the population resilience is now reaching a point where it may not be able to return to previous levels if we give it the right environmental conditions only over a single generation. What’s really important for the species being annual is that it has to have consistent conditions, not for a single year, but for many, many years.”
Comment: It is not a matter of resilience. It is simply a matter of survival and recruitment, and maintenance of a viable spawning population. It is not the drought, but how the water management rules were weakened in the drought. In drought, the rules must be enhanced and enforced, not weakened, to protect the species.
The continued decline of the Delta smelt demonstrates the general failure to manage the Delta for the coequal goals of maintaining a healthy ecosystem while providing a reliable water supply for Californians. Dr. Hobbs noted that this was something that was debated amongst the authors. “When the idea of the coequal goals was brought up, it was a great idea, but if you think about it, it was being implemented at a time when we were already taking close to 90% of the freshwater out of the estuary, so the fish were already well behind the curve,” he said. “We basically came out and said, ‘we’re try to manage coequally,’ and we weren’t really at a 50/50 state at that point. We don’t seem to have the capacity to bring this back to a level where it could be a 50/50 share between water for people and water for fish.”
Comment: This is just simply confusing. Coequal protection of beneficial uses does not mean that fish get 50% of water and other uses get 50%. And someone would have to be a little more precise in defining 50% (or whatever percent) of what. Fish have basic needs that protect them from extinction. Water management must work around these needs. The problem is most acute in dry years and droughts. But better allocation of water is needed in all years so enough is available at least for triage of all uses in multi-year droughts.
“We sort of put it in the terms of the coequal goals, but it’s really a failure of all of us, I think, said Dr Hobbs. “I take a lot of personal responsibility for the failure because we have a lot of science that takes a long time to get out and communicate to the public and some of that information could really be implemented on a much more rapid scale. I know a lot of other folks I talk to feel sort of responsible too because it’s under their guise to try to manage and protect the species, and we’ve continued to fail. And honesty longfin smelt is right behind them.”
Comment: The responsibility for this grand failure does not lie with the scientists. It lies with the water managers and the agencies who compromised in negotiations on water rights, water quality standards, and biological opinions. Co-equal goals does not mean “cutting the baby in half.” It means equally maintaining the viability of the two beneficial uses, which obviously does not happen.
Moderator Randy Fiorini asks Paul Souza (USFWS): “What did you find usable in this report, which represents the best available science?” “I think it’s extraordinarily helpful in terms of a synthesis of where we stand with Delta smelt,” Mr. Souza answered. “Clearly we’re in the emergency room. This is a species that has had a precipitous decline, it’s on the brink of extinction, and in situations like this, it becomes extraordinarily challenging.”
Comment: Yes it is very difficult to revive half a baby. The important thing is to keep the next baby, if there is one (however small), alive and healthy. If there is, maybe we can make an extra effort in nurturing it to adulthood.
“One of the things that I learned from this work is that there is no silver bullet,” Mr. Souza continued. “There are a lot of different activities that must be accomplished, which makes it truthfully more difficult. The more standard situation for very imperiled species is that you have one significant driver that you can address – for example habitat loss for terrestrial species.”
Comment: There most certainly is a “silver bullet,” but it is made of H2O.
“The Delta smelt, clearly as described in that paper, is among the most imperiled species in the country,” Mr. Souza said. “I think it’s important to also understand that it has as much political attention as arguably any species in the country as well. The situation is truly an interesting one from a conservation perspective. We have a very small fish that’s had a dramatic decline that is in the heart of the water supply for the biggest state in the union, and also provides water obviously for agriculture which is among the most productive in the world. So with that, and all of the development pressures that we’ve seen, we have this unique complex situation to deal with.”
Comment: This is exactly why the Endangered Species Act was enacted. Are we going to protect the largest and most important estuary in California and the western United States or not?
“Going back to the real challenges that the paper describes, we have to figure out how to make incremental progress in the face of uncertainty, and the Delta smelt resiliency strategy is something I’m very excited about,” Mr. Souza said. “I want to give kudos to the State of California for the leadership they’ve provided. It outlines 13 different activities that we think could be helpful in that regard. So truthfully, I’d love to hear from you, Jim, among those 13 activities, which would you prioritize, and why, and which do you think are going to be most promising to help the species get in a better condition?”
Comment: If the Strategy outlined was so exciting, why wasn’t any of it implemented in 2016? The Strategy simply is cutting the baby into thirds. “Kudos” to the State for simply recognizing its long-held responsibility.
“I think the number one thing that we should do is to address the outflow issue,” responded Dr. Hobbs. “We need to think hard about what kind of outflow, when, where, and what kind of intensity. The work that was done by Ted Sommer this summer, collaborating with some of the ag folks and getting water down the Toe Drain of the Yolo Bypass was the lowest hanging fruit. Very little water was needed to necessarily get that productivity moving from the Toe Drain into the North Delta arc area. I think that’s the place we should start, considering the state of affairs with the amount of water we have.”
Comment: Yes, water is the silver bullet in the form of Delta outflow. Think of Delta outflow as the powder charge that delivers the silver bullet. However, a little bit of hot, dirty, ag water in summer from the Yolo Bypass is not much powder. Prejudging the amount of water available and needed is also not a way to start.
“We’re probably going to have a little bit of water to do summer flow pulses or fall flow pulses so we need to think really strategically about where we put that water, rather than just putting it down the middle of the Sacramento River where 200,000 acre-feet will hardly be even measurable,” said Dr. Hobbs. “If we put this in novel places, we might be able to create the habitat conditions that will be supportive of the species.”
Comment: Why just summer or fall? Why just pulses? 200 TAF of water down the Sacramento River or 1000 cfs for 100 days is a lot of water, which would provide measurable benefit to the river, Delta, and Bay particularly in a dry year. And why just 200 TAF, when ag takes more than 10,000 TAF?
“Coming back to the Yolo Bypass issue, some of the work we’ve been doing recently is that there are a large number of Delta smelt actually residing in the Toe Drain area for a long period of time, and some even staying over the summer and becoming full freshwater resident fish living in that habitat, so that region is clearly one of the most important areas for smelt right now,” said Dr. Hobbs. “We do have the capabilities of providing what water we can provide in that particular habitat, so that’s where I would start.”
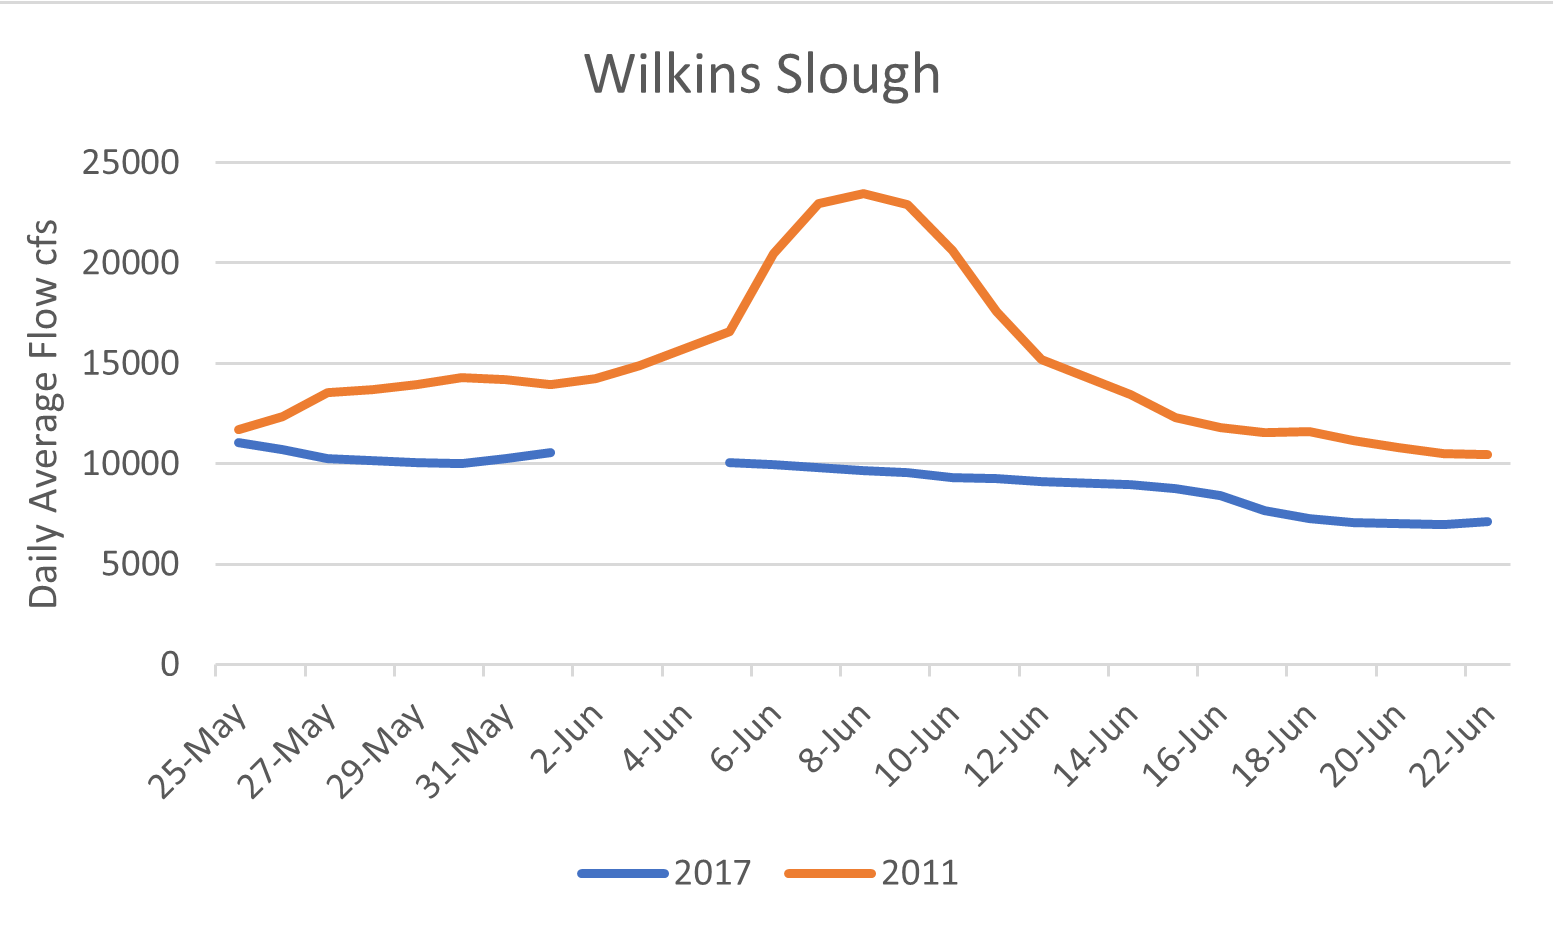
Comment: There is no evidence that smelt survive the hot summers in the Yolo Bypass or in the Delta. The most important action is to keep the low salinity zone habitat of the smelt downstream of the Delta in Suisun Bay with more outflow in drier years. 250 TAF of water (see next quote) could help do this in many years.
“Of the 13 provisions in that Delta smelt resiliency strategy, the one that’s probably going to be the most challenging, the most costly, and the most controversial would be the outflow test of 250,000 acre-feet of water,” said Mr. Souza. “We know that water is a precious commodity; there is no free lunch. If that water is acquired for a test, it’s going to come with some tradeoffs.”
Comment: Why is water not available to maintain key beneficial uses protected by State laws, and why is it not free? Why is more of the natural flow being allocated to water rights each year? Why isn’t water used for human use not taxed like the State’s carbon tax to help purchase more water rights and restore more habitat lost to development? Why aren’t the co-equal goals to protect the environment being addressed?
“That really is the place that I find fascinating in the work that we do,” said Mr. Souza. “It really is the interface of science and policy. How do you make these choices, and similarly, how do you get meaningful results from these 13 different tests that are going to allow us to get better? That is really all that we can ask of ourselves is try to get a little better and to try to make some incremental progress in the face of these extraordinary challenges.”
Comments: A “little better” and “some incremental progress” are not going to cut it. The interface of science and policy is longstanding: it is the policy and management that have prioritized the water supply side of resource allocation.
“I’d love to get your thoughts, Jim, about how we actually measure success,” said Mr. Souza. “These 13 actions I think are all important and I’d love to see them all done as fast as possible. Clearly some are easier than others, some more costly than others, but one of the things that I’m already seeing as a significant challenge is how do we know if they are making a difference? When you have a species that is in such a precarious position that’s so hard to find, how can you craft goals and objectives at the population level that we can then implement these 13 provisions and actually measure whether there’s a biological response that is meaningful and a result of the actual test themselves?”
Comment: There are a dozen metrics that provide a measure of smelt performance. These metrics have been available for a decade or more. For each identified action, managers could apply one or more of these metrics to numerically assess the response in the smelt population.
“I think we have the tools to do that,” said Dr. Hobbs. “We have a strong scientific group of people here who have a diverse set of skills. We have really nice conceptual model and a good synthesis of Delta smelt biology. We could use that framework with those strategies in an adaptive management context and look at each of those things that we’re going to do, and with the scientific community come up with the measurable objectives.”
Comment: the tools and metrics are well developed, but objectives are lacking, as are measures that protect the smelt and their habitat.
“In some of those situations, we may not be able to measure the response in Delta smelt themselves, but we could look at the conceptual model and look at different parts of that system for positive results,” said Dr. Hobbs. “For instance, this summer we saw a decent phytoplankton bloom that was associated with water coming down the Toe Drain and some zooplankton production. We are going to have to rely on the fish being able to respond and if they are at such low abundances that we don’t see a population level response in our surveys, maybe we need to be including additional types of monitoring in adaptive scientific field experiments and searches for Delta smelt in these places so that we can do this. The Yolo Bypass is monitored by DWR, but we don’t really have a broader concerted resource to go after doing this on the real time scales that we actually need to do be doing it.”
Comment: The bloom mentioned was minor and occurred where there were no smelt. At the same time, a larger independent bloom occurred downstream in the low salinity zone as a result of classic estuary dynamics (an unrelated pulse of outflow), along with a recent high abundance of young smelt triggered by wet year Delta hydrodynamics.
“Specifically referring to the recovery plan, there were a series of actions that were discussed, and really none of them were really done,” said Dr. Hobbs. “That was probably because at the same time, the Bay Delta Accord was being put into place to manage flows and to keep the low salinity habitat in the right place in Suisun Bay for a certain amount of time, and that was part of that plan. It wasn’t specifically the main objective and it wasn’t the only thing that was being recommended, but because we were coming together and forming this California and federal coalition to address the issue, I think a lot of effort was put there on that particular issue.”
Comment: Much of the Recovery Plan was not adopted or updated over the past two decades based on performance. The key specified action in the plan was simply keeping the low salinity zone in Suisun Bay rather than upstream in the Delta. Instead, dry water year water allocations were almost entirely allotted to water supply, to the detriment of ecosystem.
“I’ll first make the point about recovery plans,” said Mr. Souza. “They do a wonderful job of bringing scientists together, and if they are really strong, they actually bring policy makers together and the regulated community together and identify a blueprint for going forward. What they don’t do is appropriate funding. And so there are lots of plans that have been put together that have never had the capacity to have full implementation; that’s just the reality of conservation wherever we are.”
Comment: I am not sure about this general statement. The problem really is the plans – they do not provide the protection the smelt need. The Recovery Plan and water quality standards are over 20 years old. The OCAP biological opinion in 2008 lacked adequate protections and is being revised.
“There is a real danger in threatened and endangered species conservation and ecosystem management more broadly speaking, when we focus too much on a single species,” he continued “We in the Fish and Wildlife Service have been criticized in the past for single species management to the detriment of other species. We’re at our best when we’re thinking about the ecosystem and multiple species and trying to find the optimization of habitat conditions for them, not the maximization for any one in particular.”
Comment: This is really a bad excuse for not protecting the Delta smelt, which was originally chosen as the “canary in the coal mine” for the Bay-Delta and all its species. I know of no species hurt by smelt protective actions, but many that benefit from them.
“We really need to focus on the tone of the conversation and how we talk about Delta smelt, and I would really love to recast this as a conversation about the Bay Delta and a shared vision,” said Mr. Souza. “The best most important conservation successes that I’ve seen in my career are grand compromises where we sit down with the affected community, we have a focused conversation about the needs of agriculture, and municipalities, and wildlife, and their habitats, and we again maximize none of those interests but do our best to optimize all of them.”
Comment: I have been involved in such sit-downs for the Delta for 40 years. I have seen many grand compromises that keep cutting each reboot of the Bay-Delta in half. One half to the tenth power is a tenth of one percent. There is no optimizing for all. Something has to give.
“We have to foster a community where we’re all in this together, because we all love the same resource, and it’s extraordinarily precious to all of us,” said Mr. Souza. “Only together are we going to be able to find a path forward where we’re doing the best that we can for this ecosystem, and it needs to move beyond a conversation where people are pitted against wildlife. That is a losing proposition for conservation and I challenge all of us to help be a part of that more positive dialog.”
Comment: We all do not share the love for “the little three inch fish”. I doubt the new Secretary of the Interior will share the love that Mr. Souza holds for Delta smelt.
Question from the audience: “I greatly appreciate your comment that single species management is almost certainly not going to be effective as multispecies ecosystem management, but I think one of the frustrations that we have all experienced in this particular system is that regardless of whether we’re using the science to inform single species management, or using the science to inform multispecies ecosystem management, is that the science is presented and recommendations are made but in fact actions are not taken. Many times the scientific advisory boards or councils or workgroups that advise specific actions and the agencies chose not to do it, so I’d like to you to respond to this relationship between the science and the decision making?”
Comment: Great question.
“My first reaction to it is that science is the foundation of decision making that’s strong for conservation,” responded Mr. Souza. “But in nearly every instance, there are ten policy legal choices that can be made with the same science, and so the real art for a policymaker is figuring out how to use that science in a way that not only is going to address the issue of the moment, but is going to be strategic in helping to facilitate the kind of relationships necessary to do something bigger together in the future than any of us could do alone.”
Comment: My, my. Enough from Mr. Souza.