The present water quality standards for the Delta were established by the State Water Resources Control Board in 1995. The standards govern how the Delta water projects operate and indirectly control much of the Central Valley’s water management. The standards also have a substantial influence on the ecosystem health of river, the Delta, and the Bay . These standards have been under review for a decade and are badly in need of update and revision. These standards have been responsible for the decline of Central Valley native fishes, including the listing of six under state and federal endangered species acts.
In this post, I discuss the Delta standards relative to performance in summer 2016, the first near normal water year (at least for the Sacramento River watershed) after four years of drought.
The summer Delta standards govern Delta salinity, Delta outflow, Sacramento River flow at Rio Vista, and south Delta export limits. Of the four, salinity and outflow governed the Delta in summer 2016, with river flow and exports (percent of inflow) well within prescribed limits.
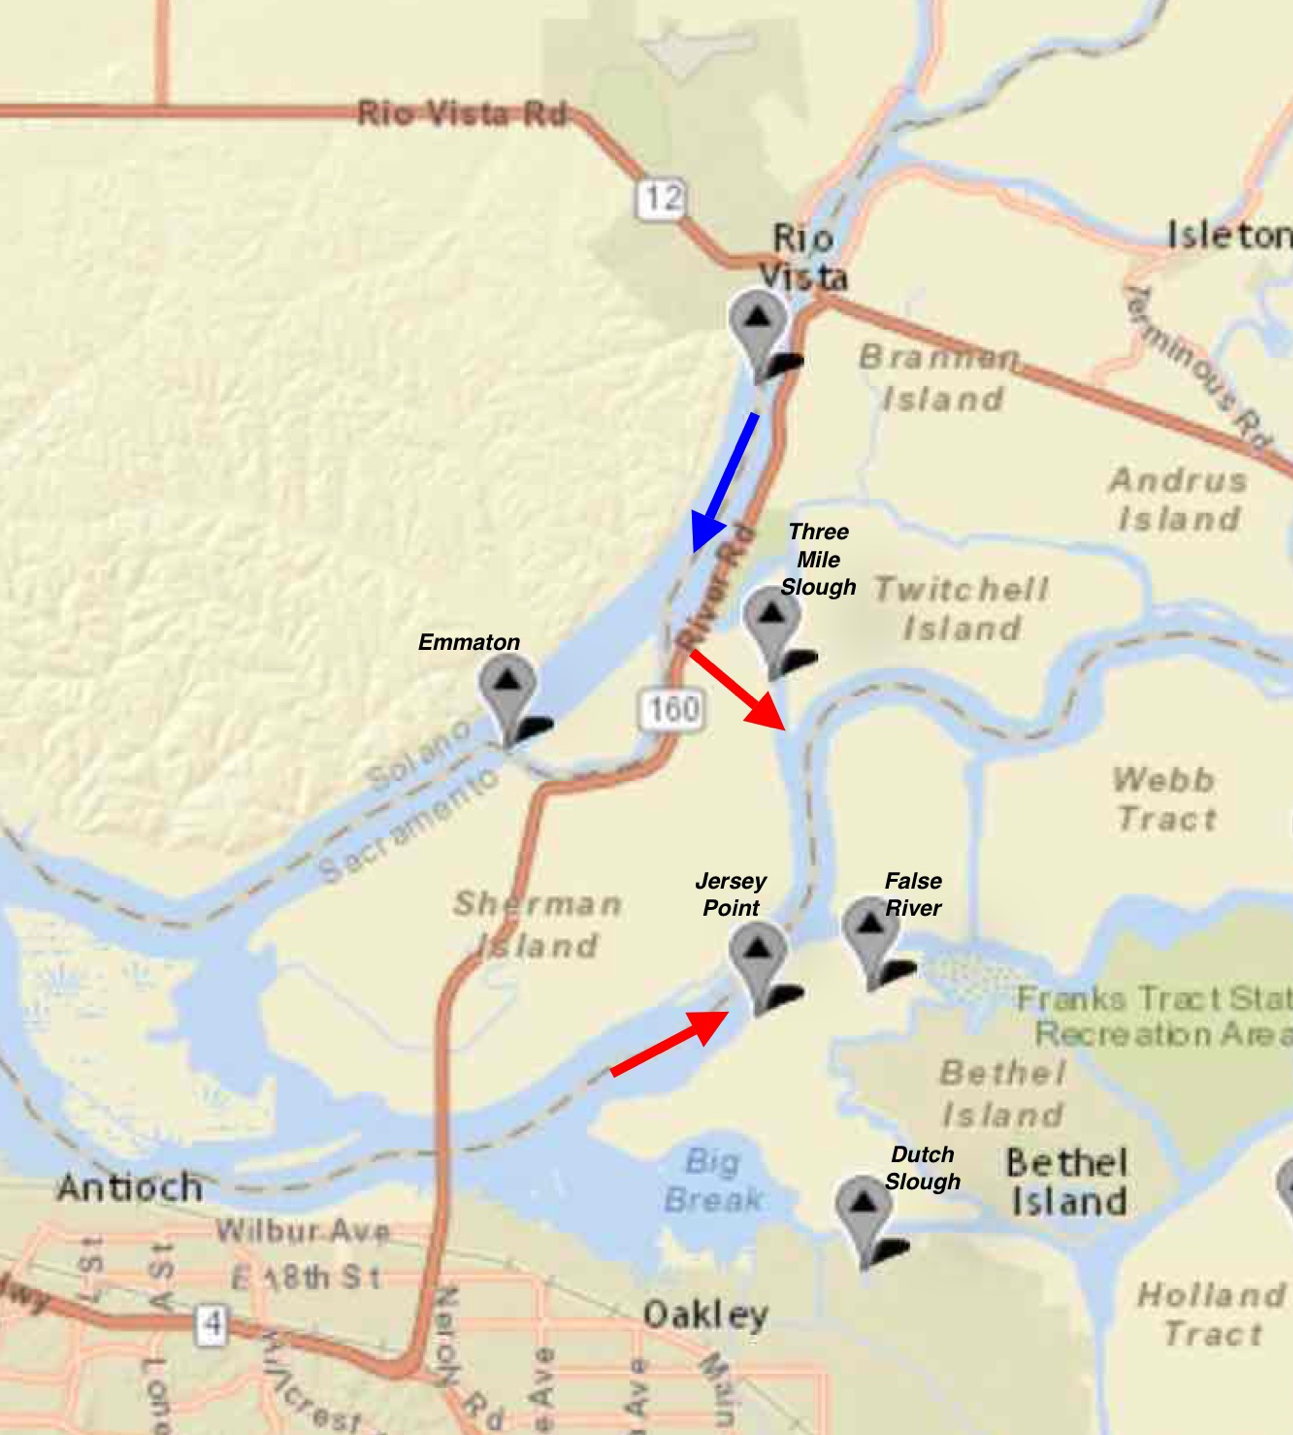
The salinity and outflow standards are monthly average limits (objectives). Monthly average standards of salinity are prescribed as electrical conductivity at Emmaton and Jersey Point in the west Delta (Figure 1), as well as other locations in the interior and south Delta.
The problem is that these standards are specifically designed to protect Delta agriculture and export water quality, not Delta ecology or its native fishes. That specific deficiency is what caused federal biological opinions to add restrictions to limit south Delta exports; however, none of these applied in summer 2016. Although the agricultural standards do provide some ecological protection, the specific hydrology shown in Figure 1 results in brackish water being drawn into the central and south Delta, which degrades the low salinity zone that is so critical to the Bay-Delta native fishes.

Figure 1. Western Delta salinity and flow monitoring stations. Blue arrow denotes primary source of fresh water input to Delta from the Sacramento River. Red arrows indicate net negative flows from west Delta toward south Delta export pumps in summer 2016. Under these conditions Jersey Point salinity tends to be controlling.
Delta Inflow
Approximately 4 million acre-feet (maf) of water entered the Delta from the Sacramento River in summer 2016, primarily from reservoir releases to satisfy agricultural demands and meet salinity/outflow standards. The 4 maf of Sacramento River inflow to the Delta represented approximately 90% of total Delta inflow. The remainder came from limited San Joaquin flow. and other sources.
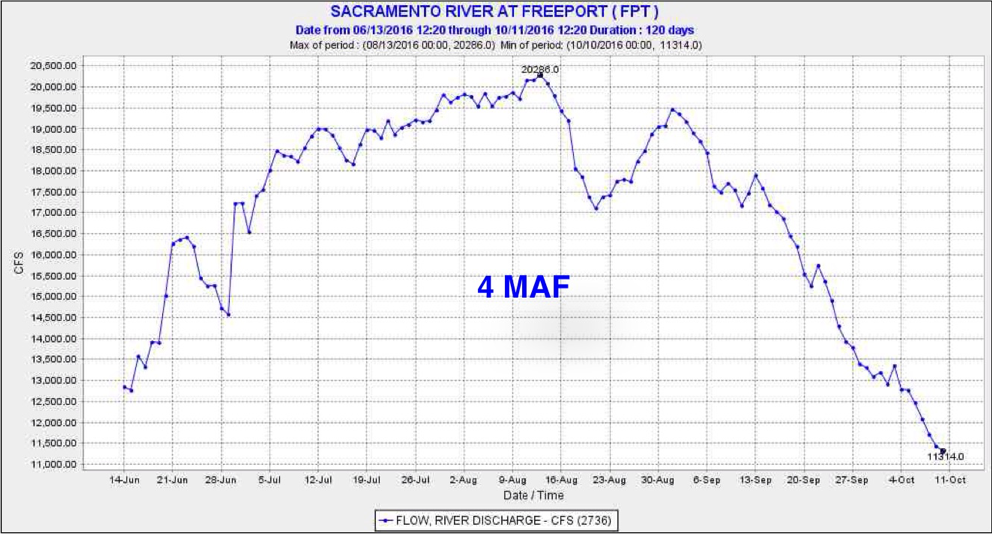
Figure 2. Delta inflow from the Sacramento River in summer 2016.
Delta Outflow and Diversions
Of the approximately 4.4 maf of total Delta inflow in summer 2016 (Figure 3), only 1.8 maf (40%) reached the Bay. Total exports and diversions from the Delta were 2.6 maf (60% of total inflow). Delta outflow standards controlled until mid-July when salinity standards took control. The additional outflow for salinity control above that necessary to meet outflow standards was provided primarily by reducing south Delta exports by approximately 300,000 acre-ft because of limited available upstream reservoir storage.
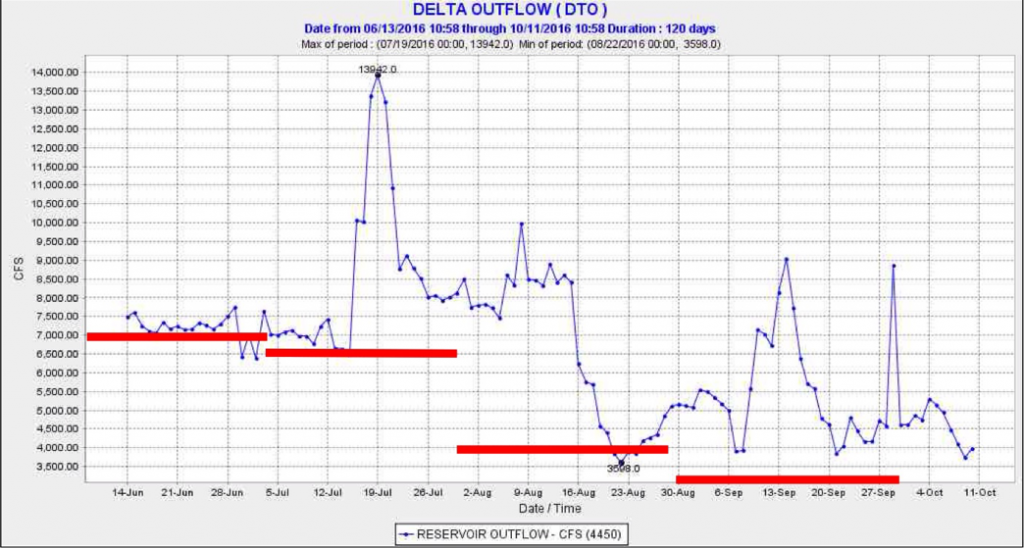
Figure 3. Delta outflow in summer 2016. Red lines denote Delta outflow standards for a Below Normal water year. Higher outflows than prescribed after mid-July were required to meet salinity standards.
Salinity
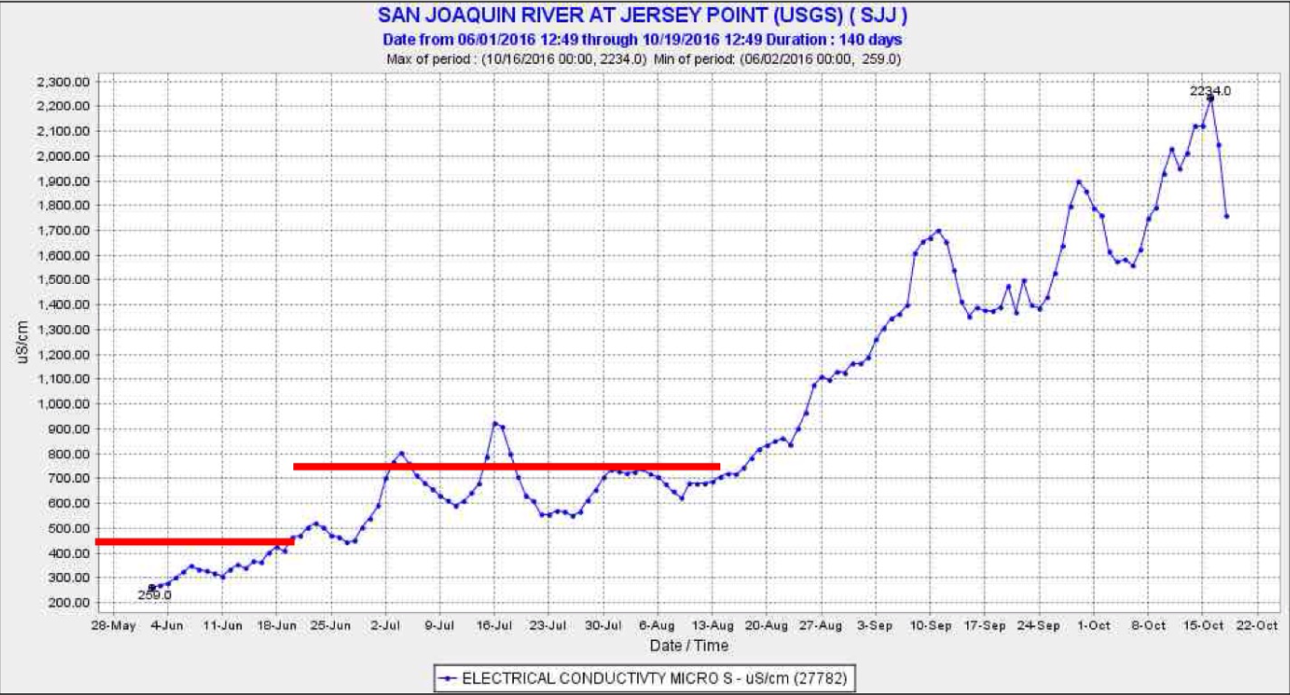
Salinity standards took control in July (Figure 4) as Delta outflow failed to keep brackish water from the Bay from encroaching up the San Joaquin channel to Jersey Point. After mid-August salinity standards for the south Delta (700-1000 EC limits) became controlling (Figure 5).
The Problem and Solution
Too much salt is allowed into the interior Delta in summer, resulting in the degradation of water quality of diversions/exports and of the low salinity zone habitat of native estuarine fishes, including Delta smelt.
The solution is to extend the early summer 450 EC standard at Jersey Point (Figure 4) through the summer in abundant water years where high exports are planned from the south Delta. In low water supply years when exports are curtailed due to limited reservoir storage, a less stringent standard can be applied. In addition, in drier years, barriers can be placed on False River and Dutch Slough to limit movement of brackish water (and low-salinity-zone fish and their food supply) into the interior Delta.

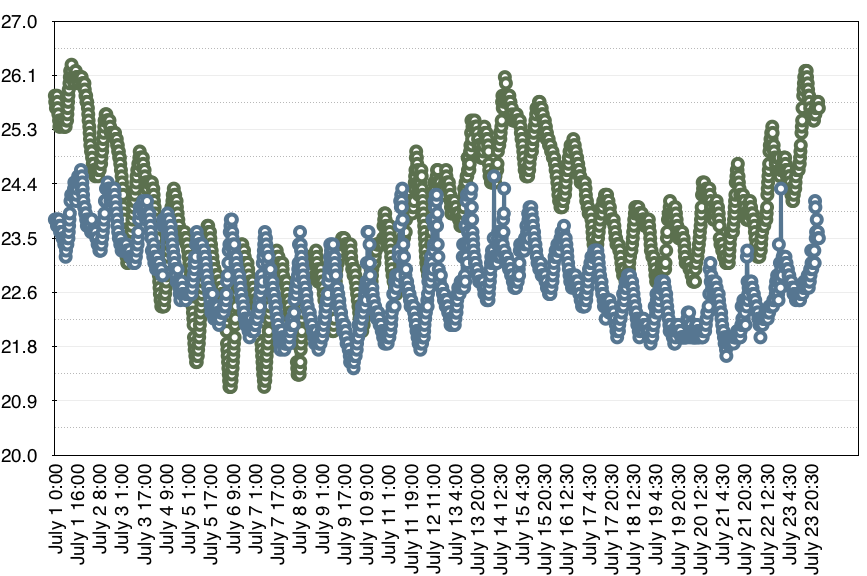
Figure 4. Salinity (EC) at Jersey Point in the San Joaquin channel of the west Delta in summer 2016. Red lines denote salinity standards applicable at Jersey Point in summer 2016.
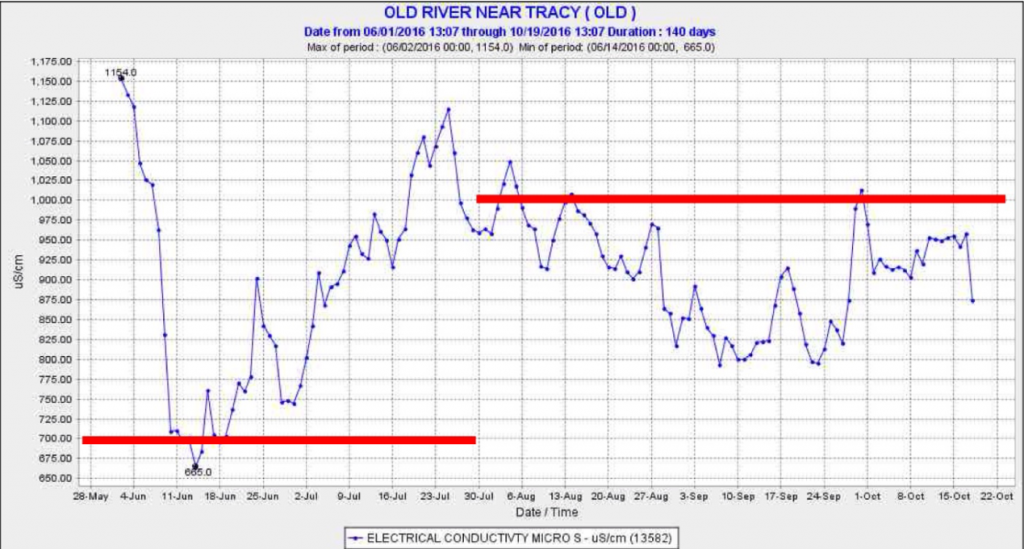
Figure 5. Salinity (EC) in Old River in south Delta in summer 2016. Red lines denote 30-day running average salinity standards applicable to south Delta.