Sturgeon Moon #3 – August 30 Blue Moon

August 2023 has come to an end, following the second “Super Moon” of the month – a Blue Moon. The first full moon of the month was called a “Sturgeon Moon,” originally coined in reference to the ease of catching sturgeon in the Great Lakes during a full moon in summer. The cycle began with the quarter moon and neap tide on July 24 until the full moon on August 1.1

This year’s Super Moons have made a mess of San Francisco Bay, as they did in summer 2022. This year’s August moons have again, regrettably, led to a die-off of sturgeon and other Bay fish.2 The Super Moons’ strong tides caused warm water from the Delta to drain into the Bay, making the usually cool Bay unseasonably warm. (The ocean Blob may have added to some of this summer’s warm Bay water.) The warm water and the associated algal blooms (and their die-offs) have led to unprecedented low dissolved oxygen levels in the Bay, which can kill fish.

While the degree of harm has not been as bad as last year’s summer blooms that were aggravated by the 2022 drought, this year’s algal blooms have also harmed fish despite generally beneficial wet-year conditions. Last summer, there was die-off of nearly a thousand adult white sturgeon in the greater San Francisco Bay due to algal blooms. More dead white sturgeon adults also showed up on Bay beaches again this summer.3

The Bay turned warmer under this summer’s Super Moons than under those last summer (Figure 1). Blooms are still happening, as indicated by high turbidities and chlorophyll levels in portions of the Bay (Figures 1-3). The draining of warm Delta water to the Bay just before the 2023 Super Moons (Figures 4 and 5) warmed the Bay (Figure 6). Low dissolved oxygen continues to plague the Bay (Figure 6). The most recent bloom is depicted in Figures 7 and 8.

The summer 2023 Super Moons and their algal blooms make a complicated story, with the effects of various factors implicated in the blooms, and their role in fish die-offs in the Bay, yet to be fully determined. My concern centers on how warm the Delta becomes in summer before it drains into the Bay during the lunar tidal cycles (Figure 9). The lower rivers and Delta received too little flow from major Central Valley reservoirs for a wet year with full reservoirs. This is an increasing trend that deserves a lot more attention to ensure protection of the Bay’s fish and other public trust values. Otherwise, the trend will simply be chocked up to climate change.

Graph of North Bay (San Pablo Bay at Richmond Bridge) water temperature and turbidity in summer 2023.

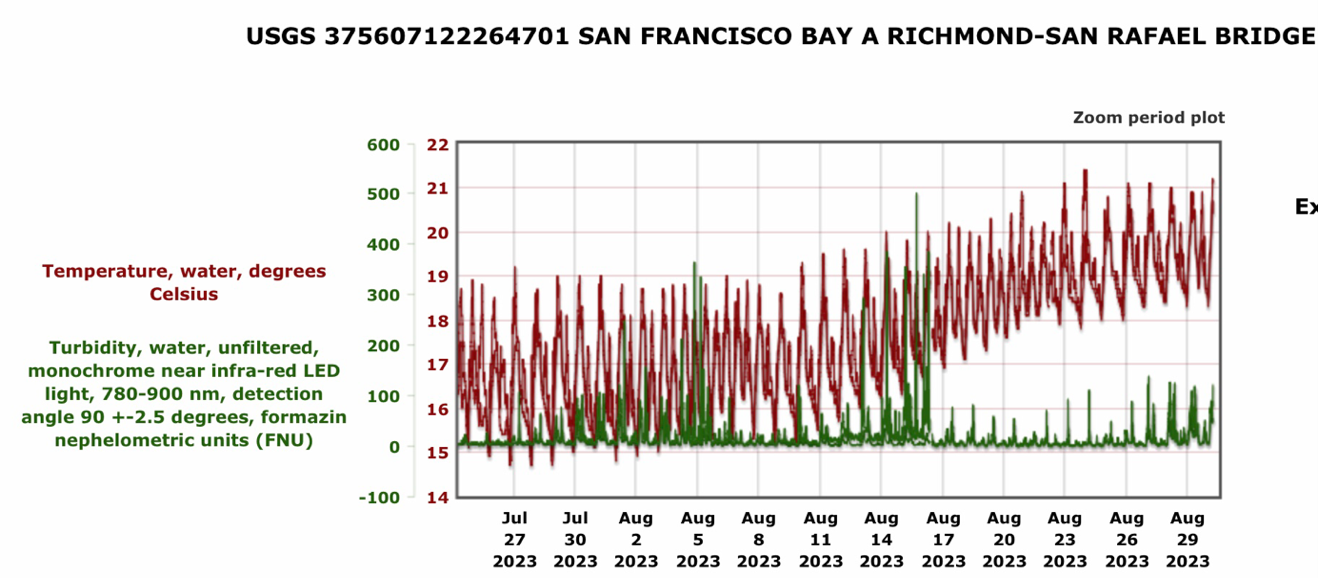
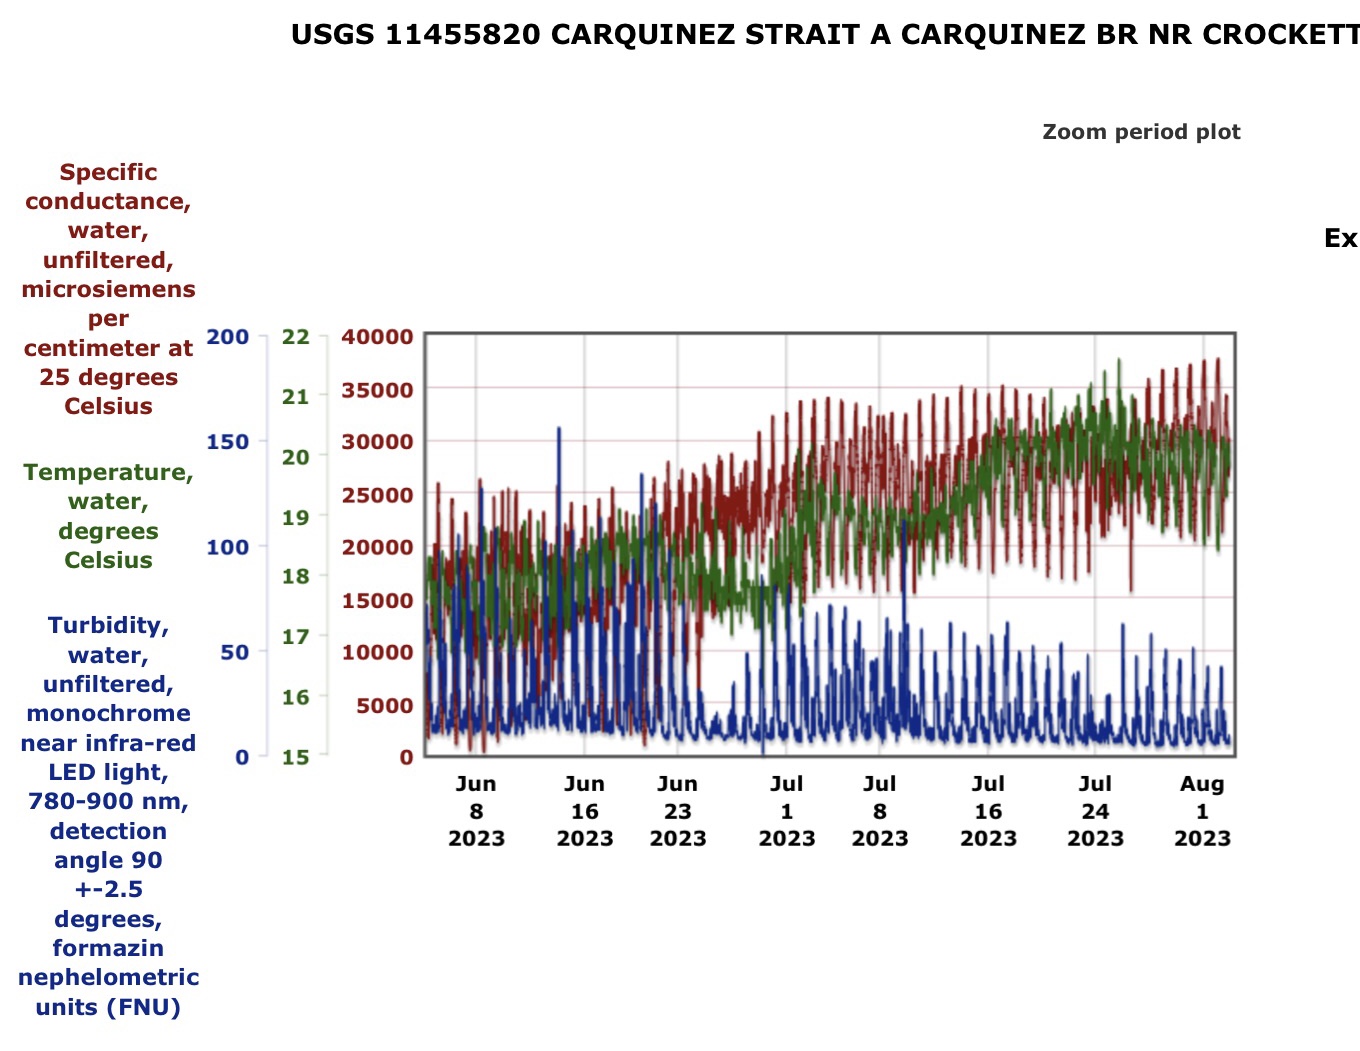
Figure 1. North Bay (San Pablo Bay at Richmond Bridge) water temperature and turbidity in summer 2023. Note the presence of the three blooms indicated by high turbidity levels (>100 FNUs)

Graph of Chlorophyll levels at Martinez CA gage between East and North San Francisco Bay in summer 2023.

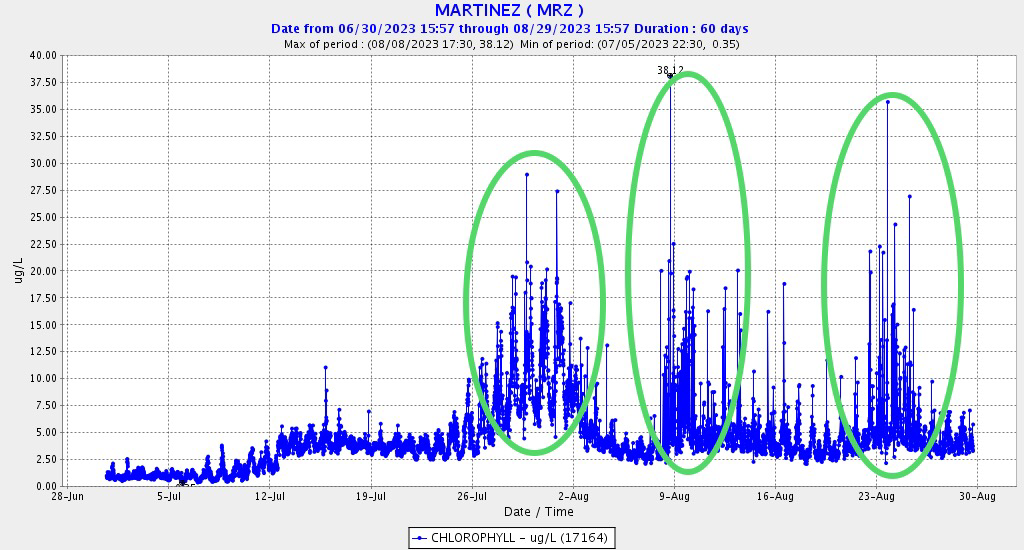
Figure 2. Chlorophyll levels at Martinez CA gage between East and North San Francisco Bay in summer 2023. Note three periods (green circles) of blooms located at this site.

Graph of Chlorophyll levels at Grizzly Bay gage (in northwest East Bay) in summer 2023.

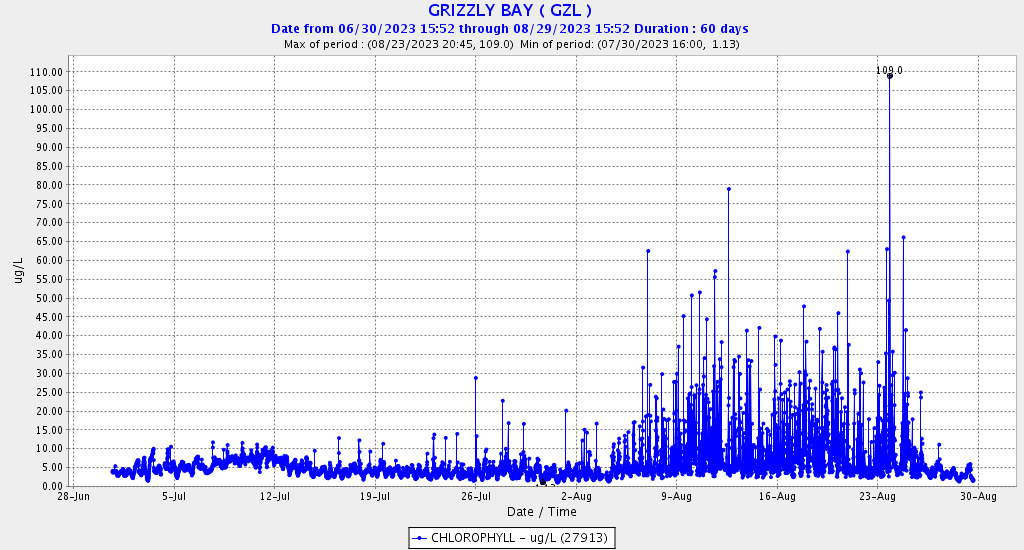
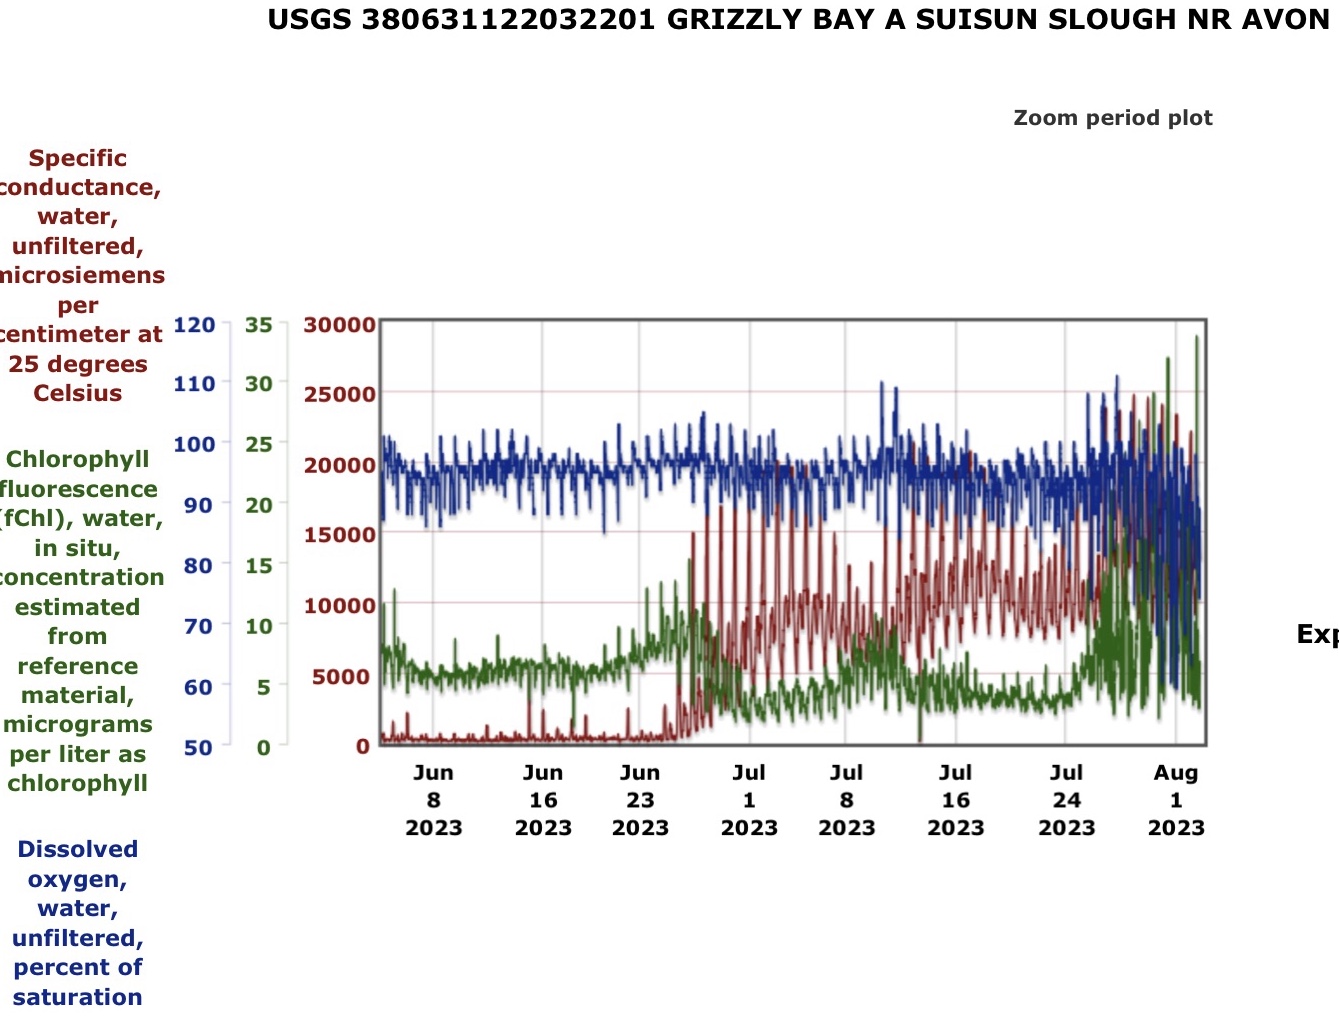
Figure 3. Chlorophyll levels at Grizzly Bay gage (in northwest East Bay) in summer 2023.

Graph of Salinity (EC) at eastern Suisun Bay gage (in east Bay) in summer 2023.

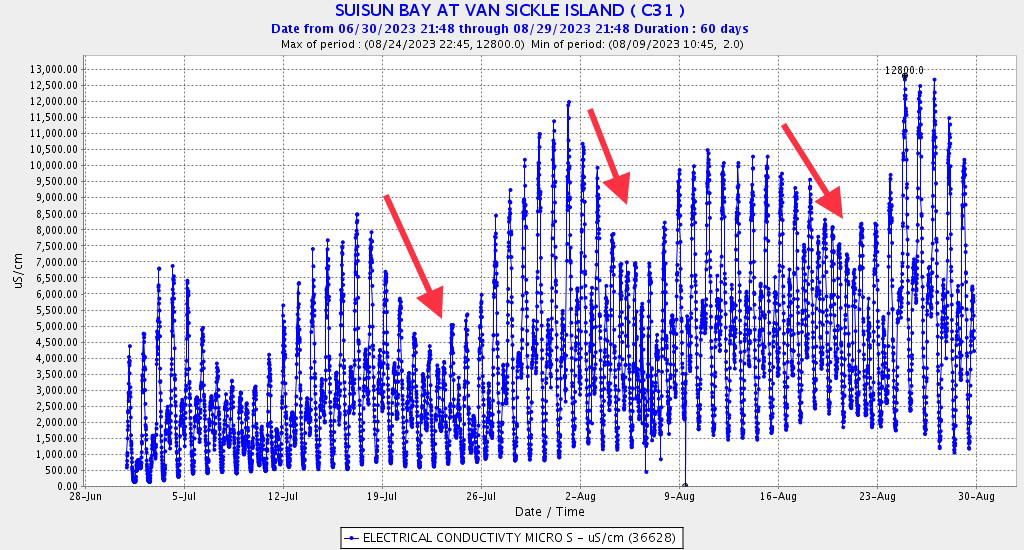
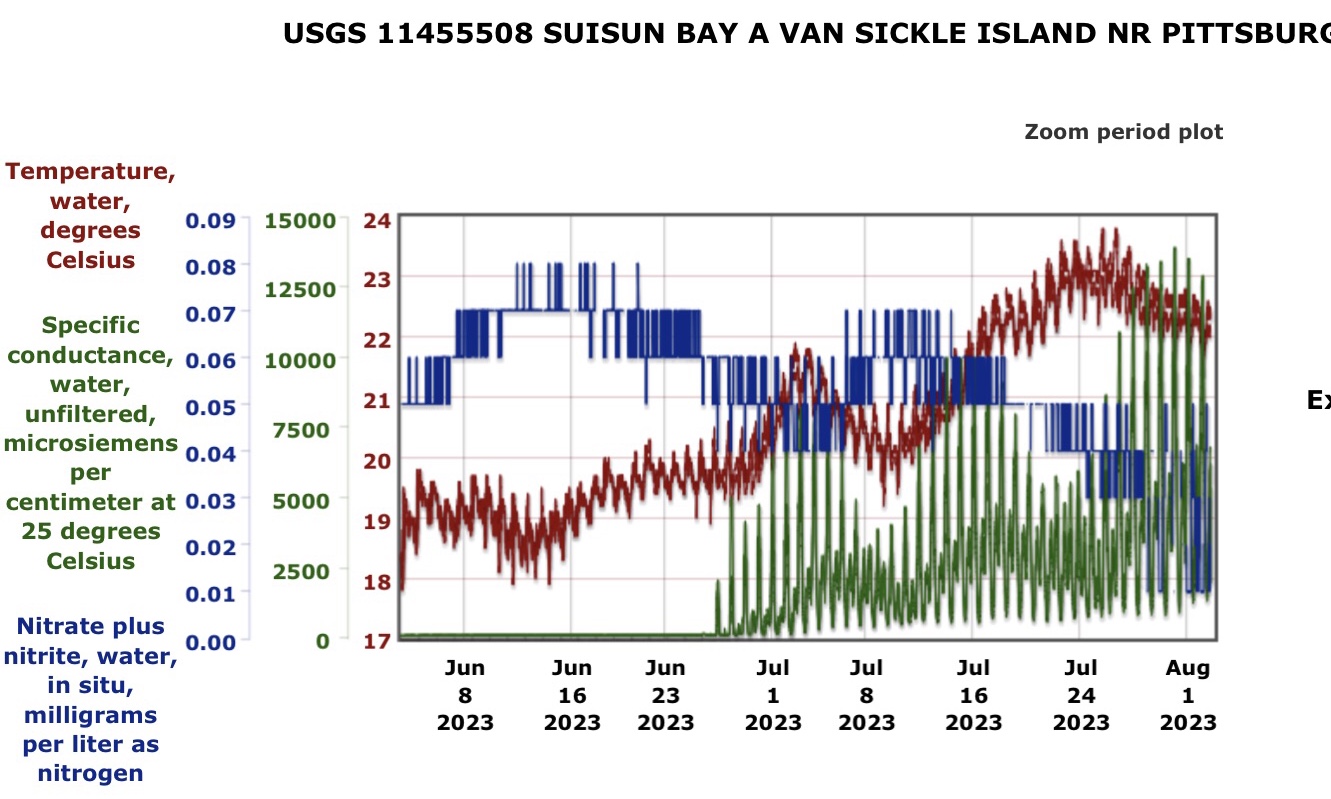
Figure 4. Salinity (EC) at eastern Suisun Bay gage (in east Bay) in summer 2023. Red arrows indicate periods of draining prior to and between full moons.

Graph of Daily average (tidally filtered) discharge at Pittsburg gage in Suisun Bay summer 2023.

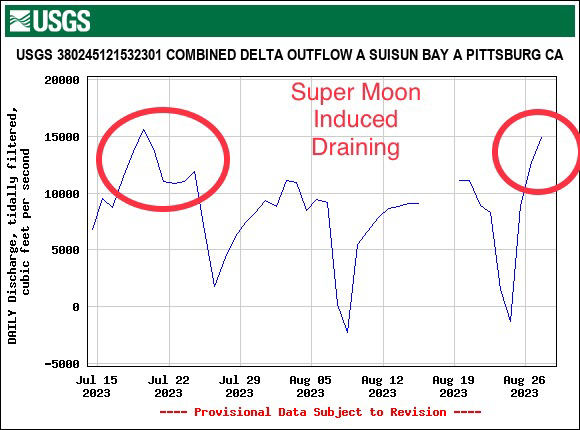
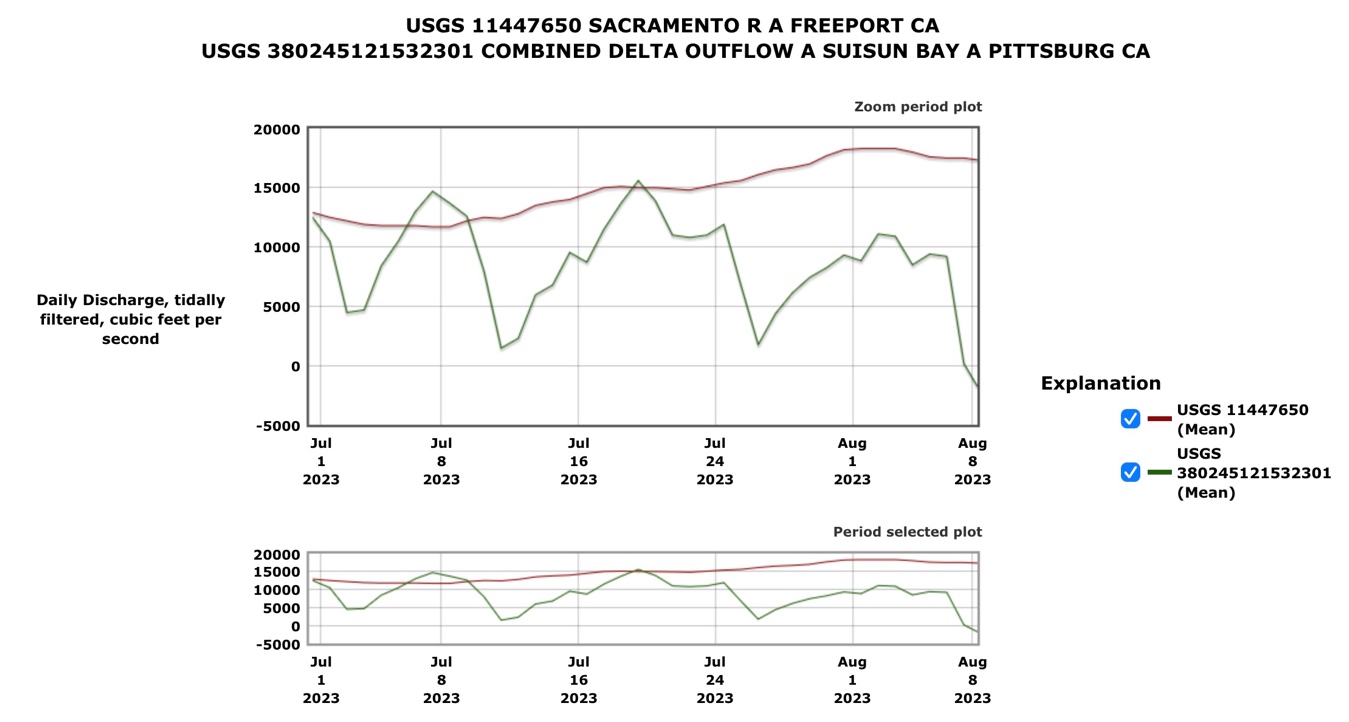
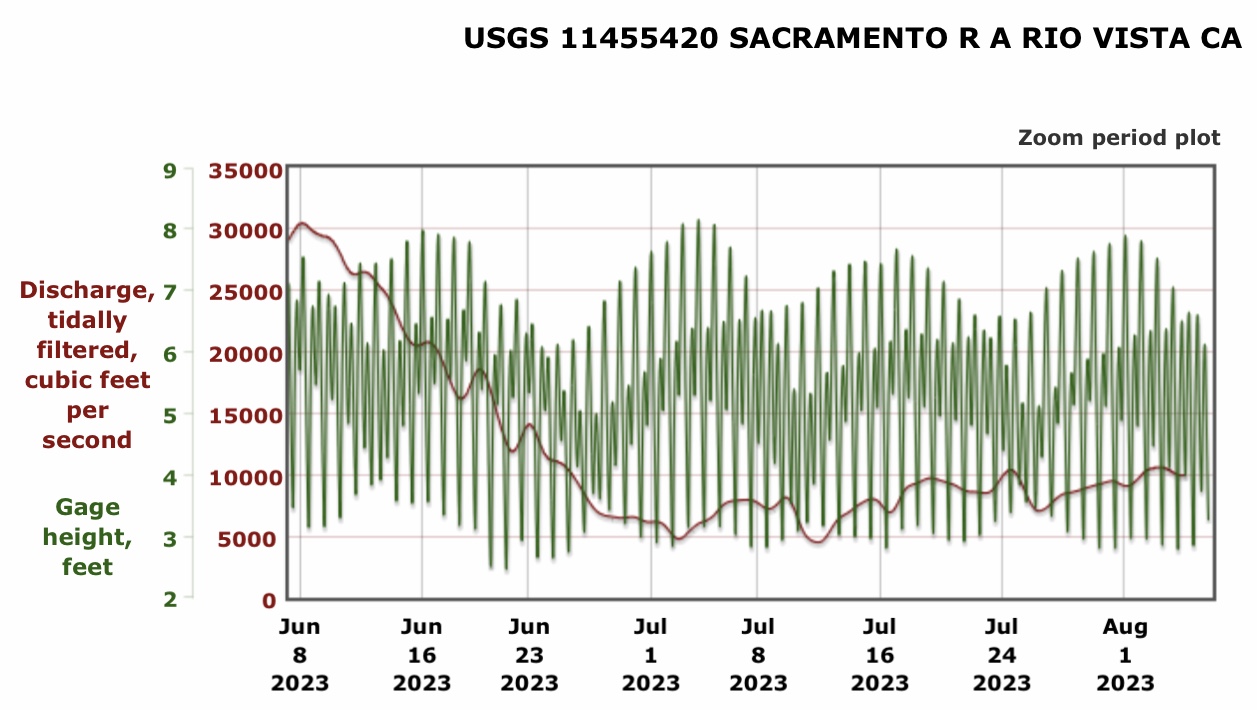
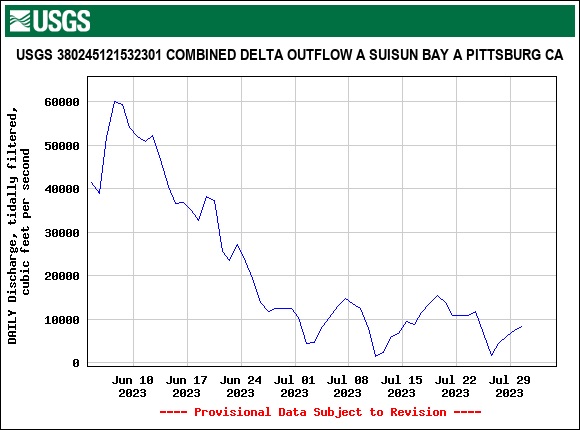
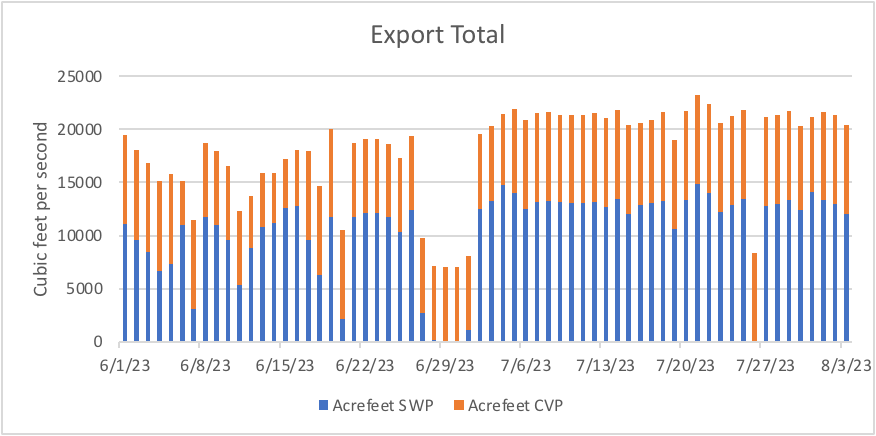
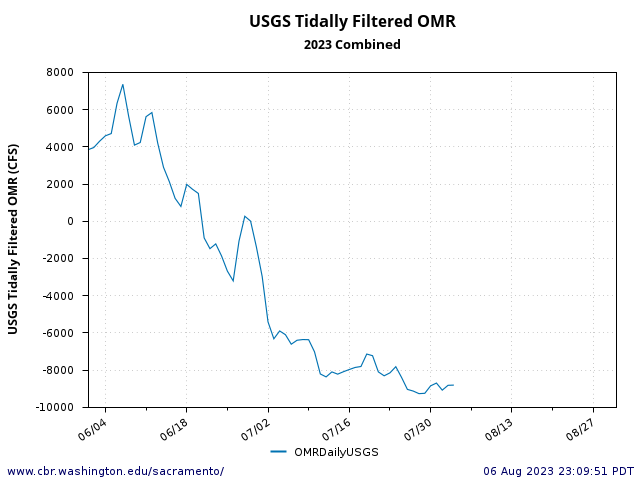
Figure 5. Daily average (tidally filtered) discharge at Pittsburg gage in Suisun Bay summer 2023. Red circles indicate drainage rates to Suisun Bay prior to two Super Moons (August 1 and 30).

Graph of Hourly dissolved oxygen levels in Grizzly Bay in summer 2023.

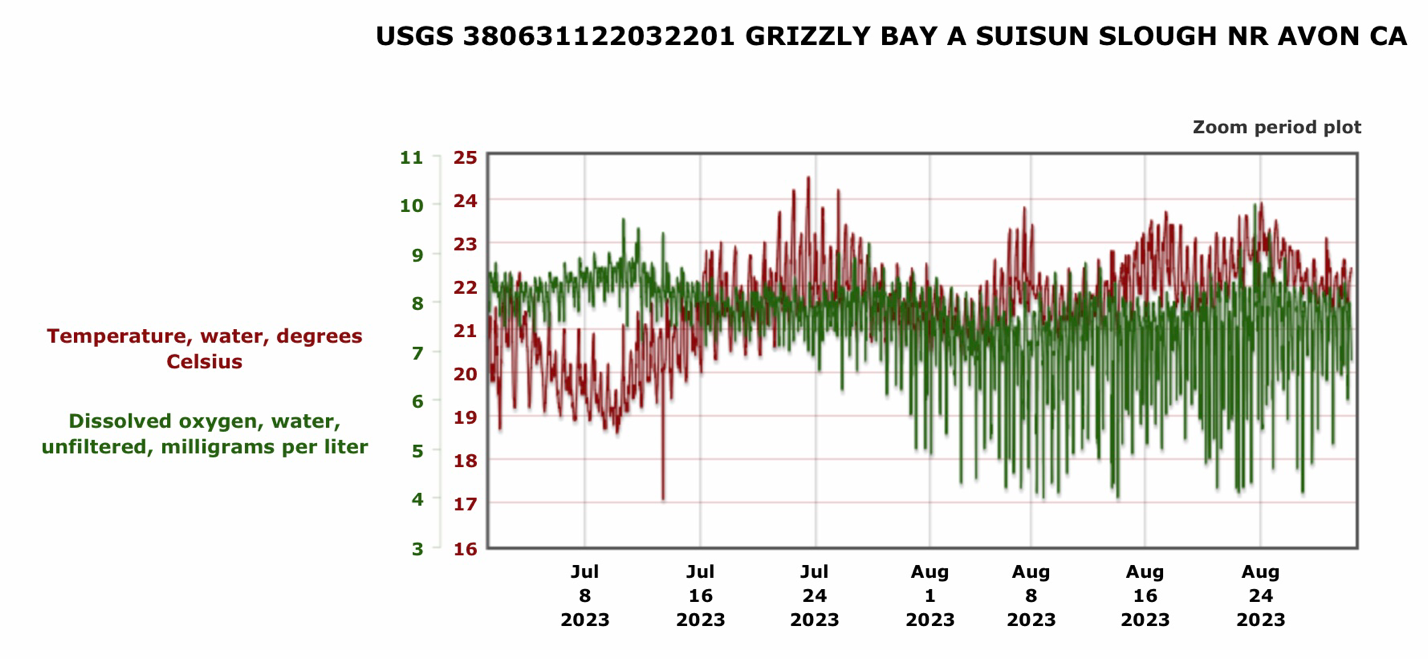
Figure 6. Hourly dissolved oxygen levels in Grizzly Bay in summer 2023. Note inverse relationship with chlorophyll levels in Figure 4. The low dissolved oxygen levels (<5 mg/l) began with the first bloom (August 1) and continued through August. Also note the Bay water quality standard is a minimum 6 mg/l dissolved oxygen level for fish health.

Satellite imagery of chlorophyll levels in San Francisco Bay on 8/29/2023.

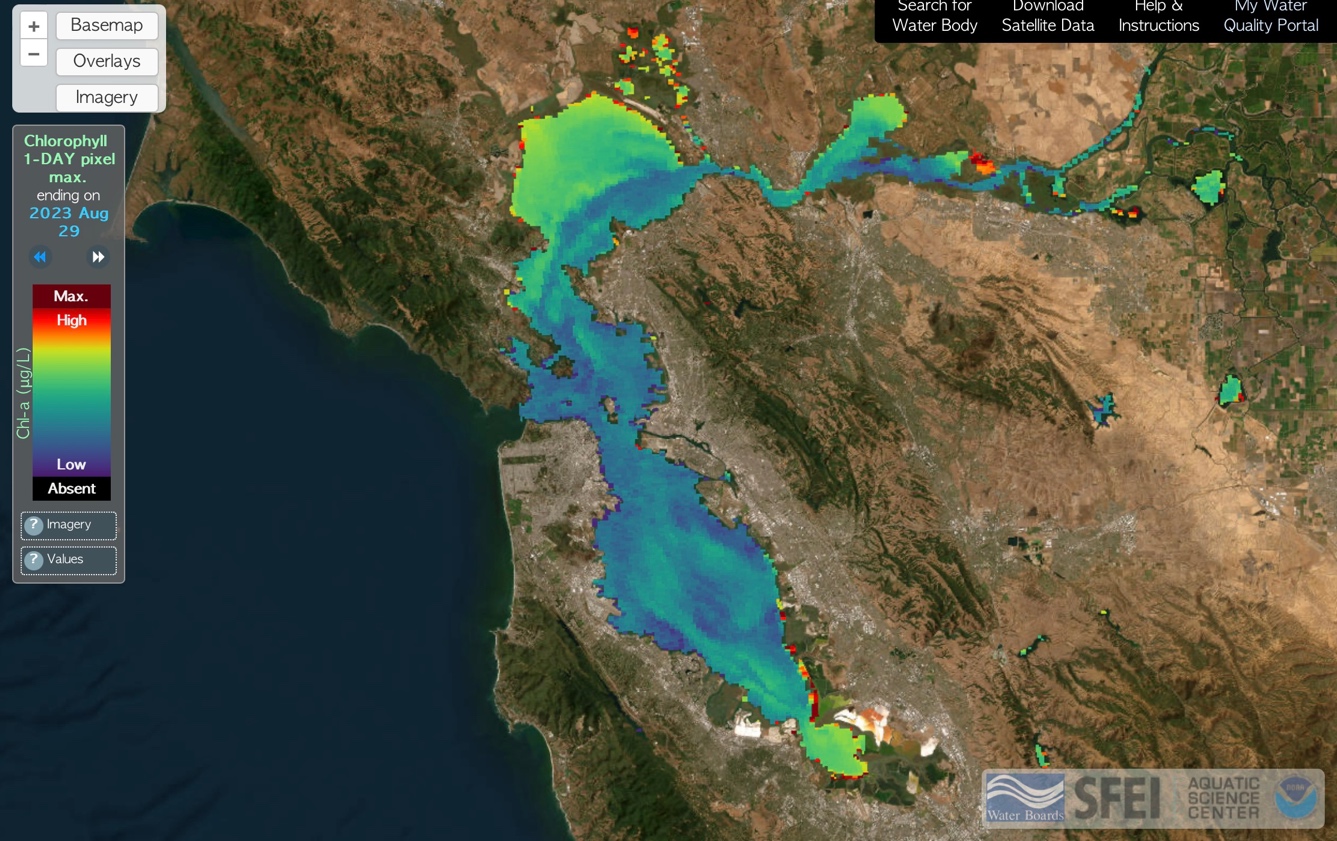
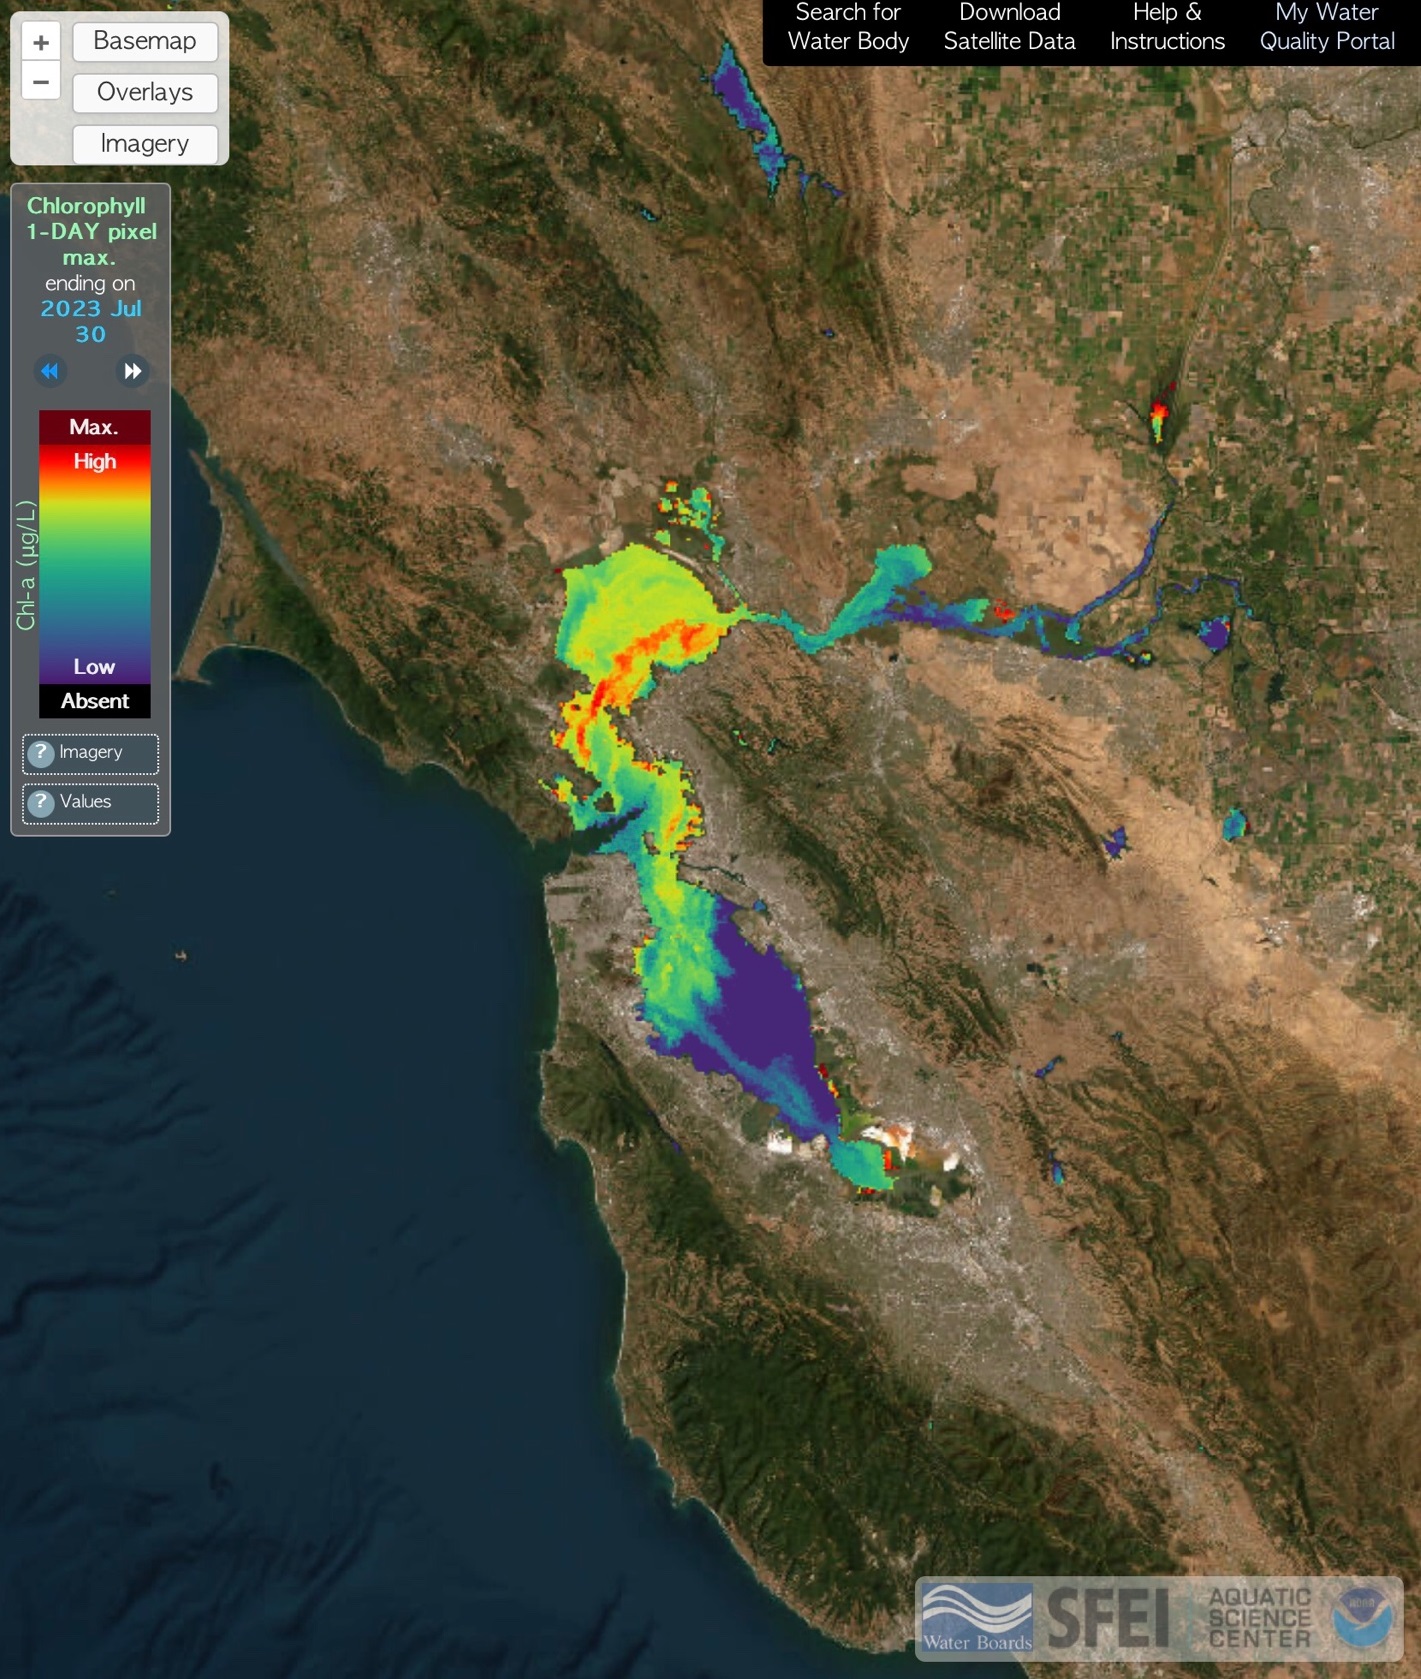
Figure 7. Satellite imagery of chlorophyll levels in San Francisco Bay on 8/29/2023.

Graph of water temperature, chlorophyll, and salinity in Suisun Bay in summer 2023.

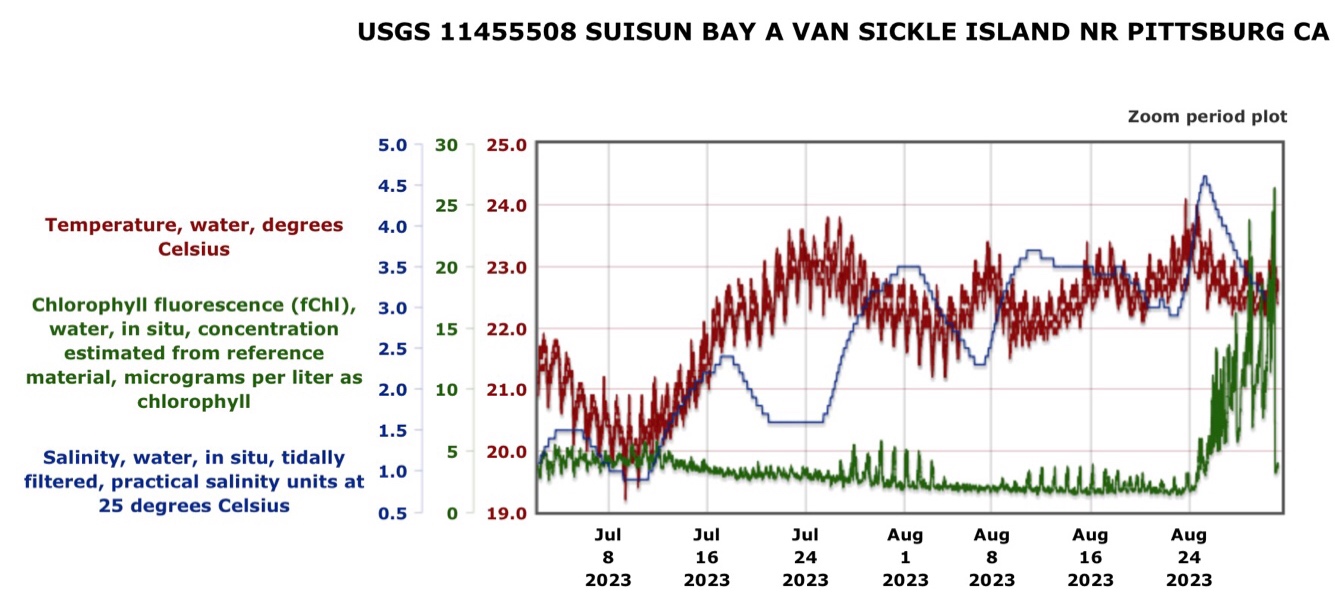
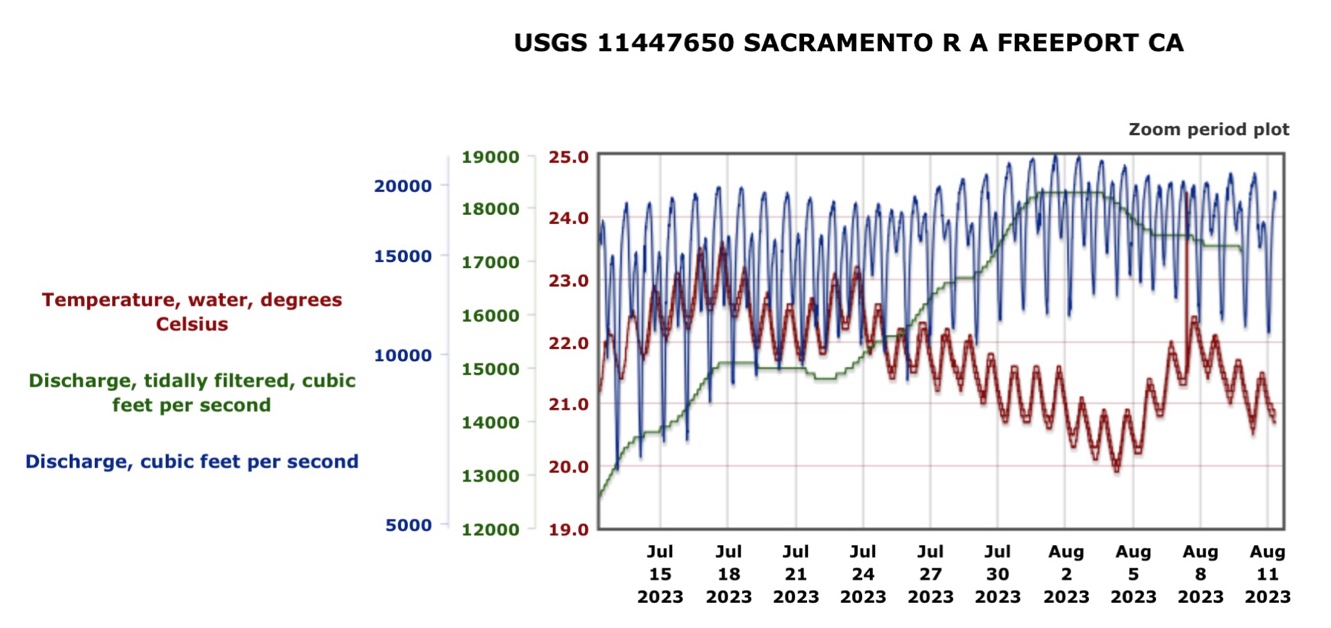
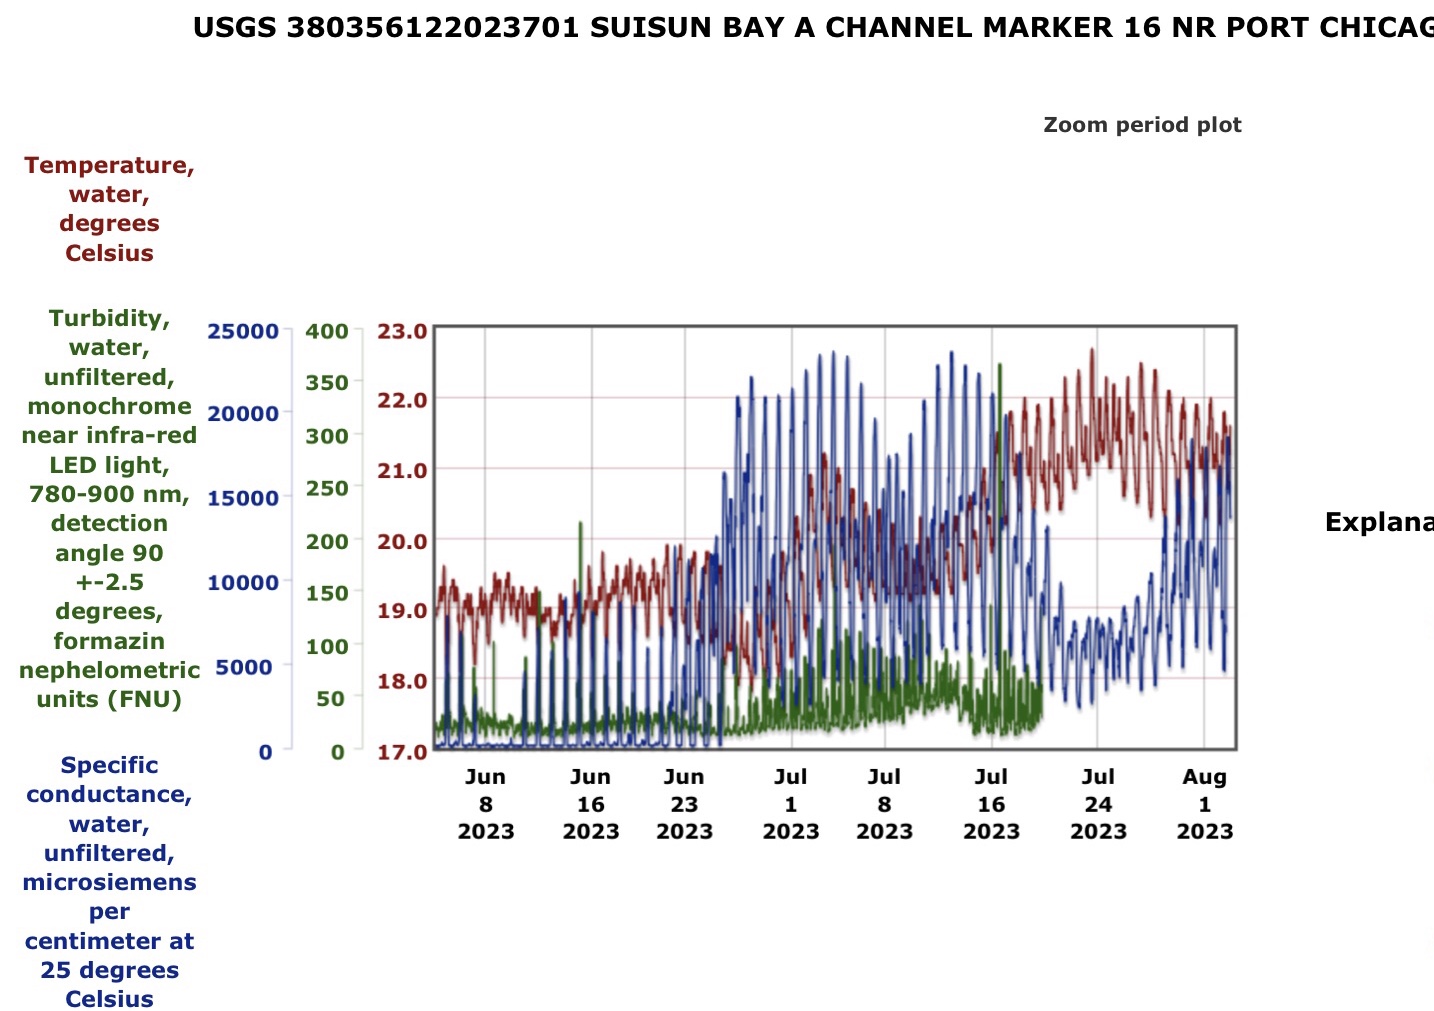
Figure 8. Water temperature, chlorophyll, and salinity in Suisun Bay in summer 2023. Note algal bloom in late August that began after the late-August draining of the Delta into the Bay when water temperatures reached 24oC (75oF).

Graph of San Francisco Bay water temperatures from 2007-2023.

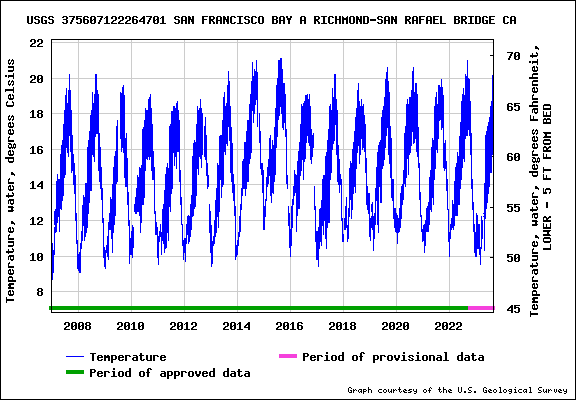
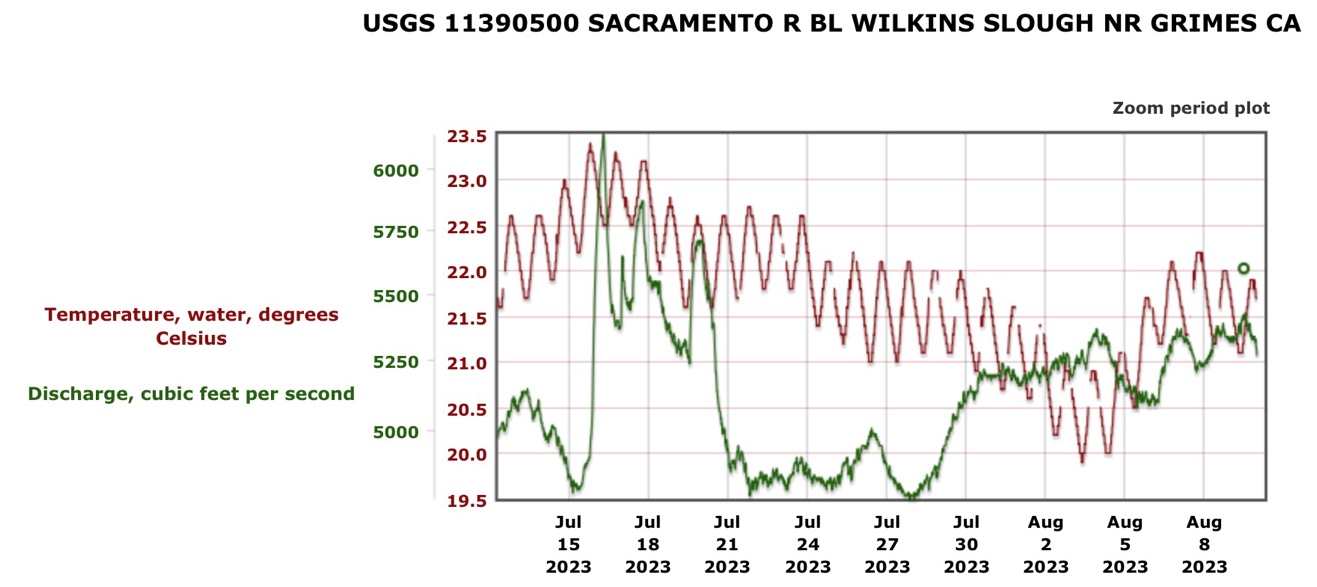
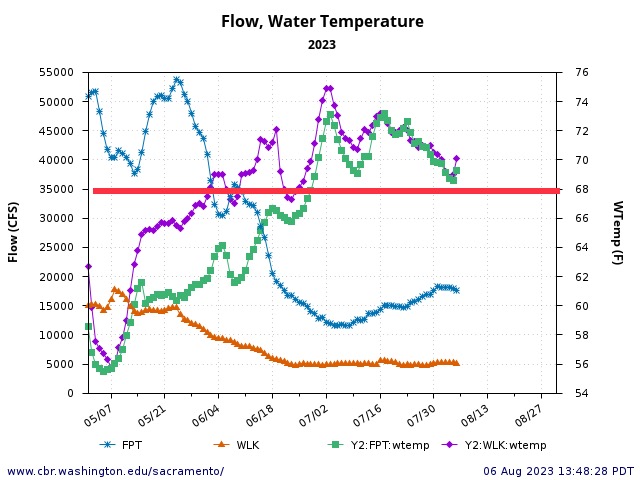
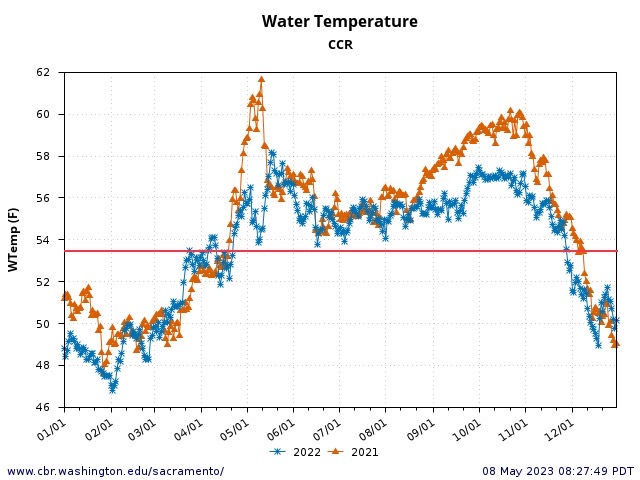
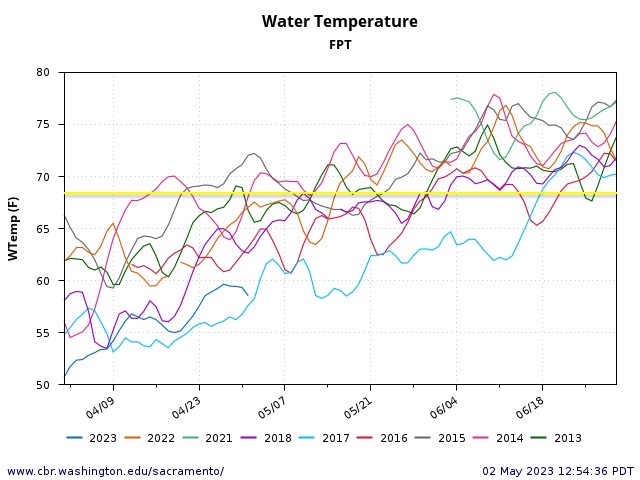
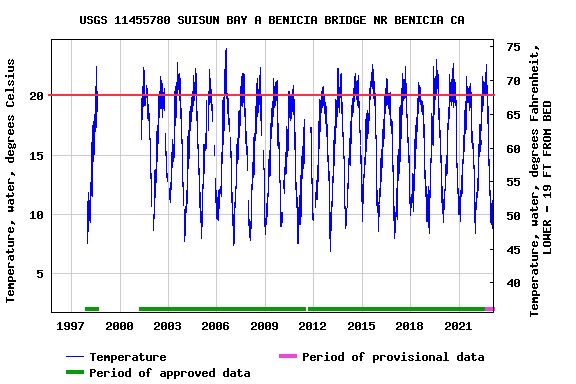
Figure 9. San Francisco Bay water temperatures from 2007-2023. Note 2023 reached 70oF (see Figure 2) a recent record reached not even reached in critical drought years 2014, 2015, and 2022.

  1. Spring tides always happen when the Moon is at the full or new phase, which is when the Sun, Moon and Earth are in alignment. Neap tides occur around the first and last quarter phase of the Moon, when the Moon’s orbit around Earth brings it perpendicular to the Sun.
  2. https://calsport.org/fisheriesblog/?p=4398
  3. https://www.sfchronicle.com/climate/article/fishkill-18279379.php

Sturgeon Moon 2 – August 30

In an August 9 post, I described the effects on San Francisco Bay and its sturgeon from the August 1 Sturgeon Moon.  I hypothesized that the draining of warm water from the Delta into the Bay over several days of the strong neap tide during the Sturgeon Moon caused an algae bloom and unseasonably warm water in the Bay (Figure 1) that was killing sturgeon, as it had in summer 2022.  I blamed the warm water on low river flows and high water diversions in the Central Valley that caused the Delta to reach 75oF and the Bay to subsequently reach an unprecedented 72-73oF.  The warm water, abundant sunshine, and generally high nutrients caused the bloom and the low dissolved oxygen levels that resulted in fish dying.

These events are about to reoccur with the August 30 Super Moon.  Once again, warm water will drain from the Delta on several days of strong neap tides the week before the Super Moon (probably around August 24).   The bloom should appear about August 28, about two days before the full moon.

The key question is how warm the Delta will be when it drains into the Bay.  This depends on air temperatures, river flows, and Delta outflow (the product of reservoir releases, Delta inflow, and water diversions).  With an expected general heat wave August 14-17, there is reason to be concerned that water draining from the Delta could be warm once again.

There have been several mitigating factors since the August 1 Super Moon.  Reservoir releases have increased slightly over the past month (Figure 2).  The strength of the spring and neap tides has decreased slightly following the August 1 full moon (Figure 2).  Higher Delta inflows (Freeport) have reduced Delta water temperatures slightly (Figure 3).

To minimize the strength of the potential bloom, warming, and fish die-off in the Bay, it is essential to keep Delta water temperatures down before the August 25-26 neap tide.  Several interdependent actions come to mind: (1) Increase lower Sacramento River flows over the next 10 days by several thousand cfs to get Wilkins Slough water temperatures down to about 68oF.  (2) Ensure that the extra Wilkins flow reaches the Delta at Freeport to keep Delta inflow up several thousand cfs.  (3) Increase Delta outflow during the August 22-24 spring tide by reducing south Delta exports, to minimize the build-up of warm water in the Delta prior to when the Delta drains to the Bay on the August 25-26 neap tide.

These actions will hopefully minimize the damage caused by Central Valley water management to the Bay ecosystem and specifically to the white sturgeon population during the next Super Moon cycle.

Satellite image

Figure 1. San Francisco Bay algae bloom on July 30, 2023. Source

Graphs showing Delta inflow (Freeport) and Delta outflow to Bay in week since the August 1 Super Moon.

Figure 2. Delta inflow (Freeport) and Delta outflow to Bay in week since the August 1 Super Moon. Note the spring tide has gotten slightly stronger and Delta inflows have increased (due to increased Folsom and Oroville reservoir releases)

Graph showing Delta inflow (tidally filtered and hourly) from the Sacramento River and water temperature at Freeport July-August 2023.

Figure 3. Delta inflow (tidally filtered and hourly) from the Sacramento River and water temperature at Freeport July-August 2023.

Graph showing Lower Sacramento River streamflow and water temperature at Wilkins Slough gage July-August 2023. Water temperature remains high (>20C, 68 F) under low streamflow.

Figure 4. Lower Sacramento River streamflow and water temperature at Wilkins Slough gage July-August 2023. Water temperature remains high (>20oC, 68oF) under low streamflow.

Sturgeon Moon August 2023

It is August 2023, and the month will feature two “Super Moons.” The first full moon is called a “Sturgeon Moon,” originally coined in reference to the ease of catching sturgeon in the Great Lakes during a full moon in summer.1 Its cycle began with the quarter moon and neap tide on July 24 until the full moon on August 1.2 This year’s Sturgeon Moon was regrettably prophetic in that it coincided with a new sturgeon die-off in San Francisco Bay in summer 2023.

Last summer, there was die-off of nearly a thousand adult white sturgeon in the greater San Francisco Bay due to a toxic algae bloom. More dead white sturgeon adults have been showing up on Bay beaches again this summer.3 After analyzing data related to the die-off, I now blame the white sturgeon die-off on the Sturgeon Moon (i.e., the tides) and some complicit factors.

Why are toxic algae blooms occurring, and sturgeon dying, again this year, in a wet flood year? Toxic blooms are not supposed to occur in wet years.

Based on the information available, this summer’s die-off event is occurring during a Sturgeon Moon. The Sturgeon Moon cycle (that occurred in late July and early August this year around the August 1 full moon) causes the Delta to rapidly fill from the Bay and stop flowing (termed a spring tide). In the recent heat, all that water in the Delta and lower rivers heated up to 75ºF. Then the Sturgeon Moon cycle drained (neap tide) the Delta into the Bay. When the top three feet or so of warm Delta water all drained into the Bay, it triggered the toxic algae bloom, low oxygen, and hot water. In combination, these factors are killing the fish.

Sturgeon likely suffered their initial stress from the warm lower rivers where they spawned in May. By the time of the Sturgeon Moon, many had moved downstream into the Delta toward the cooler Bay. The emptying of the warm Delta into the Bay during the neap tide likely stimulated further movement into the Bay. Once in the Bay, the stressed sturgeon received added stress from the warm Bay and its new toxic algae bloom and hypoxia conditions. The accumulated stress from the whole series of events likely caused the die-offs observed in the past two summers.

Yes, the Sturgeon Moon, Bay pollution, and algae seeds from last years bloom played a part, but the biggest culprits were state and federal water managers, who allowed the rivers and Delta to heat up in early summer by making high water deliveries upstream of the Delta and exporting high volumes of water from the Delta.

I worry about the accuracy of the loss estimates of adult white sturgeon in the Bay. As noted in the Chronicle article cited and linked above, there may be many dead sturgeon that have gone undetected at the bottom of the Bay. Last year, as many as 1000 sturgeon were found dead. There are probably less than 10,000 adult white sturgeon left in the Bay-Delta spawning population. Sport fishermen generally harvest about a thousand each year. The California Department of Fish and Wildlife and the California Fish and Game Commission are revisiting fishing regulations this fall and may close or restrict the popular sport fishery. 4

Could these circumstances have been avoided? Yes. First by maintaining lower Sacramento River and Delta inflow temperatures (Figure 1) at or below the state water quality standard of 68ºF (20ºC) with adequate flows (greater dam releases and/or less water deliveries). The lower Sacramento River flow of 5000 cfs is far too low for early summer, especially in a wet year. Second, by maintaining Delta temperatures at least in the 20-22ºC range (there is no Delta water temperature standard) with adequate cool inflows. Third, by maintaining water temperatures in Bay below 20ºC with adequate cool Delta outflow during the spring tides. This solution would have been difficult to achieve in drought year 2022, but not in flood year 2023.

Water project managers should have foreseen the tidal patterns coming in the summer (Figure 2) and the inadequacy of the estimated flows they were providing to the Delta (Figure 3). Measured Delta outflow by USGS was actually lower than the DWR model predictions (Figure 4). Instead, water managers provided approximately 20,000 cfs of water deliveries, including near-maximum export pumping from the Delta (Figure 5). The upstream pull to the south Delta export pumps reached a peak near 10,000 cfs in interior Delta channels at the end of July (Figure 6).

The influx of warm water reached a peak at the maximum ebb tide on July 24. This can be seen in Figure 7 at the Carquinez Bridge gage, and Figure 8 in Suisun Bay. Evidence of the Bay bloom can be seen in Figure 9, as the North Bay water returned to the East Bay with its algae (chlorophyll) concentrations and low dissolved oxygen at the end of July, coinciding with the return of the spring tide. Further evidence of the bloom is indicated in Figure 10 in the low nitrogen concentrations at the end of July in Suisun Bay.

In summary, the recent reappearance of a die-off of white sturgeon in the Bay appears to have been triggered by the strong tides of the summer Sturgeon Moon draining warm water from the Delta into the Bay. The warm water, in turn, was the result of excessive water diversions upstream of the Delta and near-maximum water exports from the Delta, combined with tidal dynamics.

Graph showing flow and water temperature in the lower Sacramento River upstream of the Delta at Wilkins Slough (WLK) and at the entrance to the tidal Delta at Freeport (FPT). Red line is water quality standard for lower Sacramento River.

Figure 1. Flow and water temperature in the lower Sacramento River upstream of the Delta at Wilkins Slough (WLK) and at the entrance to the tidal Delta at Freeport (FPT). Red line is water quality standard for lower Sacramento River.

Graph showing Average daily flow and hourly stage at Rio Vista in North Delta near exit to the Bay.

Figure 2. Average daily flow and hourly stage at Rio Vista in North Delta near exit to the Bay. Note the sharp flow increase and the drop in stage on 7/24 (Delta draining under the neap tide of the initial quarter of the Sturgeon Moon.)

Graph showing Stable Delta conditions in July 2023. Inflows = (American River AFO + Lower Sacramento River at Wilkins Slough WLK + lower Feather River at Gridley GRL + lower San Joaquin river at Mossdale MSD. Outflow (DWR-DTO) = Inflow – exports. Note relatively stable conditions.

Figure 3. Stable Delta conditions in July 2023. Inflows = (American River AFO + Lower Sacramento River at Wilkins Slough WLK + lower Feather River at Gridley GRL + lower San Joaquin river at Mossdale MSD. Outflow (DWR-DTO) = Inflow – exports. Note relatively stable conditions. Note DWR outflow is calculated (not measured) from daily flows.

Graph showing Delta outflow as estimated by USGS from flow gages.

Figure 4. Delta outflow as estimated by USGS from flow gages. Note drop in Delta outflow (at the peaks in spring tides) beginning on 7/24 as shown in Figure 2, but not in Figure 3. Also note the peak outflows were higher in USGS outflows.

Graph showing South Delta SWP and CVP exports June-July 2023.

Figure 5. South Delta SWP and CVP exports June-July 2023. Note 20,000 acre-ft per day is approximately hourly average of 10,000 cfs. Maximum export rate is 11,400 cfs (approximately 23,000 acre-ft per day).

Graph showing Old and Middle River flows toward export pumps in south Delta.

Figure 6. Old and Middle River flows toward export pumps in south Delta.

Graph showing Salinity (EC), water temperature (C), and turbidity at Crockett in north Bay in June-July 2023.

Figure 7. Salinity (EC), water temperature (C), and turbidity at Crockett in north Bay in June-July 2023. Note neap tide and lower salinity, warm, clear water on 7/24-25.

Graph showing Salinity (EC), water temperature (C), and turbidity at Port Chicago in east Bay in June-July 2023.

Figure 8. Salinity (EC), water temperature (C), and turbidity at Port Chicago in east Bay in June-July 2023. Note neap tide and lower salinity and warmer water on 7/22-25.

Graph showing Salinity (EC), dissolved oxygen, and chlorophyll concentration in east Bay in June-July 2023.

Figure 9. Salinity (EC), dissolved oxygen, and chlorophyll concentration in east Bay in June-July 2023. Note bloom, higher salinity, low dissolved oxygen beginning on 7/25.

Graph showing Salinity (EC), water temperature (C), and total nitrogen at Pittsburg in east Bay in June-July 2023.

Figure 10. Salinity (EC), water temperature (C), and total nitrogen at Pittsburg in east Bay in June-July 2023. Note higher salinity and water temperature, and reduced nitrogen (from algae uptake) beginning on 7/24-25.

  1. Two supermoons will light up the night sky in August. Here’s what you need to know https://www.sfchronicle.com/bayarea/article/supermoons-two-blue-sturgeon-18270736.php
  2. Spring tides always happen when the Moon is at the full or new phase, which is when the Sun, Moon and Earth are in alignment. Neap tides occur around the first and last quarter phase of the Moon, when the Moon’s orbit around Earth brings it perpendicular to the Sun.
  3. https://www.sfchronicle.com/climate/article/fishkill-18279379.php
  4. https://ncgasa.org/2023/04/17/white-sturgeon-meeting-and-overview-from-cdfw/

Whatever Happened to Adaptive Management?

The big hype over the past several decades in the Central Valley has been Adaptive Management.  Whatever happened to it?  Did we forget about it, or simply take it for granted?  Did we rebrand it, morph it into something else?  I wrote a “white paper” on the topic for CALFED over 20 years ago.  My version was more about conducting experiments to address unknowns to help inform management decisions.

The definitions immediately below are further refinements.

Adaptive management, also known as adaptive resource management or adaptive environmental assessment and management, is a structured, iterative process of robust decision making in the face of uncertainty, with an aim to reducing uncertainty over time via system monitoring.

Above definition from Wikipedia

Adaptive management is a science-based, structured approach to improving our understanding of the problems and uncertainties of environmental and water management. (Older)

Adaptive management provides a structured approach for adaptation in a context of rapid, often unprecedented, and unpredictable environmental change. Its success depends on support from the larger social, regulatory, and institutional context, or “governance system.”   (Newer)

Above definitions from Delta Stewardship Council

The Delta Stewardship Council holds a forum every two years on Adaptive Management.  This year, the forum delves into governance.  Presenters and participants are from Delta governments and those who would like to participate in Delta government.  Topics include equitable adaptation, governance systems and needs, and human dimensions of adaptation and governance. 

While that all is nice, it is not what I am looking for to manage the Delta ecosystem.  I am more for the older definition.  We need answers.

Why are the Sacramento River and Delta so warm in the past decade or so?  Is it all climate change, drought, and air temperatures?  What has changed, and what can be done about it?  Those are my questions.  We need more adaptive management questions and some scientific experiments and monitoring.  I have analyzed much of the available data and developed theories on causes (with supporting data and analyses), but theories need testing through controlled scientific study that can lead to effective changes: adaptive management.

My theory is that we need 5000 to 10,000 cfs streamflow in the Sacramento River to keep it cool in summer.  We need to test that theory to find out how much water is really needed, and how much, when, and where under highly variable air temperatures.

Water managers have consistently opposed this kind of experiment.  They refuse to use the water for this kind of experiment.  And more importantly, they refuse to do an experiment that might produce the answer they don’t want to be known, let alone supported by rigorous study: more flow is needed.

On the contrary, there is a constant, built-in bias towards “experimenting” with how little water one can use to achieve biological objectives.  If too little water won’t achieve the desired outcome, managers, and in some cases scientists, try modifying the threshold biological objectives.

56oF was supposed to be fine for salmon spawning near Redding.  In 2021 and 2022, agencies including Reclamation thought they could get away with 58-60oF for periods (they couldn’t, Figure 1).  It turns out from controlled experiments that 56oF was too warm – 53oF is needed to keep eggs alive and well in the gravel.  There is simply no getting around it.  The agencies were experimenting with critically endangered salmon with poorly designed, un-scientific management strategies.

In the Vernalis Adaptive Management Program in the early 2000s, ten years of experimenting found that relatively small increments of flow increase in the San Joaquin River from mid-April through mid-May, combined with minimum Delta exports by the state and federal water projects, did not dramatically increase survival of San Joaquin River juvenile salmon migrating downstream.  The “adaptive” element of adaptive management did not thereafter increase the flows to see if that would improve juvenile survival.  On the contrary, water managers declared that more flows don’t help, and the Bureau of Reclamation since 2011 has serially ignored the flow requirements and export restrictions in mid-April through mid-May to which the rules were supposed to revert after the “experiment” concluded.

Here are some further questions that are begging for controlled scientific experiments, associated monitoring, and adaptive action:

What will it take to keep the spring-summer Delta water temperature in key areas (such as the low salinity zone) below 72oF, at least through spring (Figure 2)?

Is there something we can do to keep the Bay cooler in summer (Figure 3)?

There is little doubt that improving these temperatures would improve conditions for fish.  But the scientific community needs to push itself and water managers past built-in biases in order to evaluate the feasibility of such improvements.

Figure 1. 2021 and 2022 water temperatures in the Sacramento River above the mouth of Clear Creek near Redding. Red Line is safe level for salmon eggs.

Figure 2. April-June water temperatures in Sacramento River at Freeport in the north Delta in spring in past decade. Yellow line is critical level 68oF for migrating juvenile and adult salmon.

Figure 3. Water temperatures at the Benicia Bridge at the west end of Suisun Bay, 1998-2023. Red line is critical level for salmon survival during migration.


Smelt Status – Winter 2023 How Low Can You Go?

In prior posts in December 2022 and November 2021, I described the status of listed delta smelt and of longfin smelt.  More recent information shows little change in the dire outlook for these two native Bay-Delta fish (Figures 1-4).

Delta smelt and longfin smelt populations have declined severely over the past few decades due to poor water management. In the Bay-Delta, where the smelt spend most of their lives, south Delta water exports and warming of the Bay and Delta from reduced inflow and outflow has limited their production.  Temporary urgency change petitions (TUCPs) during multiyear droughts and  subsequent orders by the State Water Board have allowed reduced Delta outflow, leading to higher water temperatures and increased Delta salinity. The State Board is again considering yet another TUCP in winter 2023 that would reduce Delta outflow to allow higher exports.

In this winter 2023, the Low Salinity Zone has again moved further upstream (eastward) into the Delta because of falling freshwater inflow to the Delta after the January storms.  Delta exports have fallen with lower Delta inflows as State Board conditions kick in.  The TUCPs are an obvious and direct threat to these population remnants living in the Low Salinity Zone.  Further allowing these weakened standards to be violated is a direct disregard for these nearly extinct species.  Water management places them at extraordinary risk by (1) bringing them further into the Central-Delta zone of the two large South-Delta water diversions, (2) degrading smelt habitat with lethal water temperature, (3) further degrading their already depleted food supply, and (4) increasing the concentrations of toxic chemicals being relentlessly discharged into the Delta.

The scientific literature, and water and resource management agencies, all recognize these major problems.  Many management and recovery schemes have been developed and implemented over the decades.  However, nothing has stopped water managers’ relentless excessive use and abuse of the Central Valley hydrology.  The salmon, smelt, sturgeon, and steelhead are not just the victims but serve as “canaries in a coal mine”, all dying while the water is continually mined from the system.  Meanwhile, water managers blamed this mass extinction event on on climate change, cynically gaming worsening conditions to extract even more water.

There is more and more talk of employing “ecosystem-based management” that integrates the environment into all phases of decision-making, effectively giving the environment a seat at the tableBut the reality is more like giving the chickens a say in how the foxes manage the depopulation of the hen-house.  There is also talk about providing more flexibility in how and when water is usedallocating environmental water as “functional flows” or “environmental water storage” to optimize the ecosystem benefits of what little water is allocated for the environmentPlaced in he hands of water managers, such efforts simply give them more flexibility to game the system to their advantage.  When they think they can get more water, they just ask for it and usually get it.  One policy group proposes: “Making this work may require establishing assets for the environment—such as water budgets, reservoir storage space, and funding to restore physical habitat—that can be flexibly used to adapt to changing conditions.”  No, a piece of bread and a cup of water on the survivors’ deathbeds are all they get.  Even the water managers get to choose the physical habitat and how its restored, and how much extra water they can take as a result.

It is time to change this pattern of abuse of public trust resources by standing up to abusers in the State’s TUCPs, the Update of the Bay-Delta Water Quality Control Plan, and the public review of the Delta Tunnel Project.  The Tunnel simply adds another straw in the Delta, but further upstream, closer to the mouths of the Feather and American rivers, the main sources of Bay-Delta freshwater inflow.

Figure 1. Bay-Delta fall-midwater-trawl longfin smelt catch index 1967-2022.

Figure 1. Bay-Delta fall-midwater-trawl longfin smelt catch index 1967-2022.

Figure 2. Longfin Smelt Fall Midwater Trawl Index in recent two decades 2001-2022.

Figure 2. Longfin Smelt Fall Midwater Trawl Index in recent two decades 2001-2022.

Figure 3. Log-Log relationship for longfin smelt index year (number shown are brood year “recruits”) vs index two years prior (spawners). Red numbers represent brood years that were the product of dry water years, green numbers = normal water years, and blue = wet water years. Blue dots are six most recent years, 2017-2022: fewer spawners produce fewer recruits.

Figure 3. Log-Log relationship for longfin smelt index year (number shown are brood year “recruits”) vs index two years prior (spawners). Red numbers represent brood years that were the product of dry water years, green numbers = normal water years, and blue = wet water years. Blue dots are six most recent years, 2017-2022: fewer spawners produce fewer recruits.

Figure 4. Catch of Delta smelt in 20-mm Survey in late March 2022. Seven were captured in the north Delta just upstream of where adult hatchery smelt were released in December 2021.

Figure 4. Catch of Delta smelt in 20-mm Survey in late March 2022. Seven were captured in the north Delta just upstream of where adult hatchery smelt were released in December 2021.