A recent FISHBIO blog post1 reported on the CalNev American Fisheries Society annual meeting, where AFS members considered the subject of “off-site” release of hatchery salmon smolts. The general perception is that releases away from hatcheries and the natal river leads to high stray rates, with some estimates of stray rates as high as 90%. The blog post discusses the problems caused by straying to non-natal rivers. The blog post states a concern that the practice of off-site releases will lead to reduced population fitness and genetic diversity, and that reproductive success will be half of wild-origin fish:
“Such losses in biocomplexity are dangerous because of the many threats salmon face in the highly altered Central Valley, and the potential inability of this species to persist if faced with a major environmental disaster, which the current drought in California may foreshadow. Yet despite recommendations from the California Hatchery Scientific Review Group, who warned about increases in straying rates due to off-site releases as early as 2010, managers from across the state have responded to drought conditions by trucking salmon from hatcheries to release sites in the Delta and Bay.”
While FISHBIO’s concerns about straying and genetics are well-founded, it is a little late for the Central Valley Fall Run Chinook. Studies have shown that populations across the Valley are homogeneous, with little or no genetic diversity, and consist mainly of hatchery fish and some natural offspring of hatchery fish. There really are no viable “wild” Fall Run Chinook populations left in the Central Valley. Even runs on rivers with no hatcheries (e.g. Yuba and Cosumnes rivers) are made up almost entirely of hatchery strays.
In making the decision to truck hatchery smolts to the Bay-Delta, Federal and State fisheries managers have recognized the harsh reality that having some salmon is better than having none. No one wants to go back to the bleak escapement years of 2007 to 2009, when less than 100,000 adult salmon per year returned to the Central Valley (compare with 870,000 in 2000 and 200,000-400,000 fish per year since 2009). Recent improvements were in large part due to the smolt trucking program in which 50-80% of Central Valley hatchery smolts were trucked to the Delta or Bay.
Can we have our cake and eat it too? Are there measures we can undertake to improve diversity and reduce straying? Yes, there are many, but they come with costs and with no guarantees.
The hatcheries can be more selective in the genetic material (parents) they use in producing smolts. Hatchery managers can barge smolts to the Bay to reduce straying (during barging, the smolts are suspended from barges in net pens, and thus imprinted on their natal waters during their trip downstream). Hatcheries can mark all hatchery fish to clearly differentiate between wild fish and hatchery fish (generally, hatcheries currently mark only 25% of hatchery juveniles). The Fish and Game Commission could establish mark-selective sport fisheries that allow sport harvest only of hatchery fish. The fisheries agencies could develop Wild Fall Run sanctuaries on some tributaries.
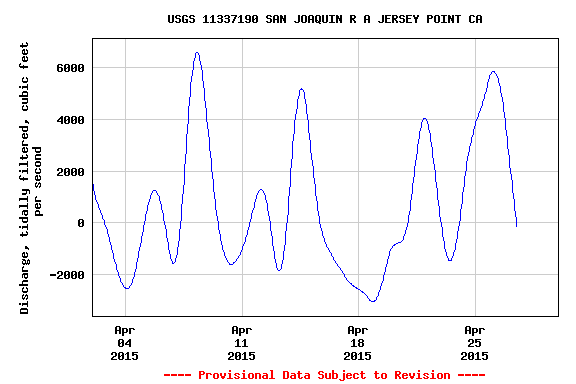
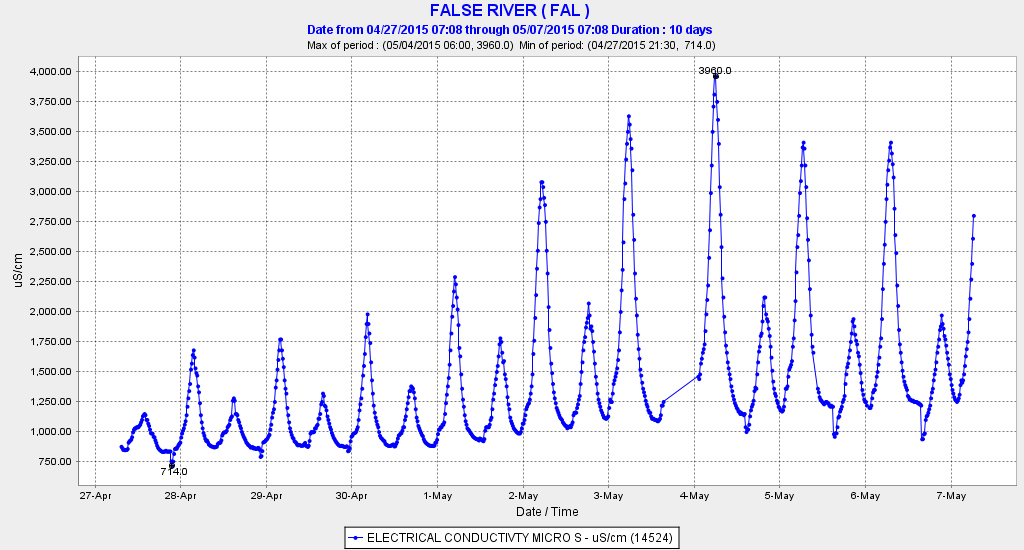
Ultimately, long-standing aspects of Delta operations must change to allow more juvenile salmon to get out of the system and more adult salmon to find their way back to natal streams. Delta exports during the spring are particularly devastating to juvenile outmigrants from the San Joaquin tributaries, including the Mokelumne, because these juveniles are drawn to the south Delta pumps. Low Delta outflow, particularly during spring, magnifies the effects of exports. Opening the Delta Cross Channel during spring may actually improve survival of San Joaquin and Mokelumne juveniles, but only when combined with high Delta outflow. Closure of the Delta Cross Channel gates during the fall, either by design or through fortuitous operational decisions, has reduced straying of Mokelumne River salmon adults to the American River, allowing multiple small pulse flows from the Mokelumne in the fall to help improve adult returns.