The Delta in April-June 2022 under TUCP

A lot has been said about the drought’s effect on water supplies for cities and farms, but little is said about how Delta fish are faring.  Freshwater inflow to the Delta was about half of normal in April through June 2022 because of the State Water Board Order approving the Department of Water Resources (DWR) and the Bureau of Reclamation’s Temporary Urgency Change Petition  (TUCP) for Delta operations.  With some of this limited Delta inflow going to water users during April, May and June, little was going to the fish.

The State Water Board granted the TUCP because Central Valley reservoir storage was so low at the end of winter in this third year of drought.  During drought, most of the Delta’s late spring and summer inflow comes from releases from storage in Shasta, Oroville, and Folsom reservoirs.

The TUCP has ended, and the normal operating rules for the Delta under Water Rights Decision 1641 have gone back into effect as of July 1.  It is now a good moment to review the effects of this most recent TUCP.

Conditions Under TUCP (April-June 2022)

Delta inflow from the Sacramento River and tributaries averaged about 7500 cfs while the TUCP was in effect (Figure 1).  Releases from Folsom Reservoir averaged 1000-2000 cfs of this inflow.  Releases from Oroville Reservoir varied widely, but averaged about 2500 cfs over the period.  Other inflow came from the Sacramento River (Shasta Reservoir) and its tributaries, which during the TUCP period averaged about 3000-4000 cfs.  The San Joaquin River and its tributaries contributed on average another 1000 cfs to Delta inflow.

There are three main uses of Delta inflow when inflow is low: repelling salt water, south Delta exports, and in-Delta use.  South Delta exports were about 1300 cfs while the TUCP was in effect.  Delta outflow, holding back the salt water, required roughly 4000 or more depending on tides.  Net in-delta use (water diversions other than south Delta exports) accounted for the rest.

Salinity (EC, mS/cm) at Emmaton (west Delta Figure 2) , normally kept near 500 per the state standard for agriculture, increased to levels ranging from 500 to 8000 (Figure 2), with daily average of 2000 to 4000, four to eight times the standard.

At Jersey Point, where the standard is 450-750 EC, salinity ranged from 1200 to 2300 in June (Figure 3).

Conditions After TUCP (Early July 2022)

After the TUCP expired, conditions changed as regulatory requirements returned requirements under Decision 1641.  Delta inflow increased to 12,500 cfs (Figure 1).  At this date, salinity has fallen toward the appropriate salinity standards (Figures 3 and 4).

What does this mean for the Delta and its Fish? 

  1. The agricultural salinity standard of 500 mmhos at Emmaton near Sherman Island in the Sacramento River channel was “relaxed” under the TUCP (Figure 3). Salt water was able to push further upstream and mix to a further extent with inflow.  The daily salinity (EC) range of approximately 500-8500 mmhos, an increased level of spring salinity not seen since the 2014 and 2015 drought under earlier TUCPs.
  2. Likewise, the average daily salinity (EC) standard at Jersey Point near Sherman Island in the San Joaquin River channel (Figure 4) was also not being met.
  3. Salinity was managed under the TUCP to meet the minimum drinking water standards (<800 mmhos) near municipal water supply diversions in the central Delta (Figure 5). (I would not drink this water or put it on plants.)
  4. Throughout June, net flows in the Old and Middle River channels in the central Delta were southward toward the South Delta export pumps (Figures 2 and 6).
  5. While the TUCP was in effect, salt water moved upstream in the Sacramento River channel near Rio Vista and into Cache Slough (Figure 7). Within the Cache Slough Complex, water moved upstream (Figure 8) in part due to water diversions in the north Delta.
  6. Delta inflows from the Sacramento River at Freeport fell below 10,000 cfs from April through June 2022 as allowed under the TUCP (Figure 1). This drop led to the increases in salinity noted in Figures 2-8.
  7. Low Delta inflows also contributed to higher water temperatures throughout the Delta during and after the TUCP period (Figures 9 and 10). Water temperatures above 72 degrees are detrimental to most of the native Delta fish.

Conclusions:

  • The TUCP allowed reduced Delta inflows that preserved some reservoir storage in critical drought year 2022.
  • Inflows dropped below the normal 10,000-12,000 range that keep Delta salinity at Emmaton and Jersey Pt below the 500 mmhos agricultural salinity standard.
  • Central and north Delta water diversions from the Delta’s pool of freshwater contributed to upstream movement and loss in quality and quantity of the low-salinity zone, a critical nursery habitat of Delta native fishes.
  • The shift in the location of these important habitats into the north and central Delta, and the associated warming from the more-eastward position and lower net flows represent a serious impact on Delta native fishes including Delta smelt, longfin smelt, green and white sturgeon, winter-run, fall-run, and spring-run salmon, and steelhead, which use these habitats through the spring and summer for rearing and migration.
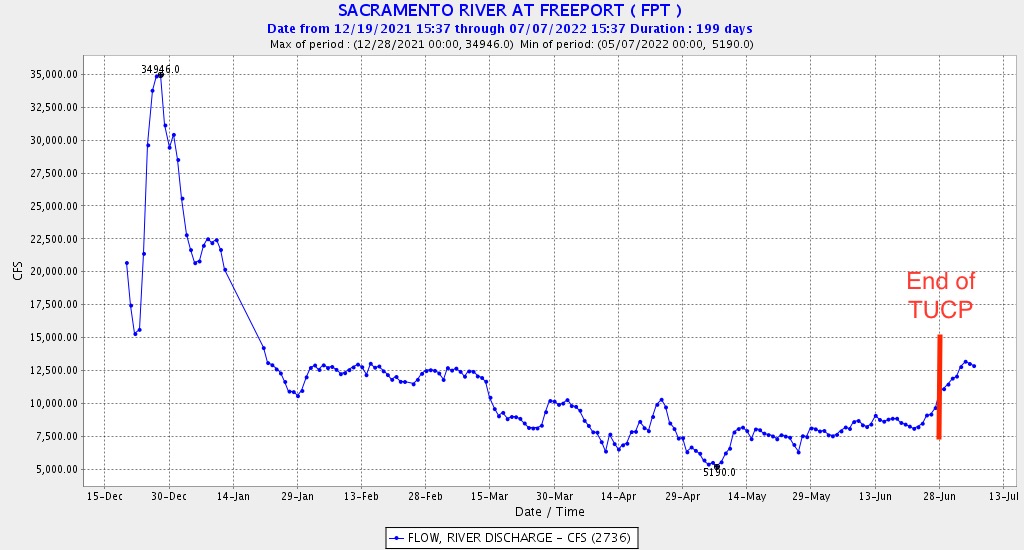
Figure 1. Delta inflow (cfs) from the Sacramento River as measured at Freeport in 2022. Note the TUCP allows streamflow at Freeport to be reduced below the 10,000-12,000 cfs range that is normally necessary to meet Delta salinity standards at Emmaton and Jersey Pt.
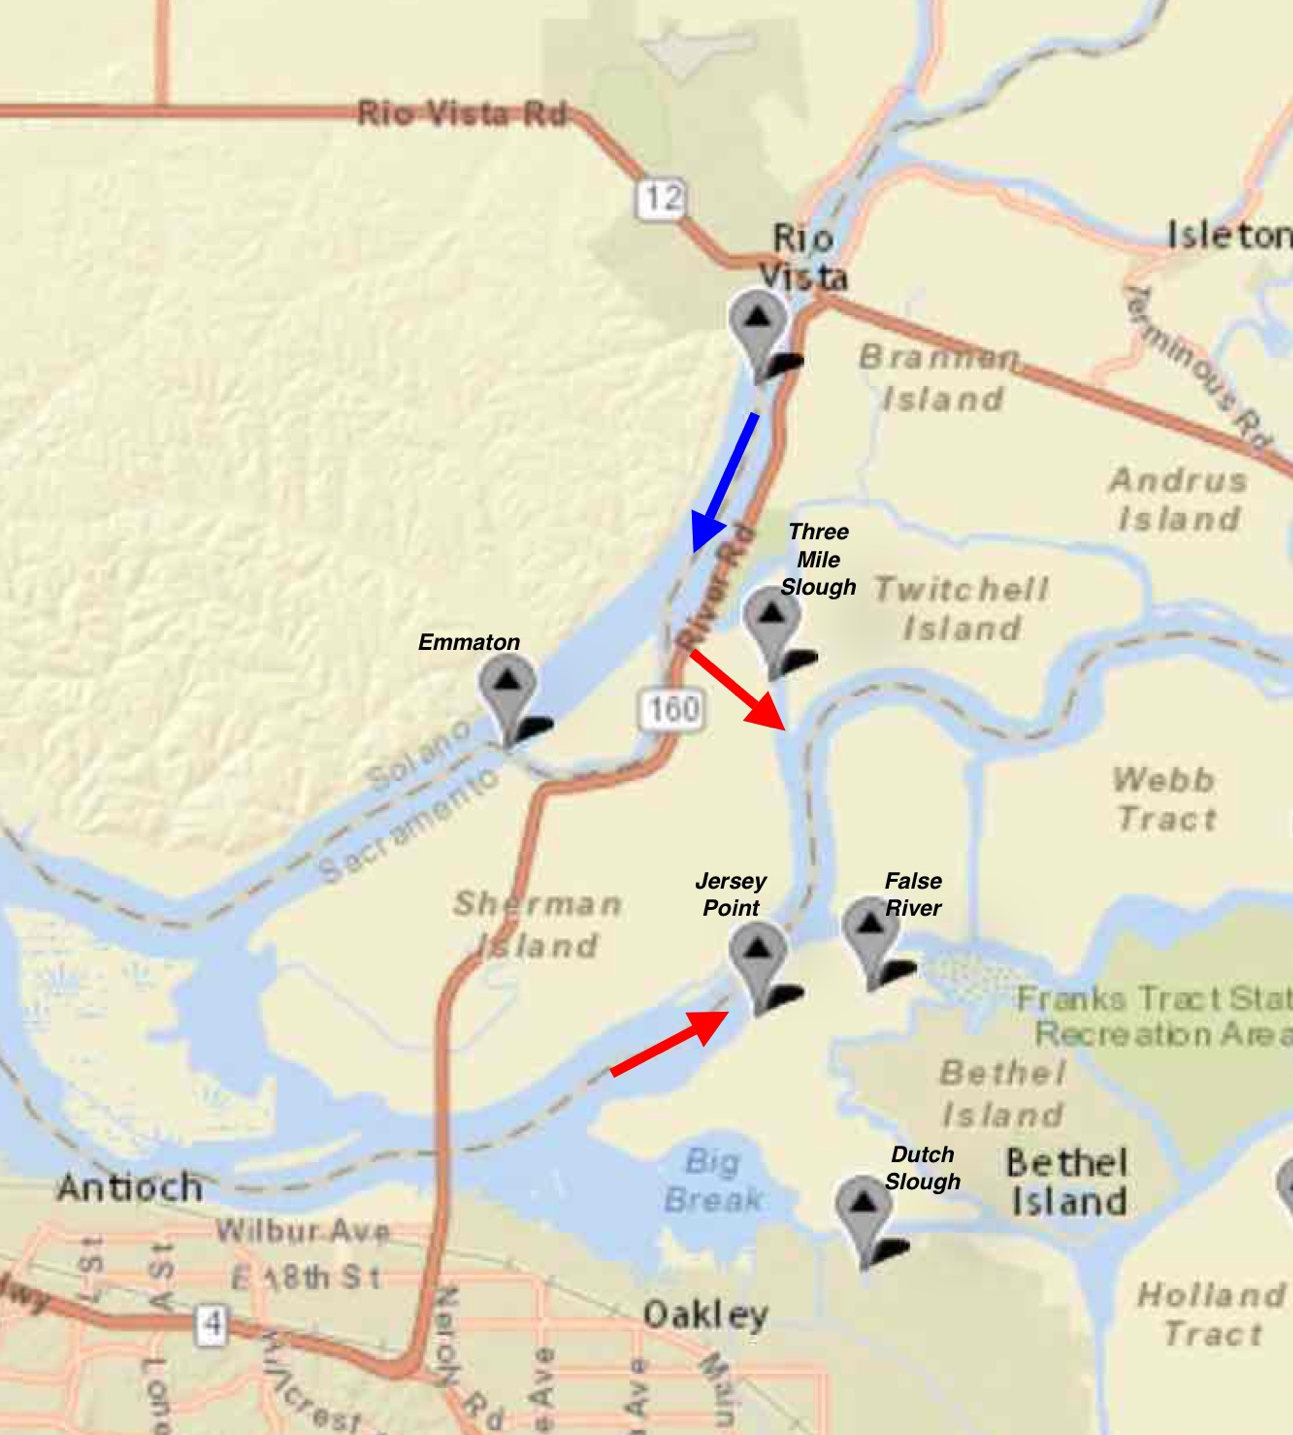
Figure 2. West Delta salinity gage locations with net flow direction during TUCP period April-June 2022.
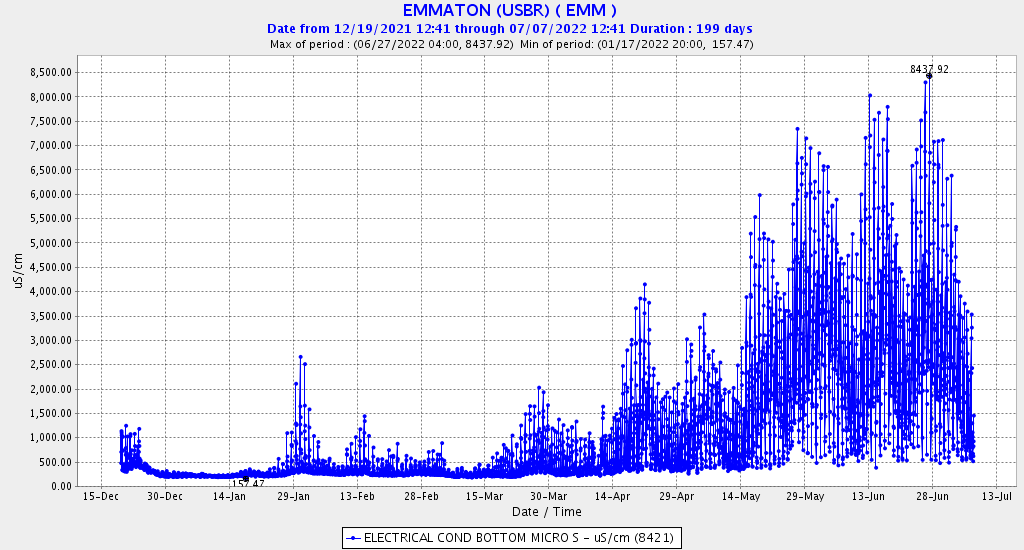
Figure 3. Salinity (EC) range at Emmaton in west Delta in 2022.
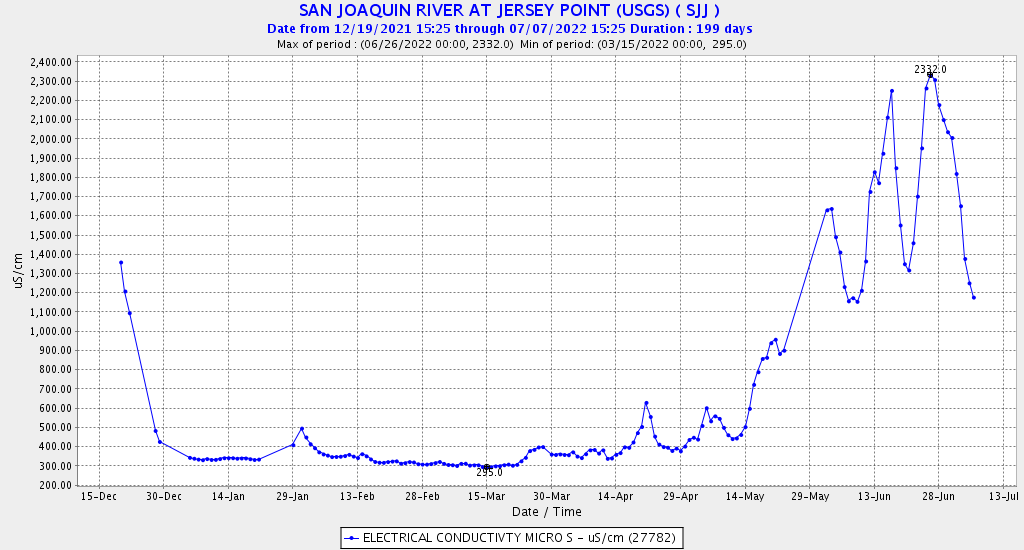
Figure 4. Salinity (EC) at Jersey Point in west Delta in 2022.
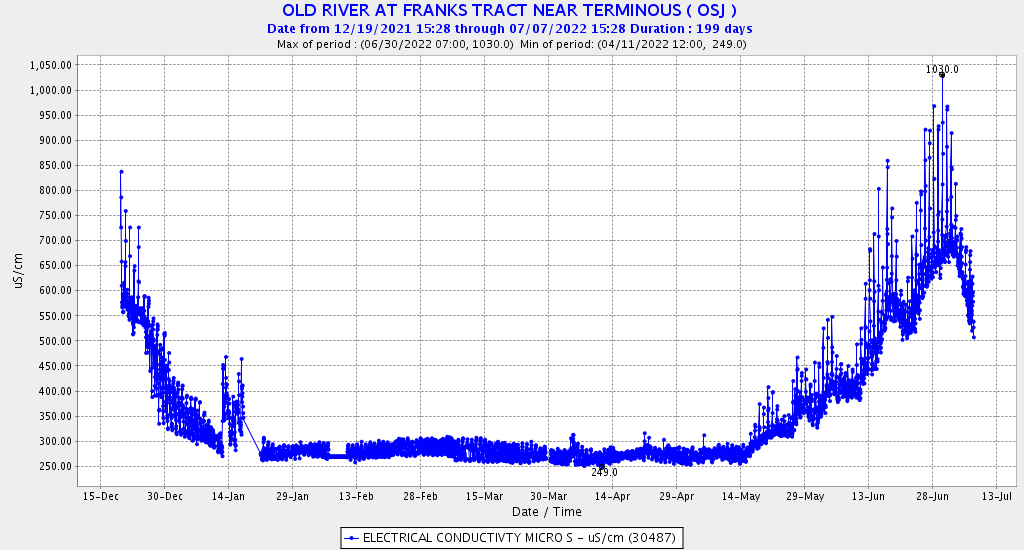
Figure 5. Salinity (EC) in the central Delta in Old River channel in 2022.
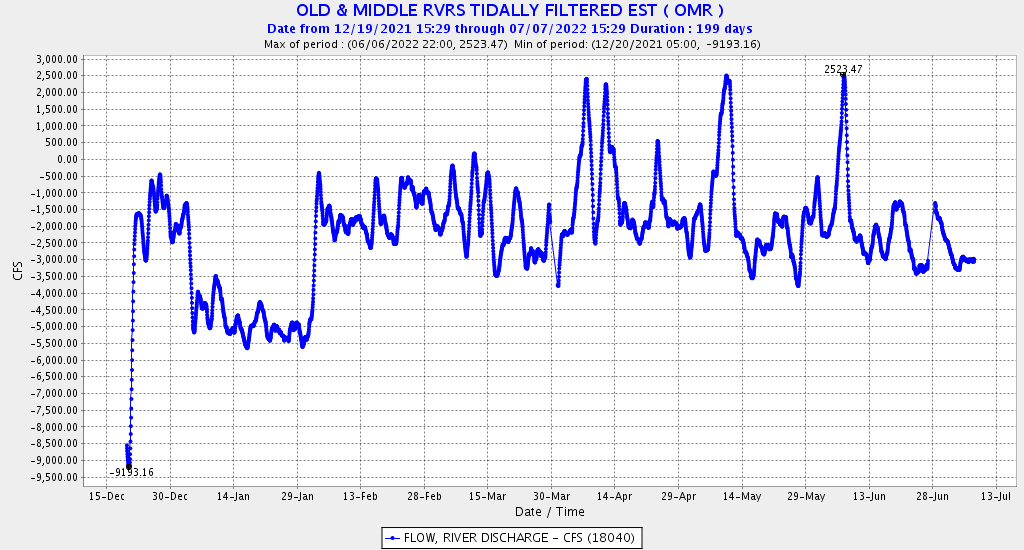
Figure 6. Net flows in central Delta Old River and Middle River channels in 2022.
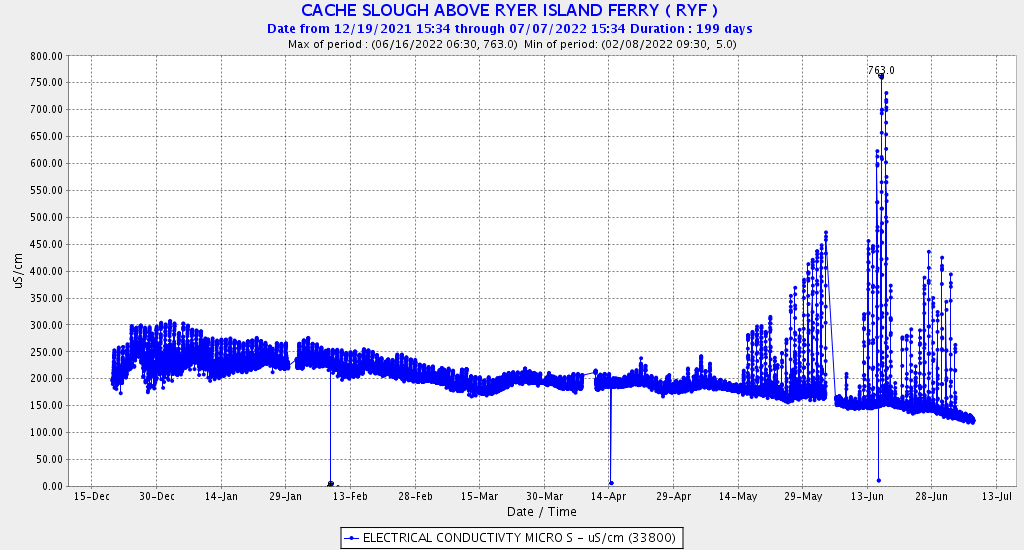
Figure 7. Salinity (EC) in Cache Slough channel of north Delta near Rio Vista in 2022.
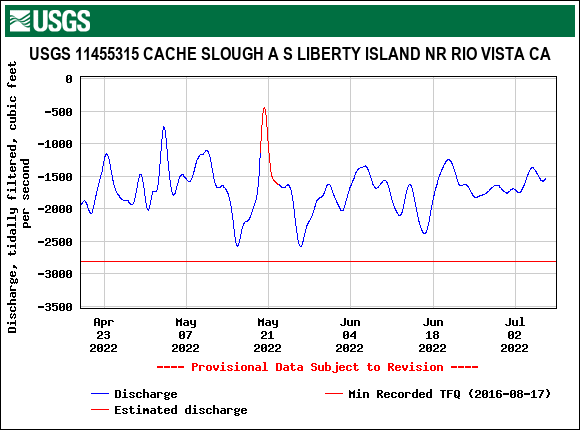
Figure 8. Net flows in Cache Slough near Liberty Island in 2022.
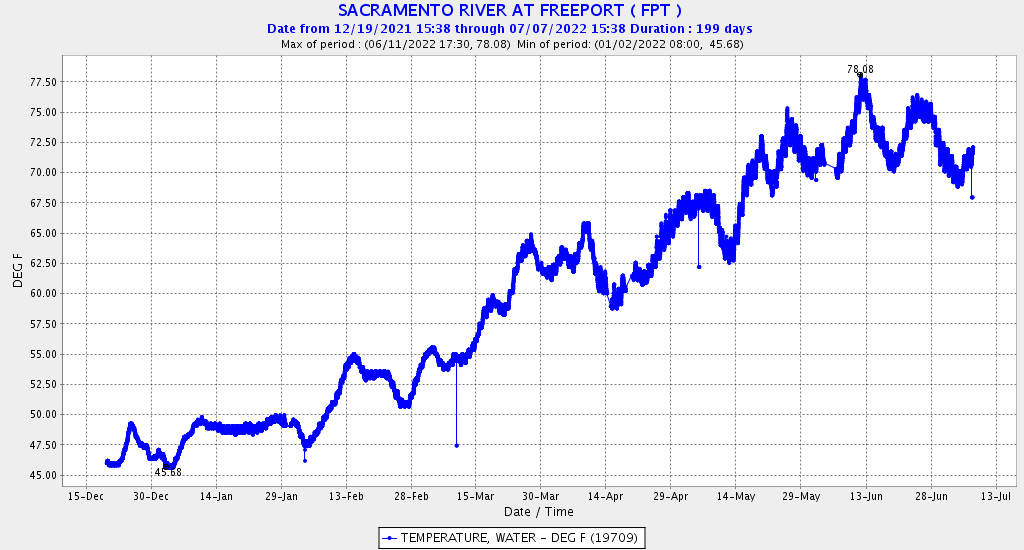
Figure 9. Water temperature of the Sacramento River near Freeport in 2022.
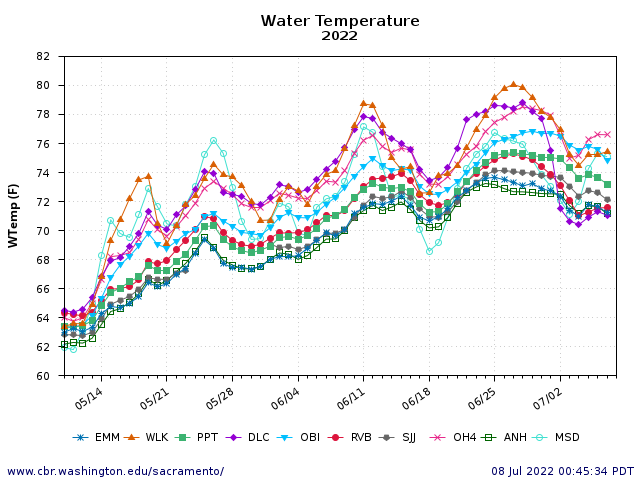
Figure 10. Water temperatures in the Delta and Delta inflows May-July 2022.

EMM – Emmaton on the Sacramento River channel in west Delta.

WLK – Lower Sacramento River below Wilkins Slough above the mouth of the Feather River.

PPT – Prisoners Pt in the central Delta channel of the San Joaquin River.

DLC – Sacramento River channel in the north Delta at the Delta Cross Channel.

OBI – Old River in central Delta.

RVB – Rio Vista Bridge in west Delta channel of the Sacramento River.

SJJ – San Joaquin channel in west Delta at Jersey Pt.

OH4 – Old River in central Delta.

ANH – San Joaquin River channel of west Delta at Antioch.

MSD – San Joaquin River channel at entrance to Delta at Mossdale.
Cache Slough Tidal Wetland Restoration – Update More misguided resource-damaging habitat restoration for an already highly altered and compromised Delta

Cache Slough Complex Restoration

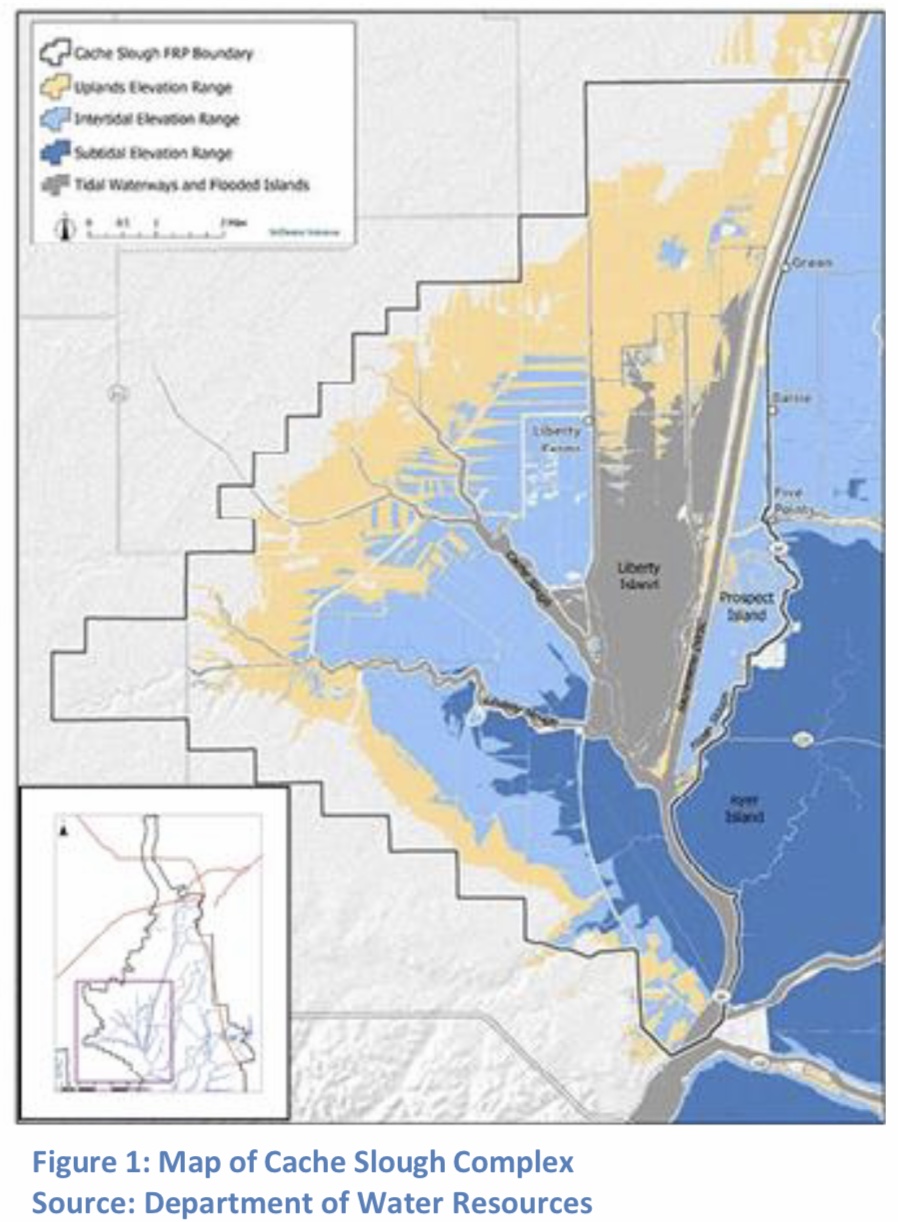
The Cache Slough Complex is in the lower (southern) Yolo Bypass in the north Delta region (Figure 1). It is the focus of the state’s tidal wetland restoration EcoRestore Program that spans 16,000 acres in the Cache Slough region of the Sacramento-San Joaquin Delta.

The 53,000-acre Cache Slough Complex is located in the northwest corner of the Sacramento-San Joaquin River Delta in Solano and Yolo counties (Figure 1). The Yolo Bypass receives inflow directly from the Sacramento River (Fremont Weir), the Colusa Basin Drain, Putah and Cache creeks, and agricultural and municipal discharges. The Cache Slough Complex exits the Yolo Bypass via Cache Slough, first connecting to the outlets of Miner and Steamboat Sloughs, before entering the tidal Sacramento River channel near Rio Vista.

The Cache Slough Complex has been identified as an area with great potential for tidal restoration as a result of its connectivity with the Yolo Bypass floodplain, suitable elevations, high turbidity, high primary and secondary productivity, and use by Delta smelt (Hypomesus transpacificus), Chinook salmon (Oncorhynchus tshawytscha), and other native fishes. Both federal and state wildlife agencies consider the Cache Slough Complex to be a prime area to advance habitat conservation to benefit endangered species in the Sacramento-San Joaquin Delta and incorporate improvements to the regional flood management system.

The latest project approved for construction is the Lookout Slough Project, a 3000-acre tidal marsh restoration immediately to the west of Liberty Island. The Project was certified by DWR in 2020 as mitigation/compensation for the Delta Tunnel Project. The Delta Stewardship Council recently denied appeals1 to the state’s certification of the Lookout Slough tidal marsh restoration project. Once completed, Lookout Slough will be the Delta’s largest single tidal habitat restoration project to date.

The Problem

Most of the tidal “restoration projects” in the Cache Slough Complex involve breeching leveed tracts of agricultural land to create subtidal or intertidal habitat. Tidal waters once confined to narrow floodplain channel are now allowed to pour through breaches onto over 10,000 acres of formerly diked farmlands. The process started between 1980 and 2000 when Little Holland Tract (1456 acres) and Liberty Island (4340 acres) levees failed and were not repaired, leaving these lands open to the tides. Because these reclaimed wetlands had subsided during active farming, most of the “restored tidelands” became sub-tidal, year-round, warm, shallow, open-water habitat. Such habitat is too warm for Delta native fishes except during the winter.

The enhanced tidal exchange and warm productive winter and early-spring habitat attracts migratory Delta native fishes like smelt, splittail, and salmon to the Cache Slough Complex. While such habitat is considered beneficial in winter, it warms excessively in spring and summer, reducing the period of quality rearing, and can reduce overall survival and production. Native fishes have succumbed to the heat, stranding in the uneven landforms, and predation by non-native warm-water fish.

The latest projects, Lower Yolo Ranch (1749 acres), Yolo Flyway Farms (300 acres), and Lookout Slough (3000 acres), will add 5000 acres of mostly shallow intertidal habitat. Tidewater will flood onto these lands twice a day to warm in the California sun and then return to cooler deep, shaded, sub-tidal sloughs long considered prime Delta smelt and salmon rearing habitat. Not only will the new inter-tidal “wetlands” be too warm, but they will contribute to warming adjacent sub-tidal sloughs that convey water to and from other parts of the north Delta. This water quality degradation gets worse with each new project and has resulted in the degradation of the entire north Delta as a viable spawning, rearing, and critical habitat of Delta smelt. The effect has measurably contributed to the near extinction of Delta smelt.

The Evidence

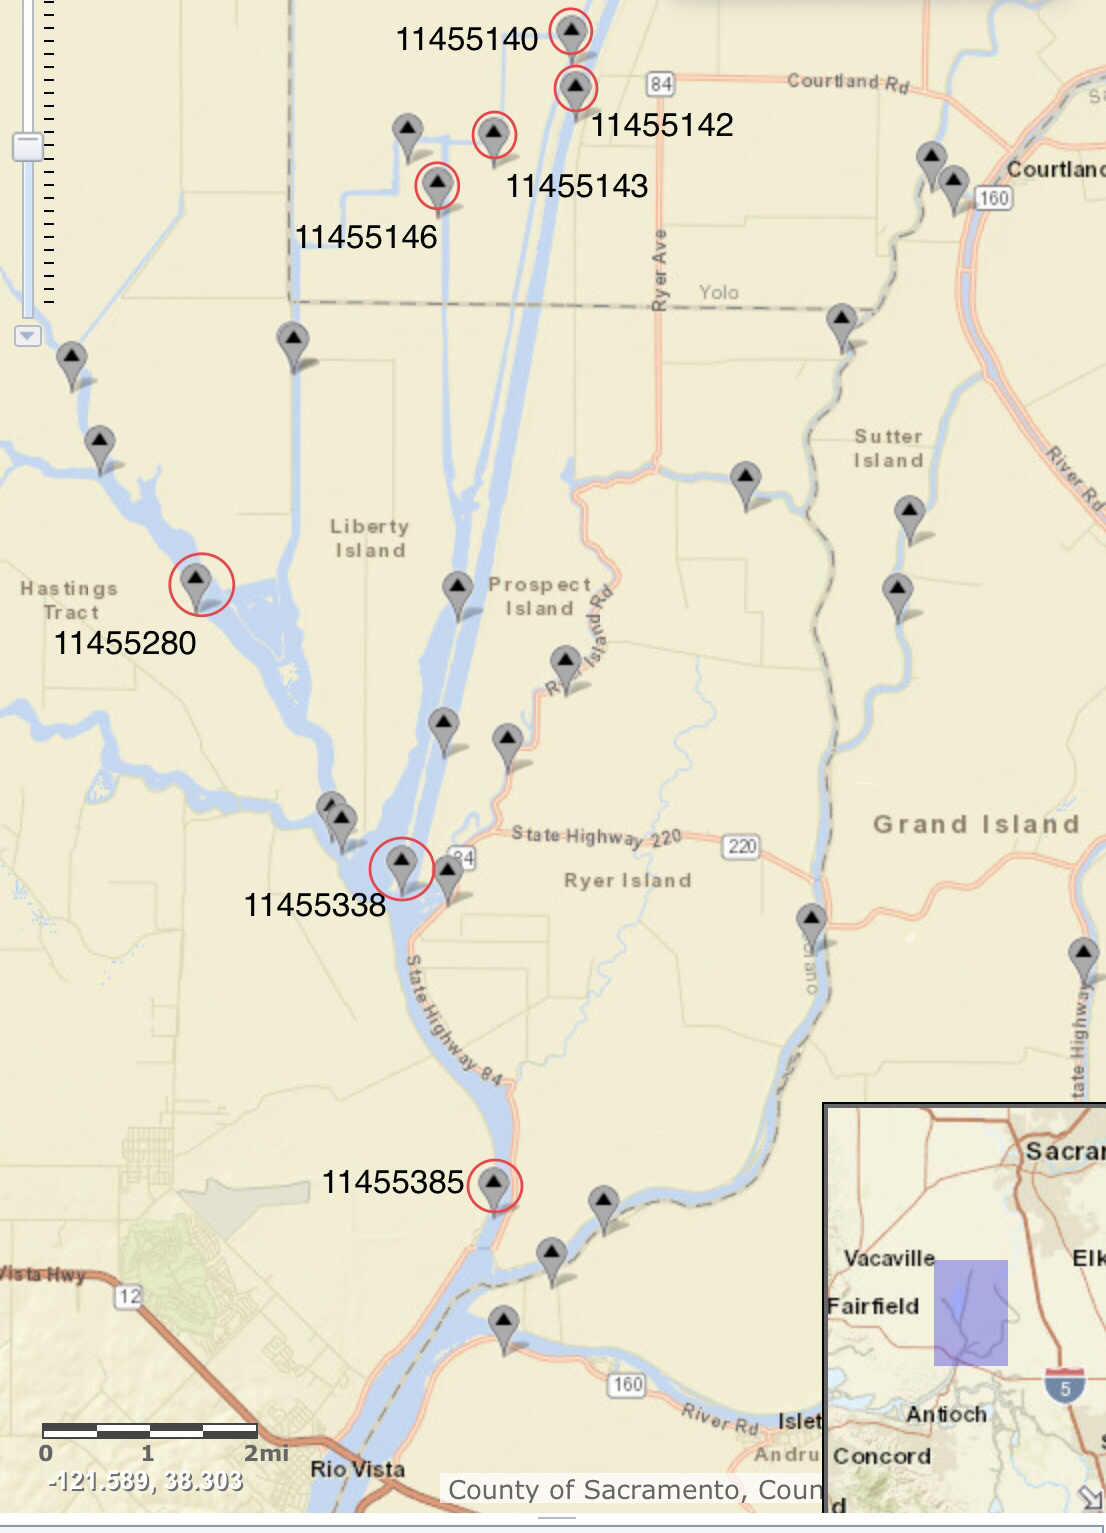
The United States Geological Service has many water quality and flow monitoring gages in the Cache Slough Complex (Figure 2) that provide considerable evidence of the above-described problem. Specific gages with pertinent data records reviewed for this post are highlighted in Figure 2.

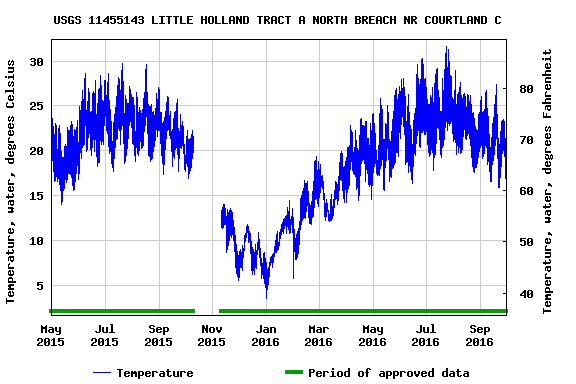
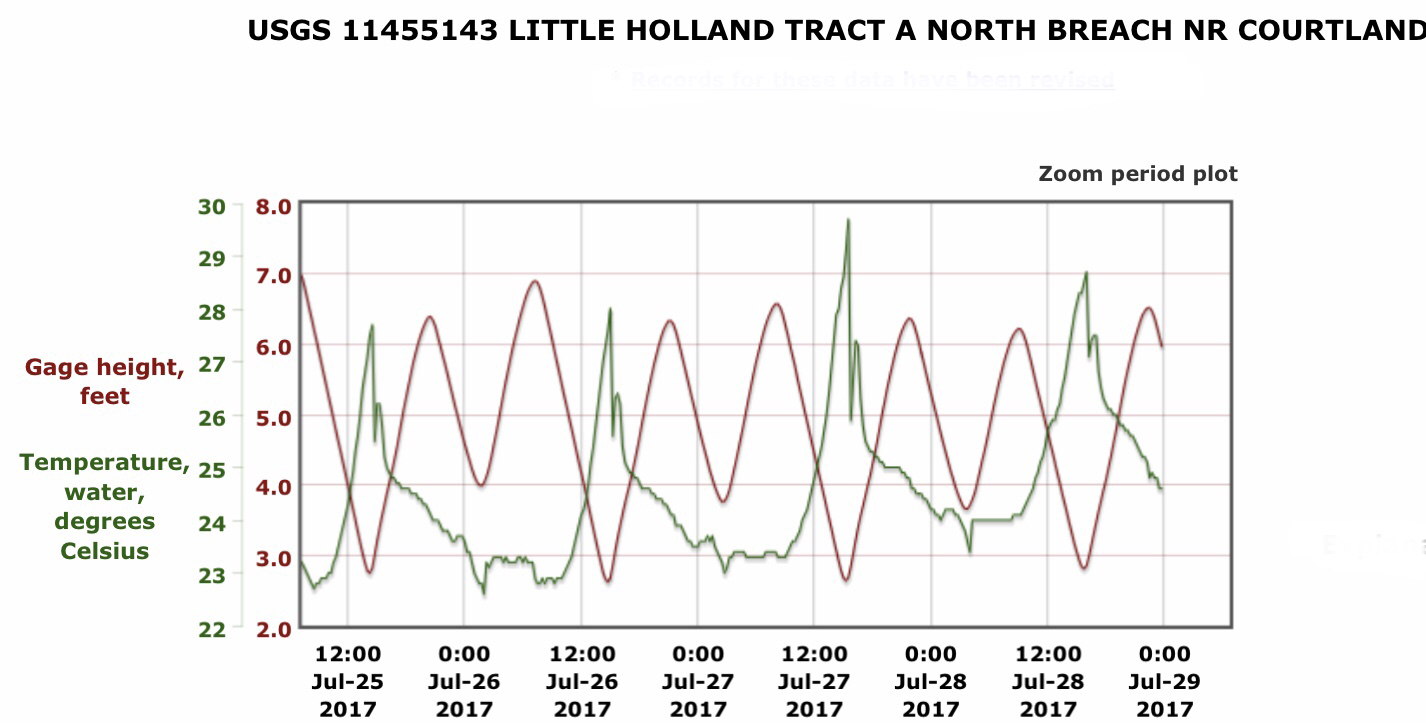
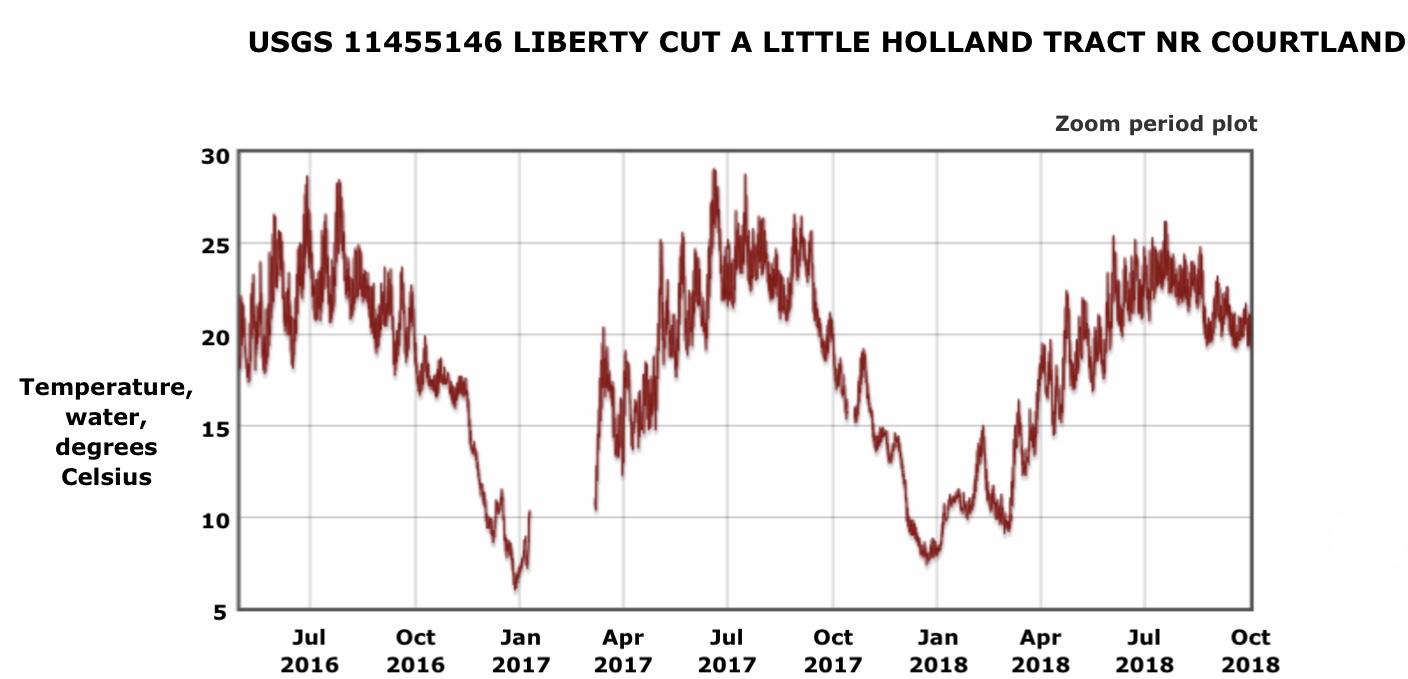
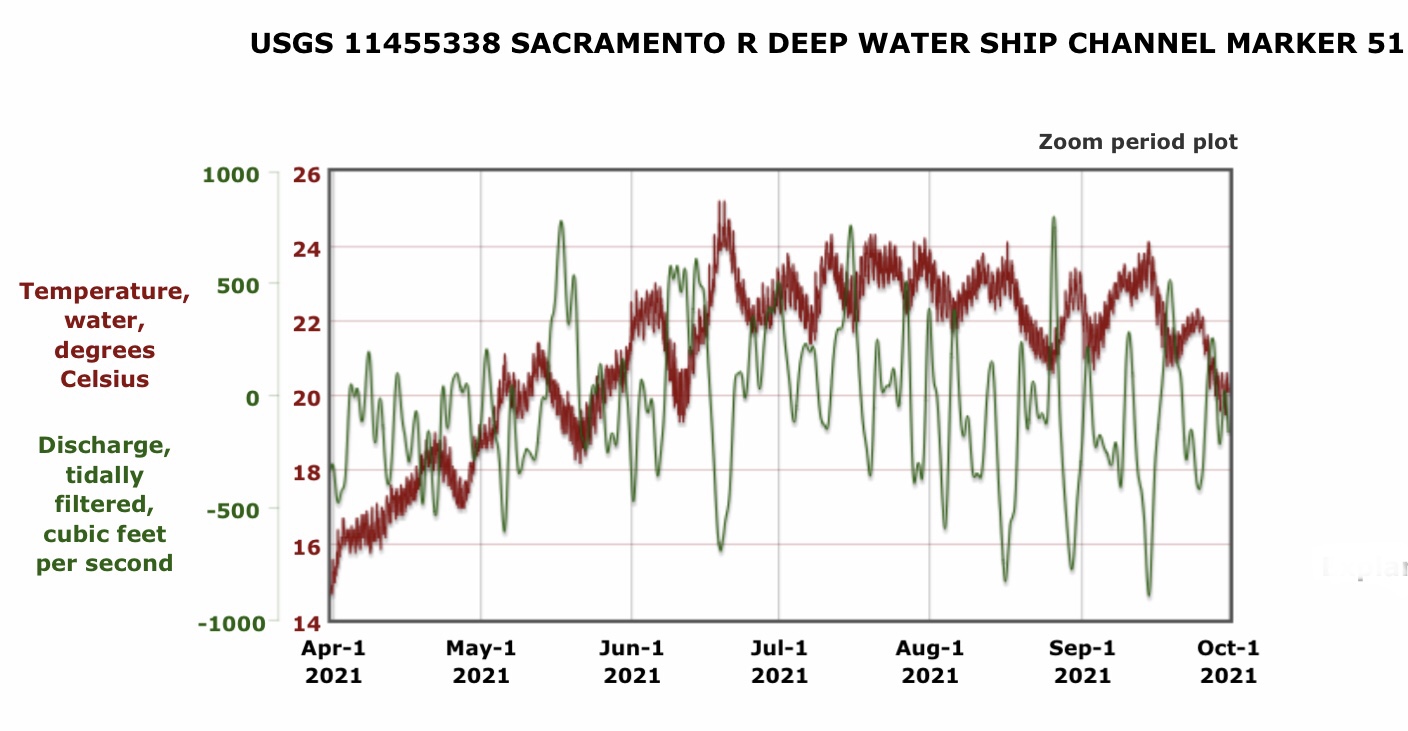
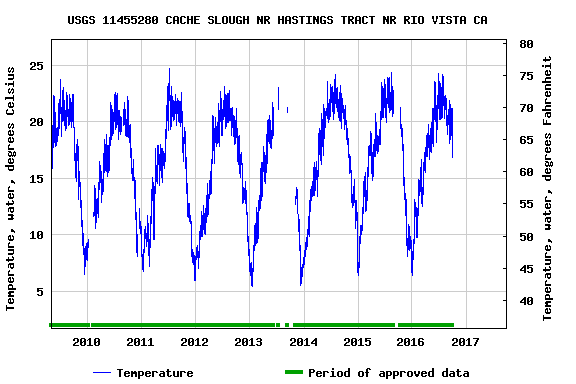
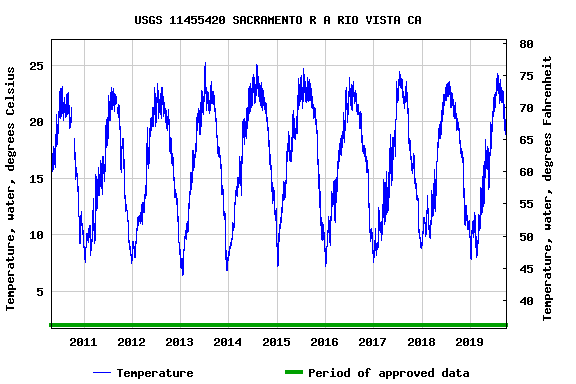
Waters in the northern Cache Slough Complex become too warm for salmon and smelt (>20ºC) by spring (Figure 3). In summer (Figure 4), water tidally flooded into subtidal island-tracts can warm 5-7ºC over a day before draining back into adjacent sloughs. Water temperatures in the northern sloughs of the Cache Slough Complex reach 25ºC (lethal to smelt) or higher in summer, even in wet and normal water years (2016-2018, Figure 5). Water temperatures in the southern Cache Slough Complex are only slightly lower (Figure 6). Over the past decade, water temperatures in the Cache Slough Complex overall have been gradually increasing (Figures 7 and 8), to the detriment of Delta native fishes.

The Solution

The problem can be lessened or even reversed at existing and future restoration projects by:

  1. Limiting tidal access to sub-tidal sites to winter, when water and air temperatures are colder.
  2. Building projects with flow-through tidal channel features rather than a single opening.
  3. Ensuring that projects are inter-tidal with small, narrow, shaded channels, or tule benches.
  4. Narrowing, deepening, and shading connecting tidal sloughs.
  5. Limiting discharge of warm agricultural wastewater into tidal channels.
  6. Providing supplementary inflow of Sacramento River water from the Fremont Weir, from the entrance gates of the Sacramento Deepwater Shipping Channel, or from other locations.
  7. Retrofitting existing restoration sites and designing future projects as outlined above.


Figure 2. USGS gage locations in the Cache Slough Complex.

Figure 3. Water temperatures recorded at Little Holland Tract in 2015-16.

Figure 4. Water temperatures and water surface elevation (gage height) recorded at Little Holland Tract in July 2017. Note higher water temperature spikes occurred with strongest ebb (draining) tides.

Figure 5. Water temperature in Liberty Cut adjacent to Little Holland Tract, 2016-18.

Figure 6. Water temperature and tidally-filtered flow rate in Sacramento Deepwater Ship Channel, April-September 2021.

Figure 7. Water temperature in lower Cache Slough, 2011-2016.

Figure 8. Water temperature in the lower Sacramento River channel near Rio Vista, 2010-2019.

Yolo Flyway Farms Tidal Wetland Restoration Project

Yolo Flyway Farms

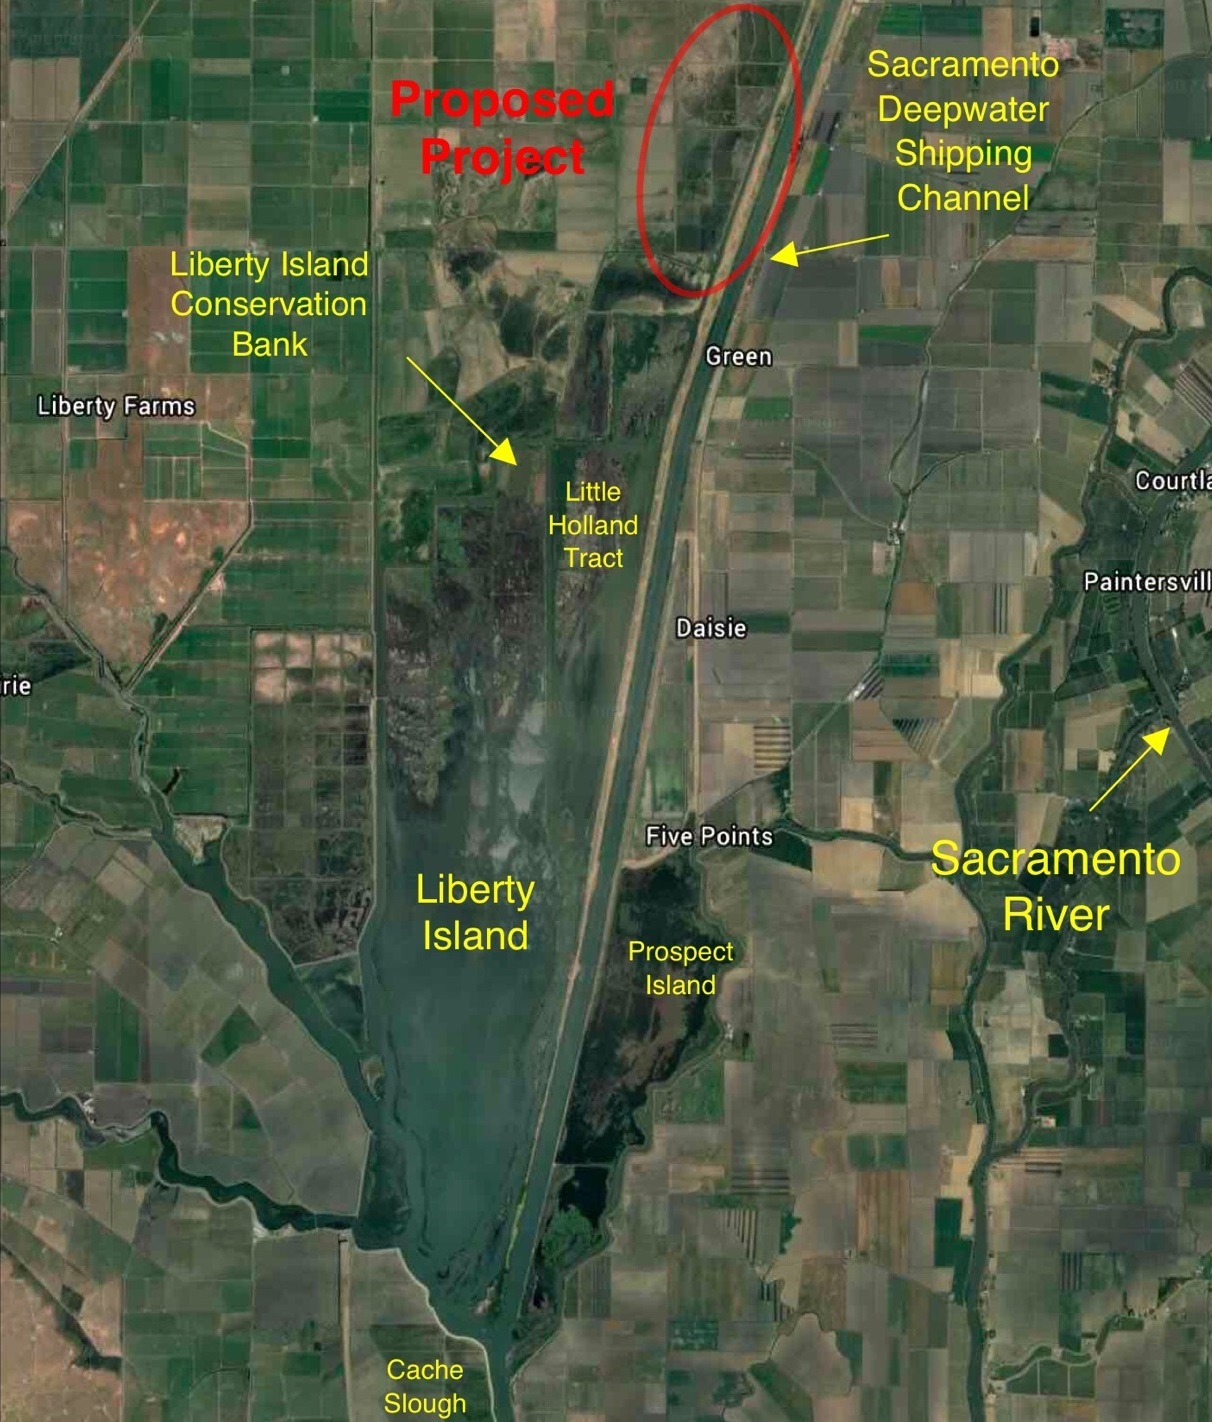
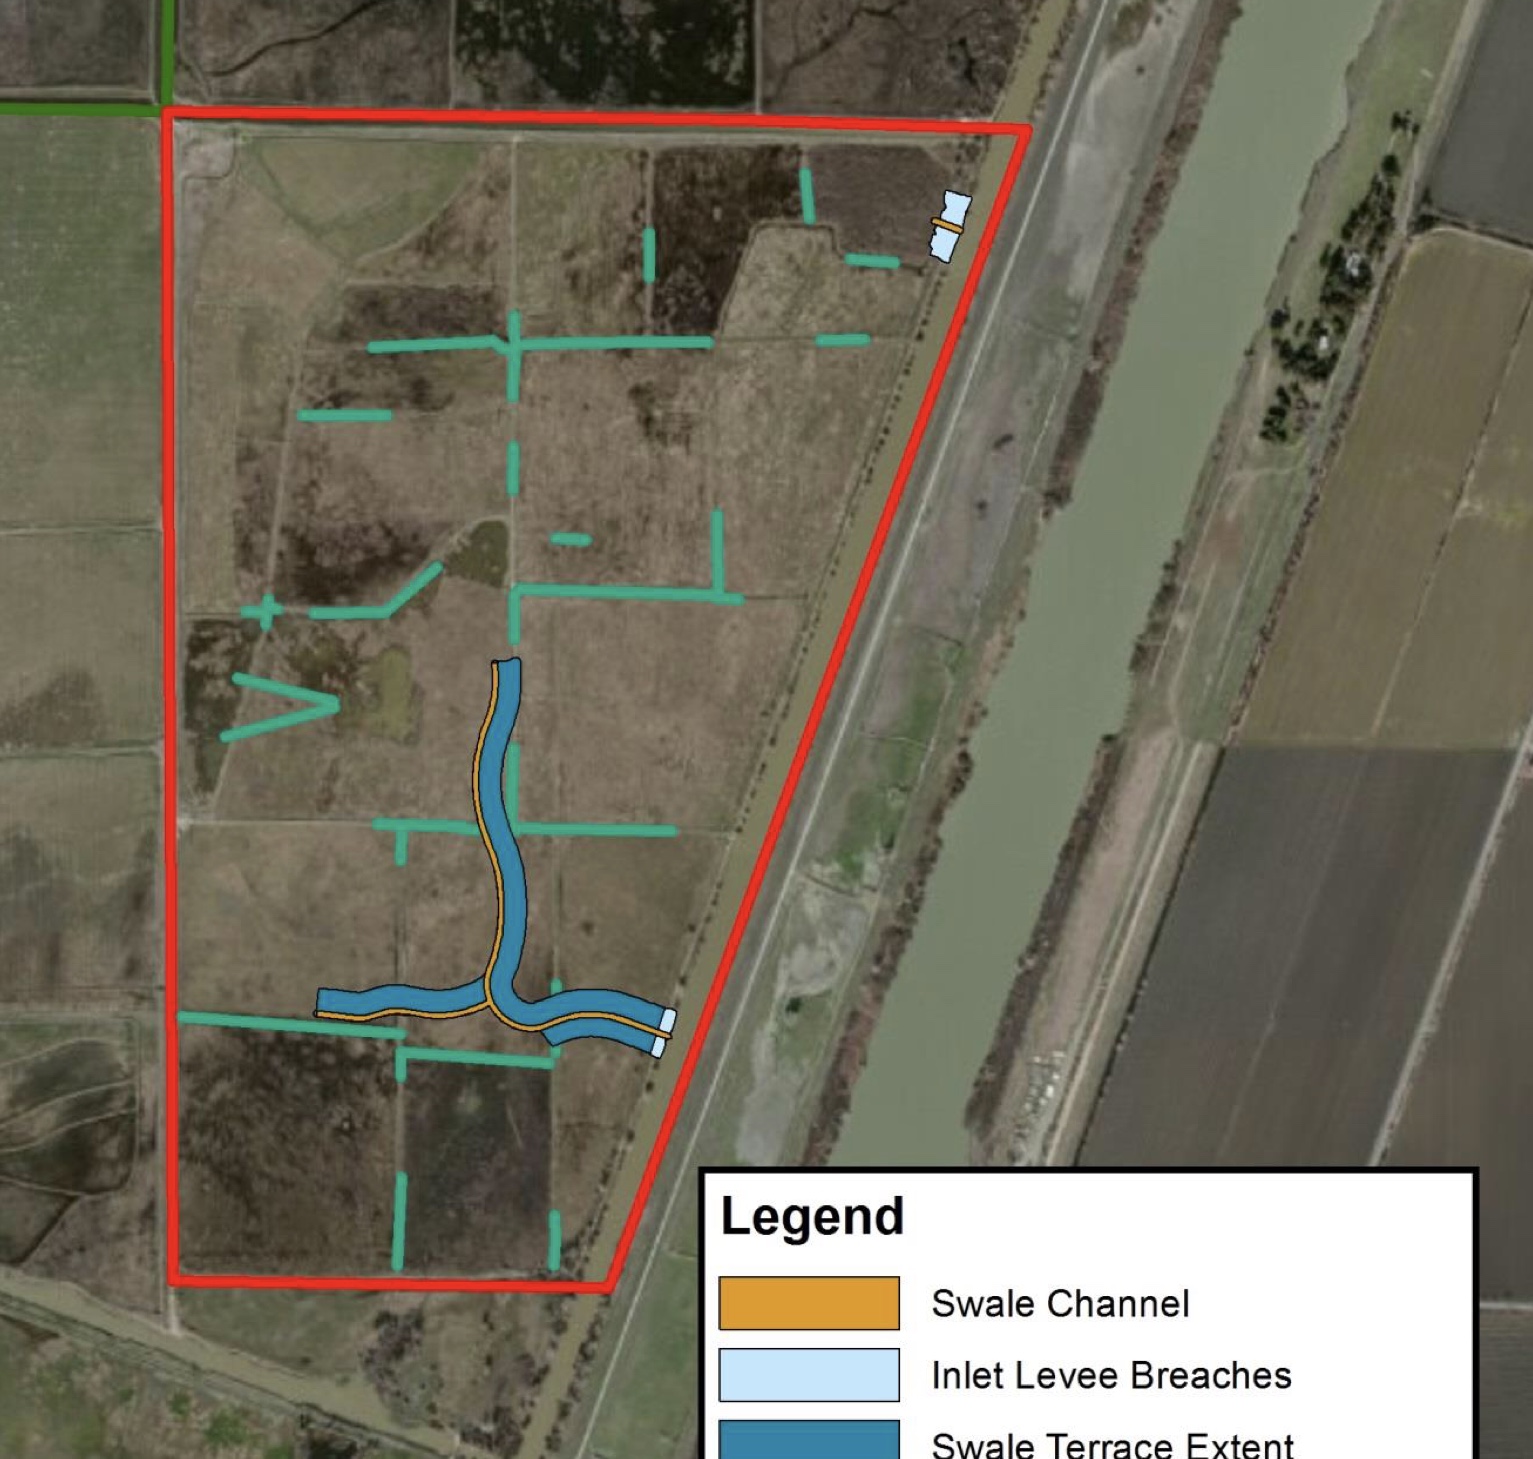
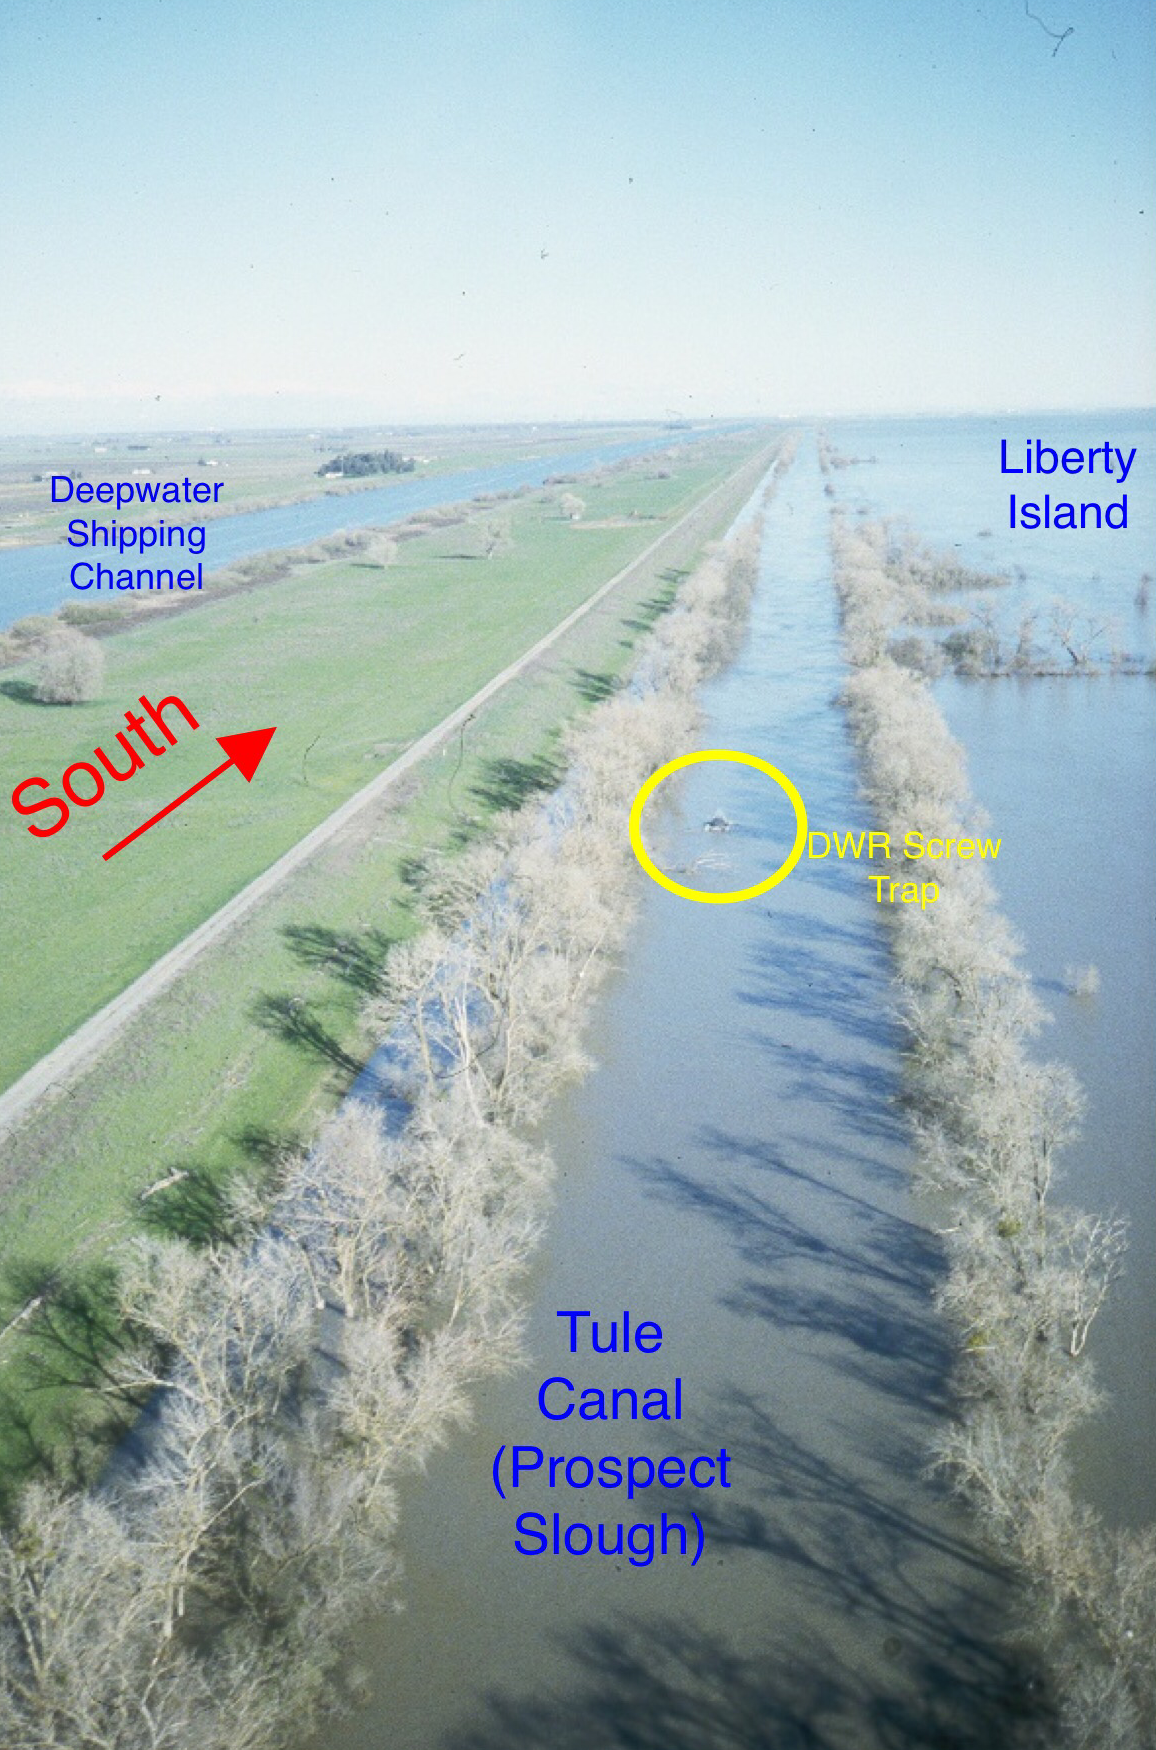
The Yolo Flyway Farms project is a new element of the state’s EcoRestore program to fulfill requirements of federal biological opinions for the State Water Project and Central Valley Project. The 300-acre tidal wetland restoration project is located in the southern Yolo Bypass in what is commonly referred to as the Cache Slough Complex (Figure 1). The Project’s design entails allowing tidal access to excavated upland irrigated pasture land by opening levees along Prospect Slough (Figure 2). The Project is in a known area of concentration for Delta smelt as determined by nearby CDWR screw trap sampling in Prospect Slough (Figure 3). Project sponsors submitted a certification of consistency with the Delta Plan to the Delta Stewardship Council.1

Are such projects in the best interest of the Delta smelt population? A close look at project attributes may help answer the question.

Positive attributes:

  1. Replacement of the existing tide gate irrigation system with open levee breaches eliminates existing entrainment and loss of Delta smelt and other fishes into the irrigated pasture lands.
  2. New tidal channels and tidal wetlands would provide rearing habitat for young smelt, salmon, and splittail. Plankton and benthic invertebrate food sources for fish would likely increase.
  3. Hard surfaces may provide smelt spawning habitat.

Negative attributes:

  1. Tidal channels would provide new habitat for predatory birds and fish , which could increase loss of young smelt and salmon. Prospect Slough is deep, turbid, strong- current habitat unfavorable to predators. Tidal channels of project would be dead end, low velocity, less turbid habitats favorable to predators of fish.
  2. The southern Yolo Bypass aquatic habitats are warm from spring through fall, at times exceeding the thermal optimum for Delta smelt. Proposed shallow-water dead-end sloughs and flooded wetlands would warm and increase warming of Prospect Slough and other lower Bypass waters. While a positive attribute in winter and at times in late fall and early spring, this would be detrimental at other times.

Despite the potential positive benefits of such restoration in general, the potential negative aspects of the Project are a real concern. Some of the potential negative effects could be reduced through changes in project design and operations. At a minimum, the project should be considered an adaptive management experiment where potential positive and negative attributes are studied to determine the overall benefit of the action and whether it fulfills the objectives of the biological opinions.

Figure 1. Yolo Flyway Farms Project location (red circle) in southern Yolo Bypass.

Figure 3. Prospect Slough adjacent to Deepwater Shipping Channel and Liberty Island in southern Yolo Bypass. CDWR screw trap in yellow circle.

NOAA Advocacy under ESA

On March 31, 2022, the Delta Independent Science Board (ISB) met to discuss: “How the State Water Project and Central Valley Project comply with the Endangered Species Act.”  Cathy Marcinkevage, Assistant Regional Administrator in the California Central Valley Office of the National Oceanic and Atmospheric Administration, NOAA Fisheries division, provided an overview of the federal Endangered Species Act (ESA) and the ESA Section 7 consultation process between NOAA and the Bureau of Reclamation regarding the effects of the Central Valley Project (CVP).

During questions, the ISB’s Dr. Robert Naiman asked if NOAA has “…the legal clout to require dams and other water diversions to install fish passage facilities.”  He provided context, observing: “…[N]one of the dams within the Delta’s watershed have fish passage facilities, and yet you have endangered species that could use the habitat above the dam, assuming you can get them through…” Naiman also noted: “In the Pacific Northwest and elsewhere, there have been a lot of retrofits for fish passage facilities as well as retrofits for regulating water temperatures in the rivers.”

In response, Ms. Marcinkevage spoke to NOAA’s authorities pertaining to fish passage at CVP dams.

First, she mentioned NOAA’s technical criteria for fish passage at intakes at diversion dams’ structures, for example the specifications along the surface of a fish screen: “We do have passage criteria for projects in terms of sweeping velocity and things like that.”

Second, she identified NOAA’s authorities under the Federal Power Act to prescribe fish passage at hydropower facilities (which all major Central Valley dams have).  However, this law does not pertain to federal dams, including the CVP dams.

Third, she said that NOAA, under the Federal Endangered Species Act (ESA), can be an advocate during ESA consultation with federal agencies: “With Section 7, we can try to advocate and get projects to do things within our needs.” [Emphasis added]

This is where we take issue with Ms. Marcinkevage.  Under the ESA, NOAA is clearly more than an advocate.  The agency has the principal regulatory authorities and responsibilities to protect and recover ESA-listed anadromous fishes.

NOAA’s job in a Section 7 consultation includes analysis of a project (action) as proposed, which Ms. Marcinkevage described: “But our job there is to analyze the project as it has come to us and identify its likelihood of jeopardizing the species.”  However, the ESA consultation process often also requires changing the details of the proposed project if necessary so that the project complies with the ESA.

Furthermore, NOAA must analyze the effects of a proposed action in the much broader context of the past and present baseline effects, to which a proposed action’s effects are added.  The baseline geographic reach and scale of the CVP are vast.  The CVP was and continues to be a major source of “stressors” that led to the ESA listing of multiple salmon, steelhead, sturgeon, and smelt species, including most of California’s anadromous fishes.

In addition to the large-scale hydrologic influences exerted downstream of the CVP impoundments, CVP dams were constructed with no fish passage facilities.  As a result, part of the CVP baseline is complete blockage of anadromous fish for decades, extending to the present.  Without access, vast amounts of habitat capacity and habitat diversity of anadromous fishes have been lost.

Dr. Naiman noted that endangered fishes could potentially use the habitat above the dams. Dams constructed with no fish passage are not unique to California, and the biological consequences they impose are well understood.  Salmon populations blocked from their historical habitat suffer devastating losses of abundance, productivity, and spatial diversity. These well-known facts were most likely what prompted Dr. Naiman’s question about NOAA’s legal authorities to require fish passage.

The ISB can and should be asking if it is possible to recover the salmon populations by “fixing” rim dam infrastructure and operations, and lower river and Bay-Delta habitats and water diversions, without fish passage past rim dams.  Stated another way, is recovery even possible in the absence of restored passage to historical anadromous habitats above the dams?

Ms. Marcinkevage suggested that NOAA can “work out” with the action agency alternatives to a proposed action that blocks or impairs fish passage:

“Now, as we do that [analyze the project], if we were to find that this project will continue to be a barrier or impose a barrier that will impede passage, we could work out an alternative that would prevent that.”

To date, nowhere in California’s Central Valley has NOAA performed an evaluation of a dam, found it to be a barrier to anadromous fish passage, and worked out a solution to the blockage of fish migration.  As Dr. Naiman observed, none of the major dams within the Delta’s watershed provide fish passage.

Clearly, NOAA has ESA authority to require alternatives to avoid jeopardy.  Exercise of this authority gets closer to Dr. Naiman’s question about the agency’s “legal clout” to require fish passage facilities.  Ms. Marcinkevage’s response did not differentiate between reasonable and prudent measures (RPMs), and reasonable and prudent alternatives (RPAs) in an ESA biological opinion.  RPMs are voluntary on the part of the action agency, while RPAs are NOAA-enforceable, and could include fish passage requirements.

Ms. Marcinkevage expressed a frank opinion about how to go about creating fish passage over CVP dams:

“But there’s something to not wanting to come in and being the completely authoritarian with the heavy regulatory hand to impose something that, frankly, can’t be done, but rather work out a more workable solution.”

Has NOAA concluded that passage over the CVP dams can’t be done?  The 2009 salmon Biological Opinion for the CVP included an RPA that required fish passage at Shasta and Folsom reservoirs.  It was that requirement that leveraged NOAA, in 2017, to conduct a test in Shasta Reservoir.  The test released juvenile salmon in the McCloud Arm to understand their ability to transit Shasta Reservoir during a wet water-year’s higher flows.   ~70% of the test fish reached the Dam.  A much lower transit success (~1%) occurred in a second experiment undertaken during an average water-year.  These are hardly unexpected results, given the enormity of Lake Shasta.  In order to capture emigrating juvenile salmon with high efficiency, head-of-reservoir collectors (rather than collectors at the dams) are sometimes deployed in Pacific Northwest reservoirs, although the reservoirs are much smaller than Shasta.

In 2019, the Trump administration stopped NOAA’s fish passage efforts at Shasta in their tracks.  The bogus Trump 2019 BiOp for the CVP eliminated the RPA that required fish passage.  And Trump’s Forest Service administrators ordered NOAA to not use Forest Service land for fish passage actions.  Now, NOAA will be conducting further studies in 2022 or 2023 to evaluate head-of-reservoir collection of downstream-migrating juveniles where the McCloud River enters Shasta Reservoir.  Though these studies are as yet voluntary, there is a fair likelihood that the forthcoming new salmon Biological Opinion will restore the fish passage RPA.

Notwithstanding NOAA’s preference to avoid a “heavy regulatory hand” under its ESA authority, the agency is entrusted with legal responsibilities to protect and recover listed species.  Enacting “collaborative,” less controversial mitigation alternatives at Battle Creek led to 20 years of delay in removing, or putting fish ladders over, only some of the small hydropower dams on Battle Creek that PG&E has now decided to abandon.  And in any case, recovering listed Central Valley salmon species without fish passage to major watersheds upstream of Central Valley rim dams is unlikely.

NOAA’s Recovery Plan for ESA-listed Central Valley salmon calls for at least three viable and spatially-diverse winter-run Chinook populations to recover the species.  If that’s to be accomplished, fish passage investigations at Shasta Dam need to be carried out and completed with haste.  The alternative is for the public to enlist the judicial system to provide the “heavy hand” needed for effective application of the ESA to protect our public trust resources.

American Shad – It is time to manage their populations

I have studied American shad, a popular sportfish and anadromous herring native to the East Coast, in the Hudson, Columbia, Sacramento, American, Feather, Yuba, and Stanislaus rivers. I have also fished for them for 50 years.  They are the most abundant anadromous fish in the Bay-Delta and Columbia River watersheds.  Millions run up the Sacramento and Columbia rivers every spring to spawn.  The 1-to-6-pound adults arrive in spring and spawn from late spring into summer as waters warm.  After spawning, some die, but many adults return to the ocean.   The eggs are large like those of salmon, but. unlike salmon eggs, shad eggs float and hatch as they drift downstream toward tidewater in the Delta through late spring and summer.  Young shad then rear in the tidal estuary through the summer before heading to the ocean.

Shad interact with our native fish in various ways, most of which are detrimental.  Whether they and other nonnative fish like striped bass contribute to population declines of native species like salmon, steelhead, smelt, and sturgeon is open to debate.  I believe that coupled with changes in climate and water management, the effects of nonnative fish on native species are getting worse.

A 2017 review of the ecological role of American shad in the Columbia River (Haskell 2017) provided three hypotheses regarding the Shad’s effect on Columbia River food webs:

  1. Juvenile shad are an abundant and highly energetic food that increase the growth rate of major salmon predators [e.g. Northern Pikeminnow, Walleye, Smallmouth Bass, and Channel Catfish) – viewed as negative by supporting production of salmon predators.
  2. Juvenile shad are planktivores that compete with juvenile salmon, particularly later migrating sub-yearling Chinook Salmon in the lower Columbia River – viewed as negative by reducing food for salmon thus reducing growth and survival.
  3. Large numbers of adult shad could influence nutrient balances given their capacity to convey marine-derived nutrients – another source of marine carbon input viewed as positive.

I would add four further hypotheses/issues on the role played by American shad:

  1. Adult shad migrate from the ocean into the Bay-Delta estuary in spring on their way to spawning rivers. They number in the millions, feeding on plankton including larval fish such as newly hatched Longfin and Delta smelt, and fry salmon that frequent the estuary and lower rivers.
  2. Adult shad spend late spring and most of the summer spawning in major in the mainstem rivers and their larger tributaries, during which they feed on aquatic invertebrates and juvenile salmonids. Their spawning run in the spring coincides with the rearing of juvenile fall-run salmon and steelhead.  Shad adults can be extremely abundant during the spring emergence of fry steelhead, especially in tailwaters below dams that block shad migrations.  The American, Feather, Yuba, and Mokelumne Rivers have such conditions.  Historical anecdotes of adult shad feeding on young salmonids below the Red Bluff Diversion Dam in the upper Sacramento River are available from CDFW predator survey reports.  In my own experience, I commonly use small spoons representing salmonid fry and parr size (2-3 inches long) that are readily swallowed by feeding adult shad.
  3. Adult shad may spawn through the summer in some tributary tailwaters where cold water releases (<65ºF) are prescribed for over-summering salmonids. Cold water can extend the period of shad spawning and the period in the tidal estuary when juvenile shad compete with smelt and other fishes for zooplankton prey.
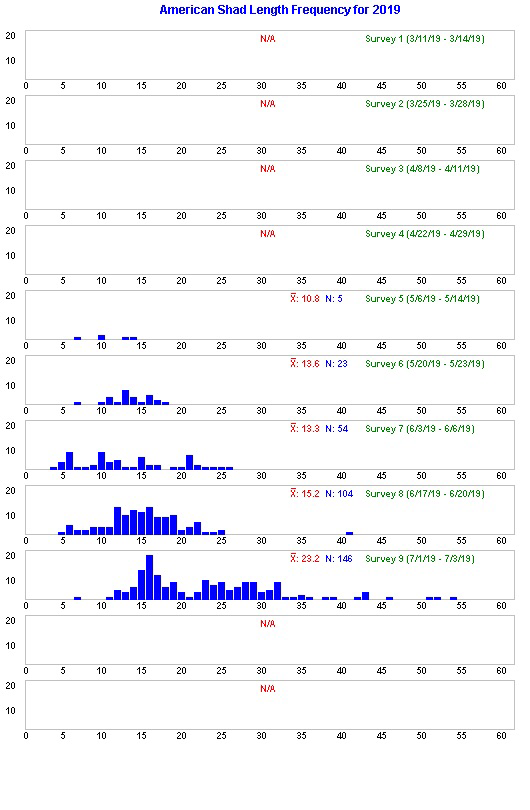
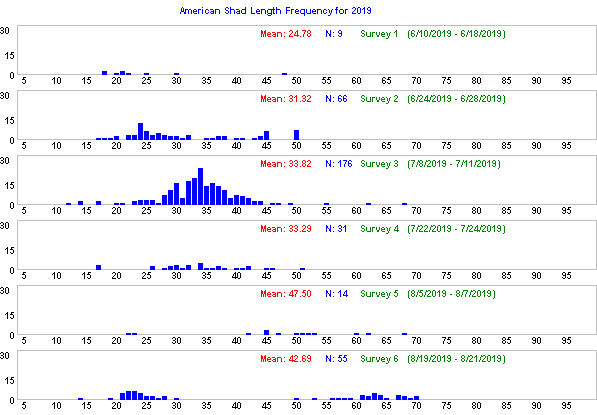
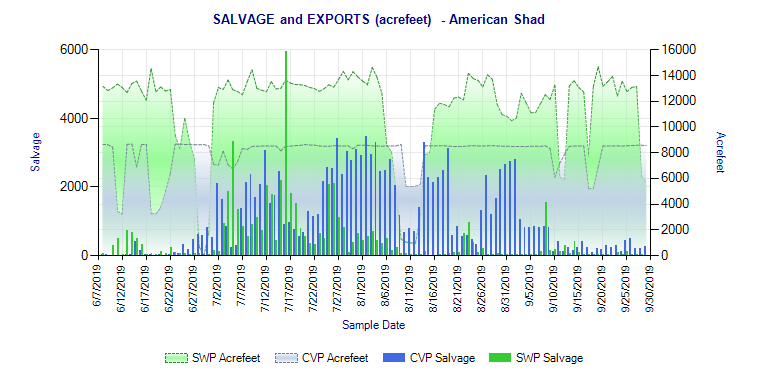
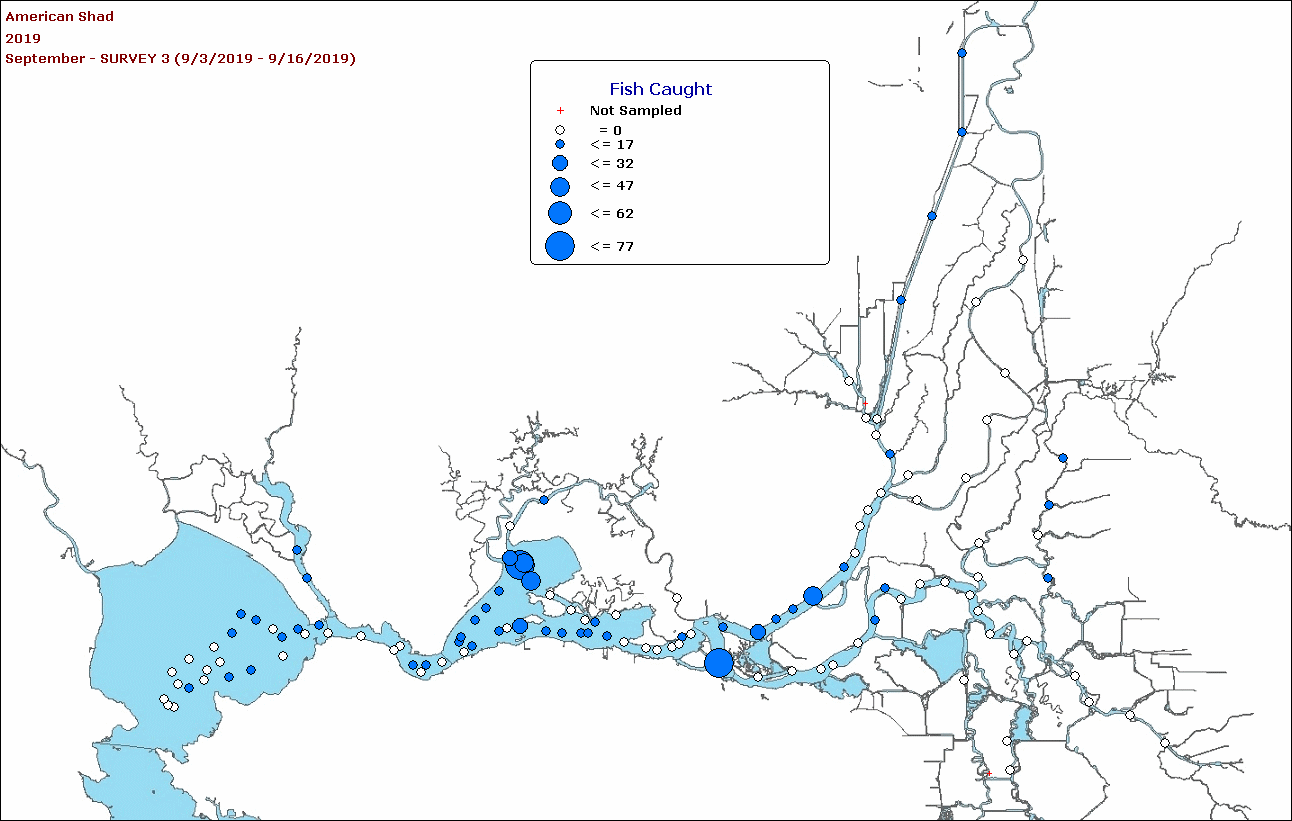
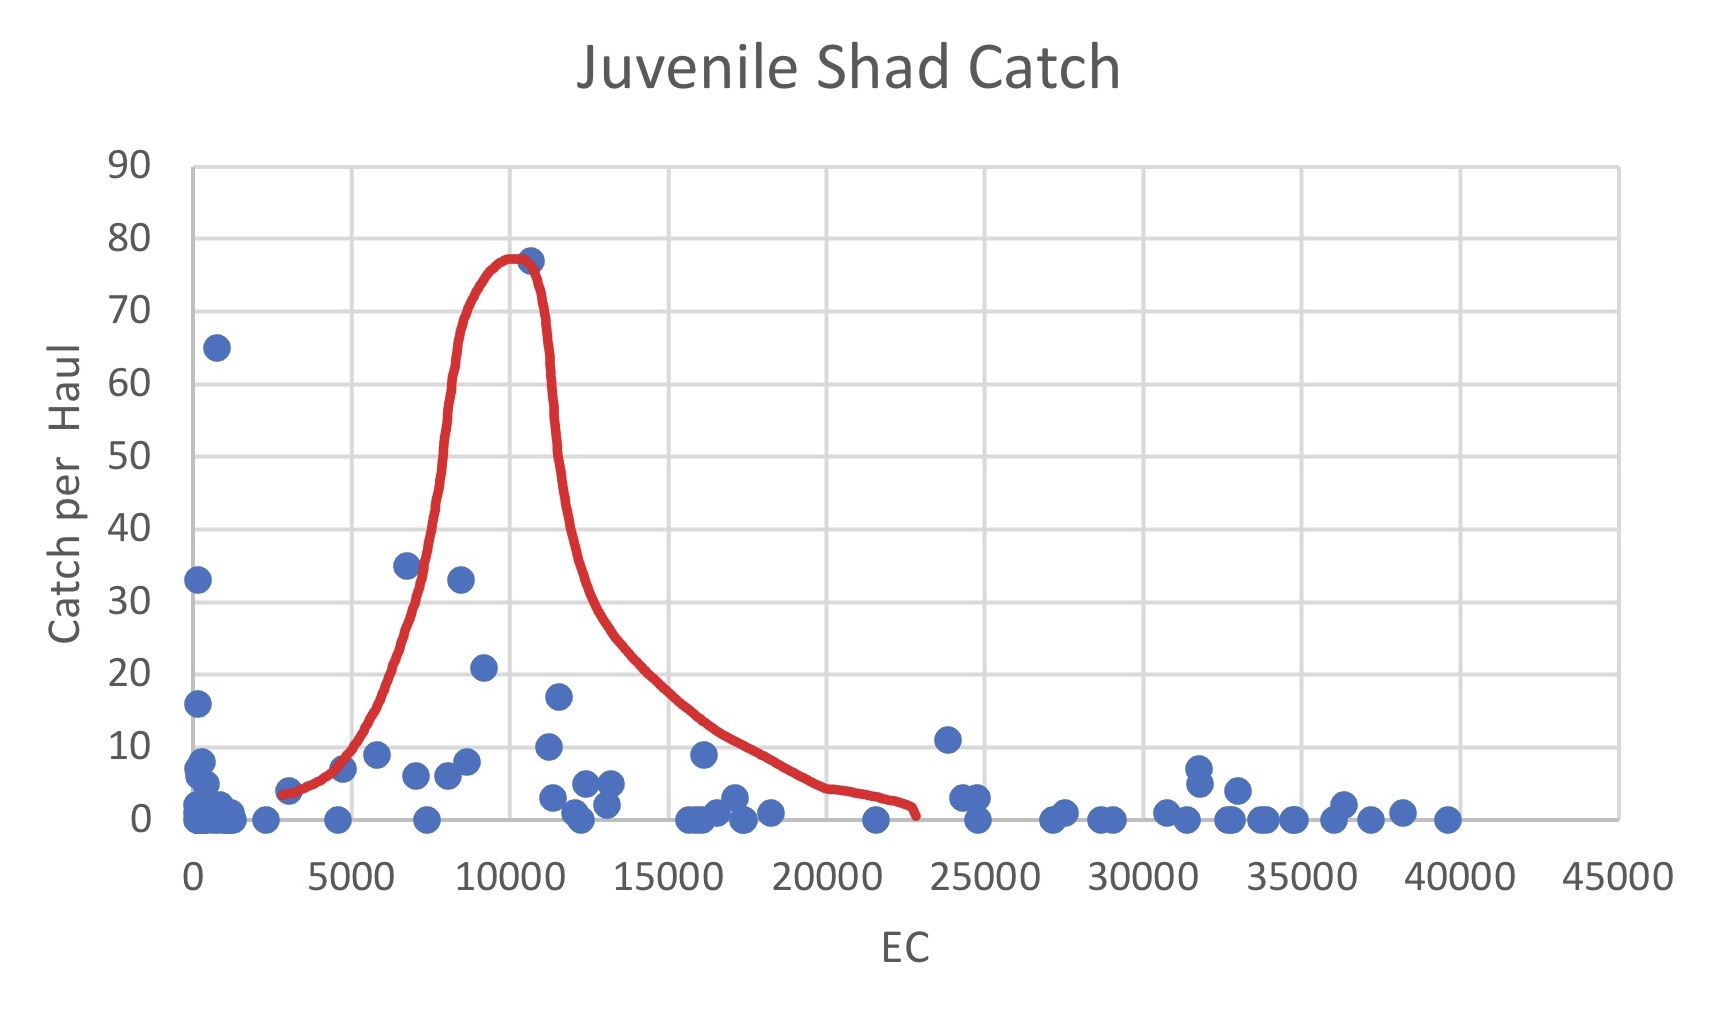
  4. Juvenile American shad rear in freshwater and low-salinity tidal zones of the Bay-Delta estuary from late spring through summer (Figures 1-6), where they feed on zooplankton of the same types as Delta smelt and other native fishes.

As is the case with many native fish species, American shad populations suffer during periods of drought.  This has been especially true in the past two decades in the San Francisco Bay-Delta Estuary (Figure 7), commonly referred to as the period of the Pelagic Organism Decline.  It is an open question whether the American shad are simply experiencing the decline like the native fish, or contributing to the native declines, or both.

The likely answer is both.  All the fish suffer in drought.  All the fish do not recover completely after droughts.  All the fish populations exhibit a long-term downward population spiral.  For some, it is a spiral toward extinction.  Even in decline, some nonnatives like American shad and striped bass can have increasing effects on the natives facing extinction.  If that is the case, then we should do everything possible to at least provide habitat conditions that favor native fish over nonnative fish.  The fact is that, in many cases, nonnative fish, including shad and striped bass, are more resilient than the native fish.  That is because the physical habitat and water management increasingly are less favorable to the native species.  We need to reverse this trend.

For more recent discussion on Central Valley American shad see:

https://calwatercenter.org/american-shad-the-deltas-most-abundant-and-least-considered-anadromous-fish/

Figure 1. Wet year 2019 American shad juvenile catch-size distribution in Bay-Delta spring 20-mm Survey.

Figure 2. Wet year 2019 American shad juvenile catch-size distribution in Bay-Delta Summer Townet Survey.

Figure 2. Wet year 2019 American shad juvenile catch-size distribution in Bay-Delta Summer Townet Survey.

Figure 3. Wet year 2019 salvage and export rates of juvenile American shad at south Delta export facilities.

Figure 4. Wet year 2019 catch distribution of juvenile American shad in September Fall Midwater Trawl Survey.

Figure 5. Wet year 2019 American shad catch distribution versus salinity (EC) for September Fall Midwater Trawl Survey. Red line indicates shad concentrate in low-salinity zone (5-15k EC).

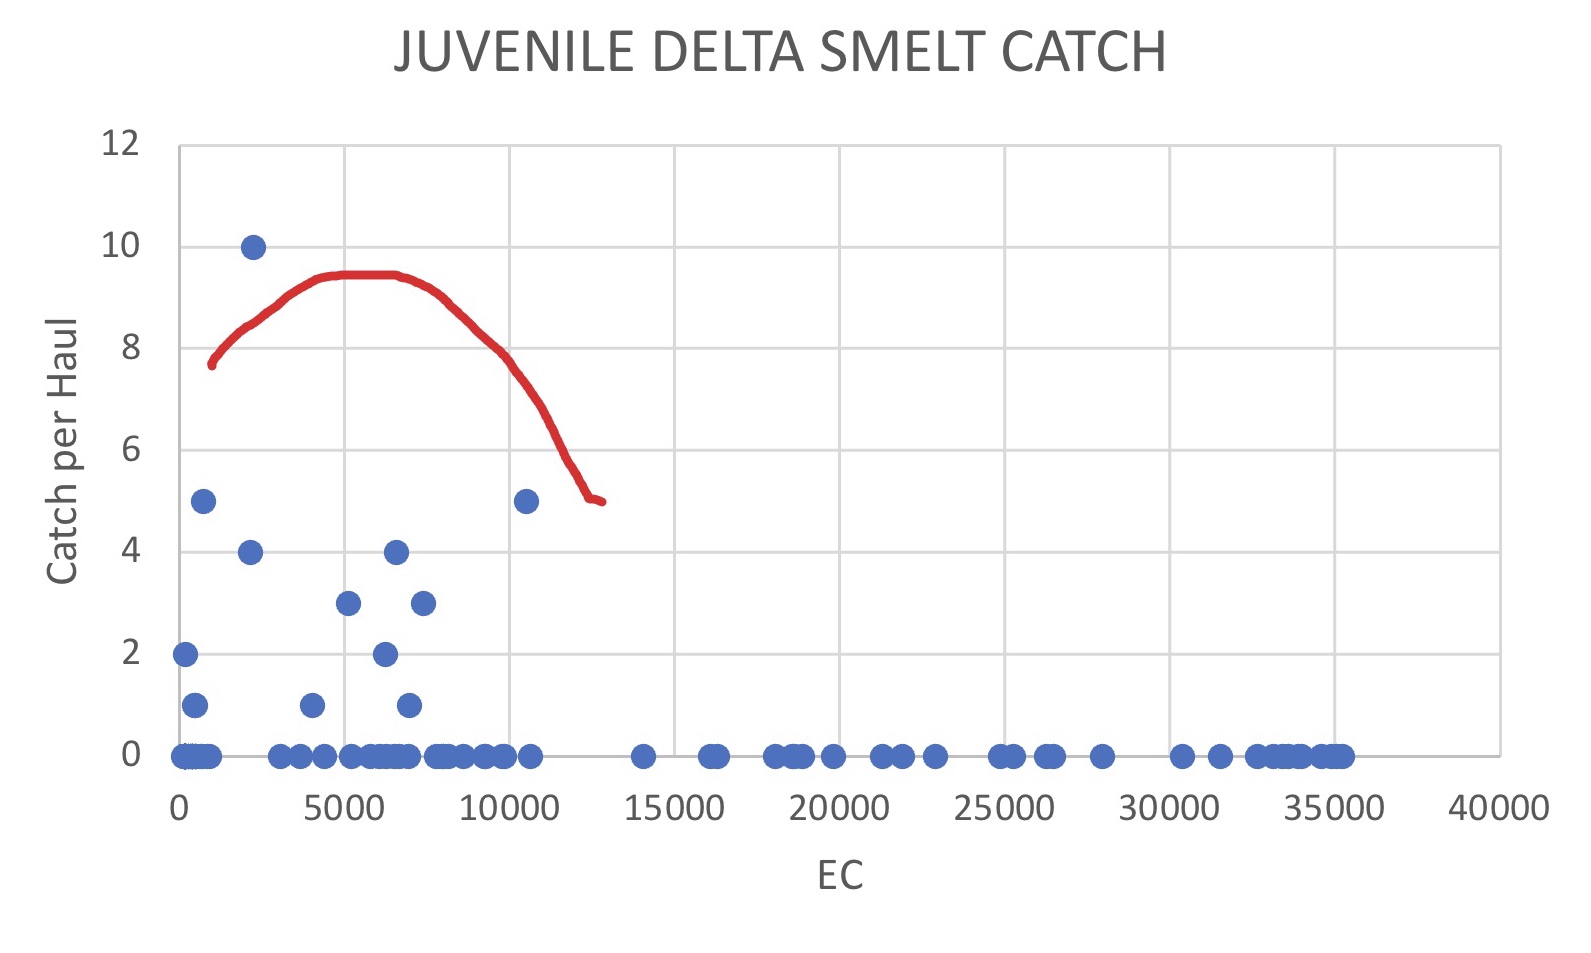
Figure 6. Wet year 2011 Delta smelt catch distribution versus salinity (EC) for September Fall Midwater Trawl Survey. Red line indicates smelt concentrate in low-salinity zone (5-15k EC).

Figure 7. Catch index of American shad juveniles in Fall Midwater Trawl Surveys 1967-2021. Recent drought periods noted.