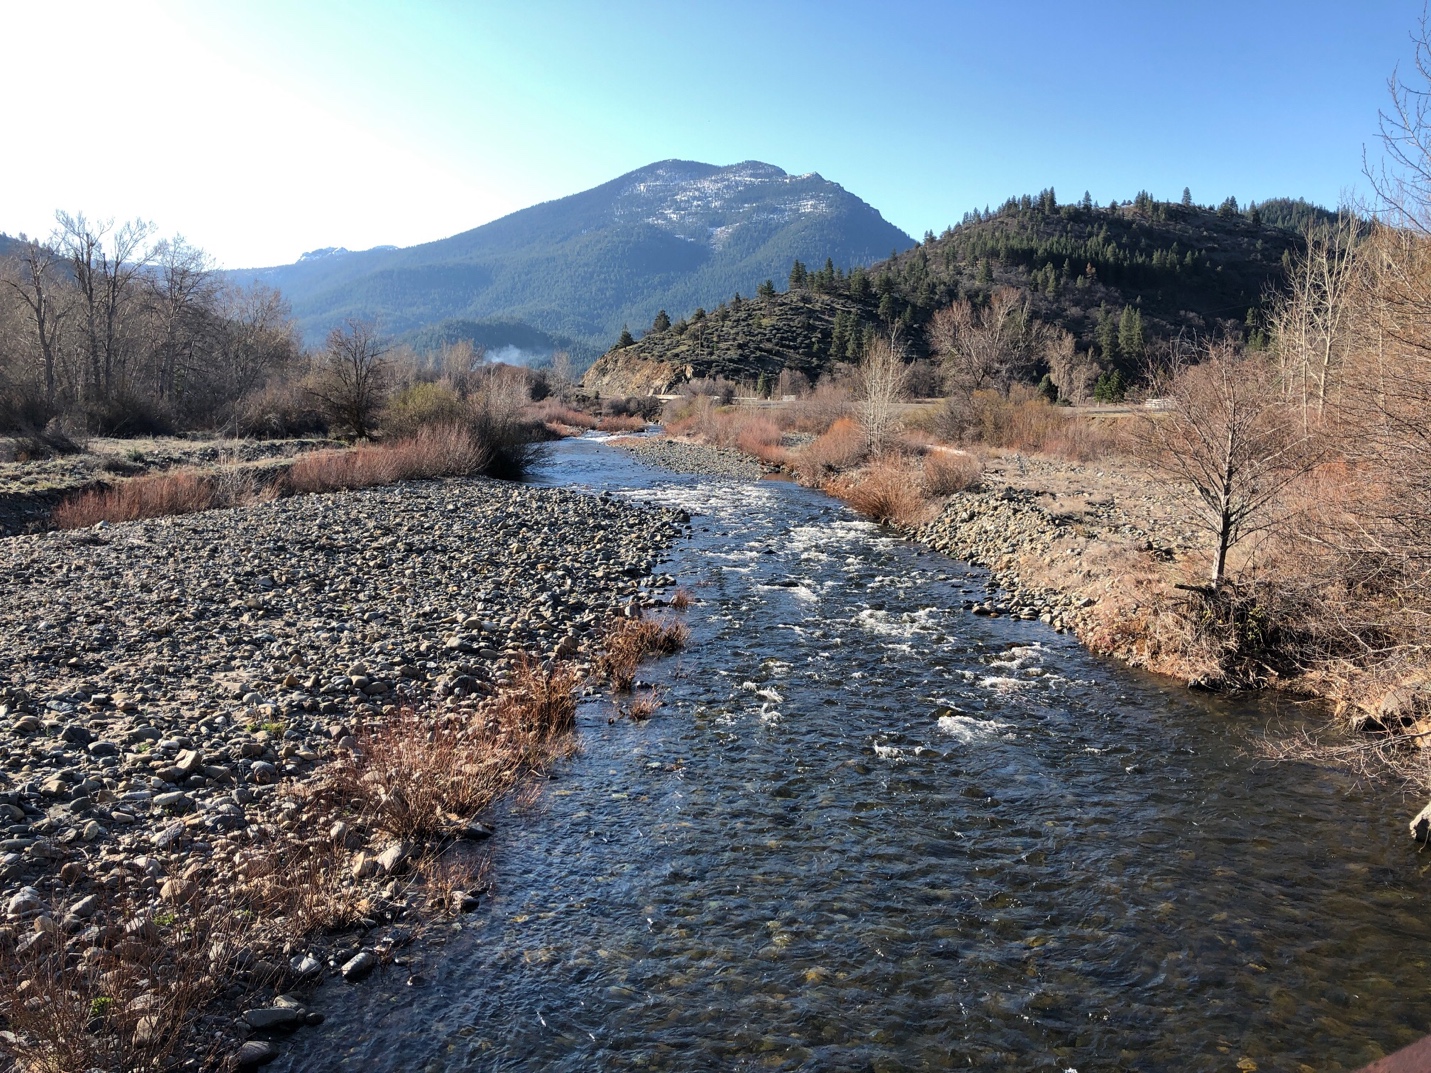
Shasta River Update – April 2019

A February 20, 2019 article in the Eureka Times-Standard reported continuing improvement of Klamath River fall-run Chinook.

“The number of natural area spawners was 53,624 adults, which exceeded the preseason expectation of 40,700. However, the stock is still in “overfished” status as escapement was not met the previous three seasons. The estimated hatchery return was 18,564 adults for the basin.

Spawning escapement to the upper Klamath River tributaries (Salmon, Scott, and Shasta Rivers), where spawning was only minimally affected by hatchery strays, totaled 21,109 adults. The Shasta River has historically been the most important Chinook salmon spawning stream in the upper Klamath River, supporting a spawning escapement of 27,600 adults as recently as 2012 and 63,700 in 1935. The escapement in 2018 to the Shasta River was 18,673 adults. Escapement to the Salmon and Scott Rivers was 1,228 and 1,208 adults, respectively.”

In a May 2017 post, I discussed an increasing contribution to the Klamath run from the Shasta River.  In Figure 1 below, I have updated my original spawner-recruit analysis from the prior post with 2017 and 2018 escapement numbers for the Shasta River.  The Shasta run in fall 2018 was third highest on record for the Shasta River.  The river’s fall-run population continues to benefit from improved water management.  Coho salmon and steelhead have yet to show significant improvements (Figure 2).

An February 26, 2019 article from the publication Grist (posted in 2/26/19 Maven’s Digest) describes changes to water management in the Shasta River.  The Nature Conservancy, using public grant funds, purchased the nearly 5000-acre Shasta Big Springs Ranch for $14 million in 2009.  More recently, the California Department of Fish and Wildlife purchased the water rights of the Shasta Big Springs Ranch.  Now, more water is left in the Shasta River, and only a third (1500 acres) of the ranch remains irrigated.  The article in Grist states that the new allocation of water has negatively affected the ranch’s ability to support wildlife and threatened its ability to support ranching.  In addition, the article questions the benefits of the new management regime to fish: “[T]he fish don’t seem to be doing much better either.”

While some will argue the relative values of ranching and fish protection,  I see no grounds to argue that changes in water management have not been positive to the Shasta River and Klamath River salmon.  Summer flows in the river below the ranch appear to have improved over the long term average (Figure 3).  Many of the Shasta River’s Chinook and Coho salmon spawn in the Big Springs area and in the river below Big Springs, and depend on flow and cold water input from the springs.  Even with the contribution of this flow, water temperatures are marginal (>65oF) for young salmon from May to September (Figure 4).

From my perspective, the loss of several thousand acres of irrigated pasture out of roughly 25,000 acres in the Shasta Valley seems a small price to pay for a large step towards the recovery of Shasta and Klamath River salmon.

Figure 1. Spawner-recruit relationship for Shasta River. Escapement estimates (log10X – 2 transformed) are plotted for recruits by escapement (spawners) three years earlier. Year shown is recruit (escapement) year. The number is the year that fish returned to the Shasta River to spawn. The color of the number depicts the water-year type in the Shasta River during the year the recruits reared. The color of the circle depicts the water-year type in the Klamath River during the year the recruits reared. Blue is for Wet water-year types. Green is for Normal water-year types. Red is for Dry water-year types. Example: 90 depicts fish that returned to the Shasta River as adult spawners in 1990. These fish were spawned in 1987 and reared in winter-spring 1988. The red number shows that the 1988 rearing year was a Dry water year in the Shasta River; the red circle shows that the 1988 rearing year was a Dry water year in the Klamath River. Note very poor recruits per spawner in 1990-1993 drought period, compared with relatively high recruits per spawner from 2011-2018, even though the latter period included the 2012-2016 drought.

Figure 2. Shasta River salmonid runs from 1930 to 2017. Source: https://www.casalmon.org/salmon-snapshots/history/shasta-river

Figure 3. Shasta River flows in the Shasta River below Big Springs 2016-2018 with 30 year average. Note summer base flow appears to have improved by approximately 10-30 cfs.

Figure 4. Water temperature in the Shasta River below Big Springs including summers of 2017 and 2018. Source: DWR CDEC.


A Case for Winter Pulsed Flows for Winter-Run Salmon

In a December 2018 post, I discussed the need for fall pulsed flows in the Sacramento River through the Delta in dry years. In this post, I further discuss the need for winter pulsed flows, using brood years 2013-2015 and resulting rearing of winter-run salmon in drought years 2014 and 2015 and normal year 2016 as examples.

Winter-Run brood year 2013 (spawned in summer 2013) started with a good number of spawners (Figure 1), but resulted in poor escapement in 2016 (Figures 1 and 2). Likewise, brood year 2014 started with slightly fewer spawners and resulted in even lower escapement in 2017. Brood year 2015 fared better.

While the lack of fall pulse flows and poor spawning conditions and redd dewatering likely struck brood years 2013 and 2014 first, the lack of winter pulsed flows further limited their survival, or at a minimum failed to ameliorate poor fall survival. Brood year 2013 juveniles moved out of the spawning reach above Red Bluff in the fall (Figure 3). However, they did not show in traps in the lower river at the Tisdale weir near Colusa, a hundred miles downstream of Red Bluff, or at Knights Landing, further downstream, until February (Figures 4 and 5). I attribute this delay to a lack of pulsed flows to move these fish down the river. This delay in out-migration to the Bay-Delta is detrimental both to in-river survival and to the success of smolts in reaching the ocean. In contrast, brood year 2015 had significant early winter flow pulses that moved juvenile winter quickly through the lower Sacramento River (Figure 6).

One might argue that Shasta Reservoir was too low after three years of drought to provide these winter pulsed flows (Figure 7). Three days’ release of 5000-10,000 cfs would require 30,000-60,000 acre-feet of water. This is between 2.7% and 5.5% of dry-year irrigation deliveries to Sacramento River water contractors from Shasta Reservoir (1,100,000 acre-feet in 2014 and 1,200,000 acre-feet in 2015).1

Figure 1. Escapement (spawning run) numbers for winter run salmon 1974-2018. Source: https://nrm.dfg.ca.gov/FileHandler.ashx?DocumentID=84381&inline

Figure 2. Spawner-recruit relationship (log10 – 2) for winter run salmon. Number represents brood year. Color represents dry (red), wet (blue) or normal (green) water year types for winter rearing/migration season following spawning. For example, 15 represents brood year 2015 under winter conditions in the normal 2016 water year.

Figure 3. Red Bluff trap catch of brood year 2013 winter run salmon juveniles fall 2013, winter 2014.

Figure 4. Tisdale Weir trap catch of brood year 2013 winter run salmon juveniles fall 2013, winter 2014.

Figure 5. Knights Landing trap catch of brood year 2013 winter run salmon juveniles fall 2013, winter 2014.

Figure 6. Red Bluff and Tisdale trap catch of brood year 2015 winter run salmon juveniles in fall 2015 and winter 2016.

Figure 7. Shasta Reservoir storage in winters 2014 and 2015. Total capacity is 4,500,000 acre-feet.


Klamath River Fall Chinook Salmon – Fall 2018 Update

The Klamath River is closed to salmon fishing again this fall after the number of fish caught reached the small allotted quotas1. Poor run size (escapement) continues to be a problem, especially for the Scott River, a major spawning tributary of the Klamath. The 2015-2017 Scott run was approximately 2000 spawners, as compared to over 12,000 in 2014. Few fall-run salmon have been counted in the Scott this fall, compared to 4500 on the Shasta River. A past post describes the problem in detail.

The key factor in the decline of Scott fall Chinook has been poor late summer and early fall flows. Low flows do not allow adult salmon to ascend the Scott from the Klamath. This not only hurts that year’s Scott run, but out-year Scott (and Klamath) returns two to five years later.

The problem is especially acute this fall, with flows less than 10 cfs, less than 20% of the historical average (Figure 1). In fall 2017, flows were near or above average (Figure 2), leading to a small increase in the run to 2500, despite poor flows during the 2013-2015 drought. The strong 2014 run also helped.

The solution is simple: stop irrigating pastures and hayfields in Scott Valley after September 1. Many ranchers do, especially for hayfields, but not all. If that is not possible, there are many idle wells of 5-10 cfs capacity each that could pump water into the river to keep the river adequately watered, with little threat to subsequent winter groundwater recharge. A battle is brewing over Scott River water use and the public trust salmon resources.

Figure 1. Scott River flows fall 2018.

Figure 2. Scott River flow in fall 2017.

Reclamation is misleading on raising Shasta

A September 2018 Bureau of Reclamation “fact sheet” on raising Shasta Dam is misleading.

Enlarging the reservoir will provide an additional 630,000 acre-feet of stored water for the environment and for water users.

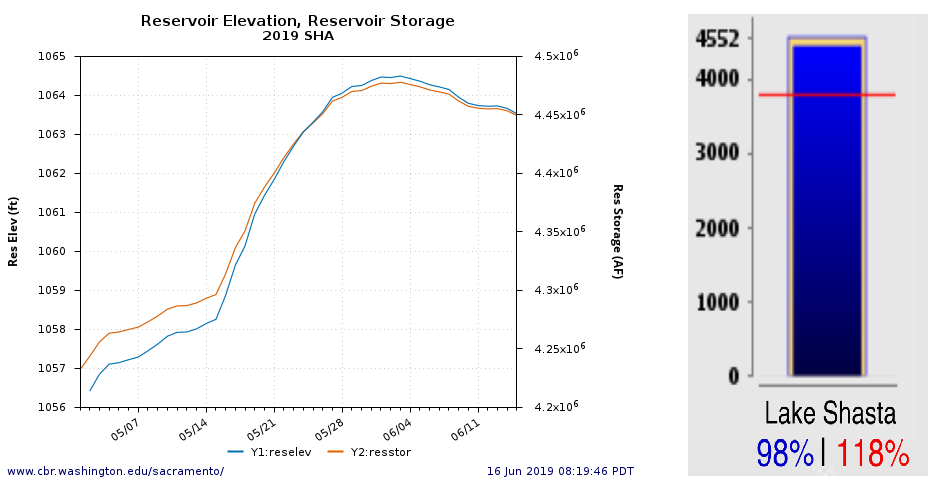
Comment: Additional storage would have been accomplished in only two years of the last decade (Figure 1). There would have been no additional cold-water pool volume in critical years 2013-2015, when the loss of cold water was a problem (Figure 2). Water users already had 100% allocations in the years in which raising Shasta would have added storage. Water allocations would likely increase in some dry years following wet years, offsetting any prospective environmental benefit by drawing down storage.

Enlarging the reservoir will improve water supply reliability for agricultural, municipal and industrial, and environmental uses; reduce flood damage; and improve water temperatures and water quality in the Sacramento River below the dam for anadromous fish survival.

Comment: there would have been no flood benefits in the past decade. Critical-year water temperatures from 2013-2015 would not have changed. Sacramento River water quality suffers the most in critical drought years. This would not benefit from raising Shasta.

Figure 1. Daily average flows from Keswick Reservoir over past decade. Raised Shasta would only accommodate added storage in wet year spill events in water years 2011 and 2017.

Figure 2. Shasta storage volume over past decade. Maximum existing storage is 4,552,000 AF.

Spring Hatchery Salmon Releases – Feather River

Hatchery fall-run salmon smolts being released into the Sacramento River at the mouth of the Feather River at Verona on May 2, 2018. SacBee photo.

The California Department of Fish and Wildlife released spring-run and fall-run salmon smolts raised at the Feather River Hatchery into the lower Feather River from late March to early May 2018. The initial spring-run releases were accompanied by a flow pulse up to 14,000 cfs into the lower Feather River.1 The early May release2 of fall-run was made without the benefit of a flow pulse.

Past performance of hatchery spring-run smolt releases is shown in Figure 1. The 2011 successful smolt release was accompanied by 8,000-17,000 cfs Oroville Dam flows (Figure 2) and wet year conditions in the Bay-Delta. The 2012 modestly successful smolt release was accompanied by a 3000 cfs flow pulse. The 2007 to 2009 smolt releases also had an accompanying 3000-5000 cfs flow releases, but flows that followed fell to 1000-2000 cfs. There was no flow pulse in 2010.

The early April 2018 flow pulse in the Feather River was followed by falling flows (14,000 cfs in early April down to 1000 cfs flow in late April – Figure 3). The latest release of fall-run smolts on May 2 was made near the mouth of the river because of low Feather River flows. Flows in the Sacramento River were also low (less than 10,000 cfs – Figure 4), and water temperatures were marginal at 65°F. The evidence summarized in Figures 1 and 2 suggests that smolts should be trucked to the Bay in non-wet years without strong flow pulses. Survival would be further increased if the smolts are barged from the mouth of the river.3

We can expect good survival from the earlier releases that were accompanied by flow pulses and poor survival from the early May release without a flow pulse. The latter release should have been trucked to the Bay.

Figure 1. Survival (% return) of spring-run salmon tag-release groups from 2007-2013 spring smolt releases. Source of data: http://www.rmpc.org/

Figure 2. Flow (cfs) in the lower Feather River at Gridley in Apr-May 2007-2013.

Figure 3. Flow (cfs) in the lower Feather River at Gridley in Mar-May 2018.

Figure 4. Flow (cfs) in Sacramento River just below mouth of Feather River at Verona in Mar-May 2018.