What is it about the Scott River and its Coho Salmon?

A recent article in Science Magazine provides a possible clue as to why the Scott River, a California tributary to the Klamath River, still produces a relatively large amount of coho salmon. A chemical released onto roads as tires wear has been found to kill young coho.1 Watersheds like the Scott River are pristine, sourced directly from springs and snowmelt, with low highway interaction. The Scott contrasts with its neighbor the Shasta river, which runs very close to Interstate Highway 5, and which produces few coho salmon.

Absence of pollution from tire debris may also be part of the reason why Butte Creek is able to produce so many spring-run salmon. On the other side of the coin, the prevalence of roads may help explain why coho salmon have been extirpated from many of the highly urbanized Puget Sound watersheds in Washington State and British Columbia.

The recent study regarding pollution from tires emphasizes the need to protect pristine watersheds like the Scott River, as well as the need to restore those like the Shasta River. There is likely to be more public discussion of this subject in the coming months and years, hopefully as the tire industry seeks alternatives to its problem chemical

  1. As described in Science Magazine, the chemical is: “a highly toxic quinone transformation product of N-(1,3-dimethylbutyl)-N′-phenyl-p-phenylenediamine (6PPD), a globally ubiquitous tire rubber antioxidant.”

Scott River Coho 2020 Run Improves

I last updated the status of Coho salmon in the Scott River, a major Klamath River tributary in northern California east of Yreka (Figures 1 and 2), in a January 2020 post. At that time, I lamented on the decline of the strongest distinct population subgroup, 2013-2016-2019, exemplified by the weak run in 2016 caused by the 2013-2016 drought. In this post, I am happy to report on the strong 2020 run and the surprise improvement of the 2014-2017-2020 subgroup (Figure 3).

The improvement in the 2020 run, despite a sparse spawning run in late-fall 2017, is likely a consequence of good water conditions in early water year 2018 (Oct 2017-Sep 2018, Figure 4) after wet water year 2017. The run had good access to spawning habitat and early rearing conditions from fall 2017 through the spring of 2018. The young coho were sustained though the dry summer of 2018 in spring-fed reaches of the upper river and its tributaries. Spring-fed habitats likely benefitted from the abundant winter 2017 snowpack. The Scott watershed had also benefitted from significant restoration of its over-summering habitat over the past decade.1

The yearlings of brood year 2017 then had good wet year emigrating conditions in late fall 2018 and early winter 2019 (Figures 4 and 5). There were multiple winter flow pulses to help the yearling coho smolts emigrate from Scott Valley and on down the Klamath to the ocean.

In summary, the spawning run in fall 2020 (from brood year 2017) was exceptional, benefitting from conditions that were a consequence of wet years 2017 and 2019. Over-summering survival in dry year 2018 was likely good because of good spring-fed flows and habitat in the upper watershed, a carryover from the good 2017 snowpack and restoration of beaver-pond habitat by Scott Valley stakeholder groups. This one small success bodes well for recovering other salmon and steelhead populations throughout the Klamath watershed, especially in a future dominated by climate change.2

Figure 1. Klamath River watershed with the Scott River west of Yreka, CA. (Source DOI.)

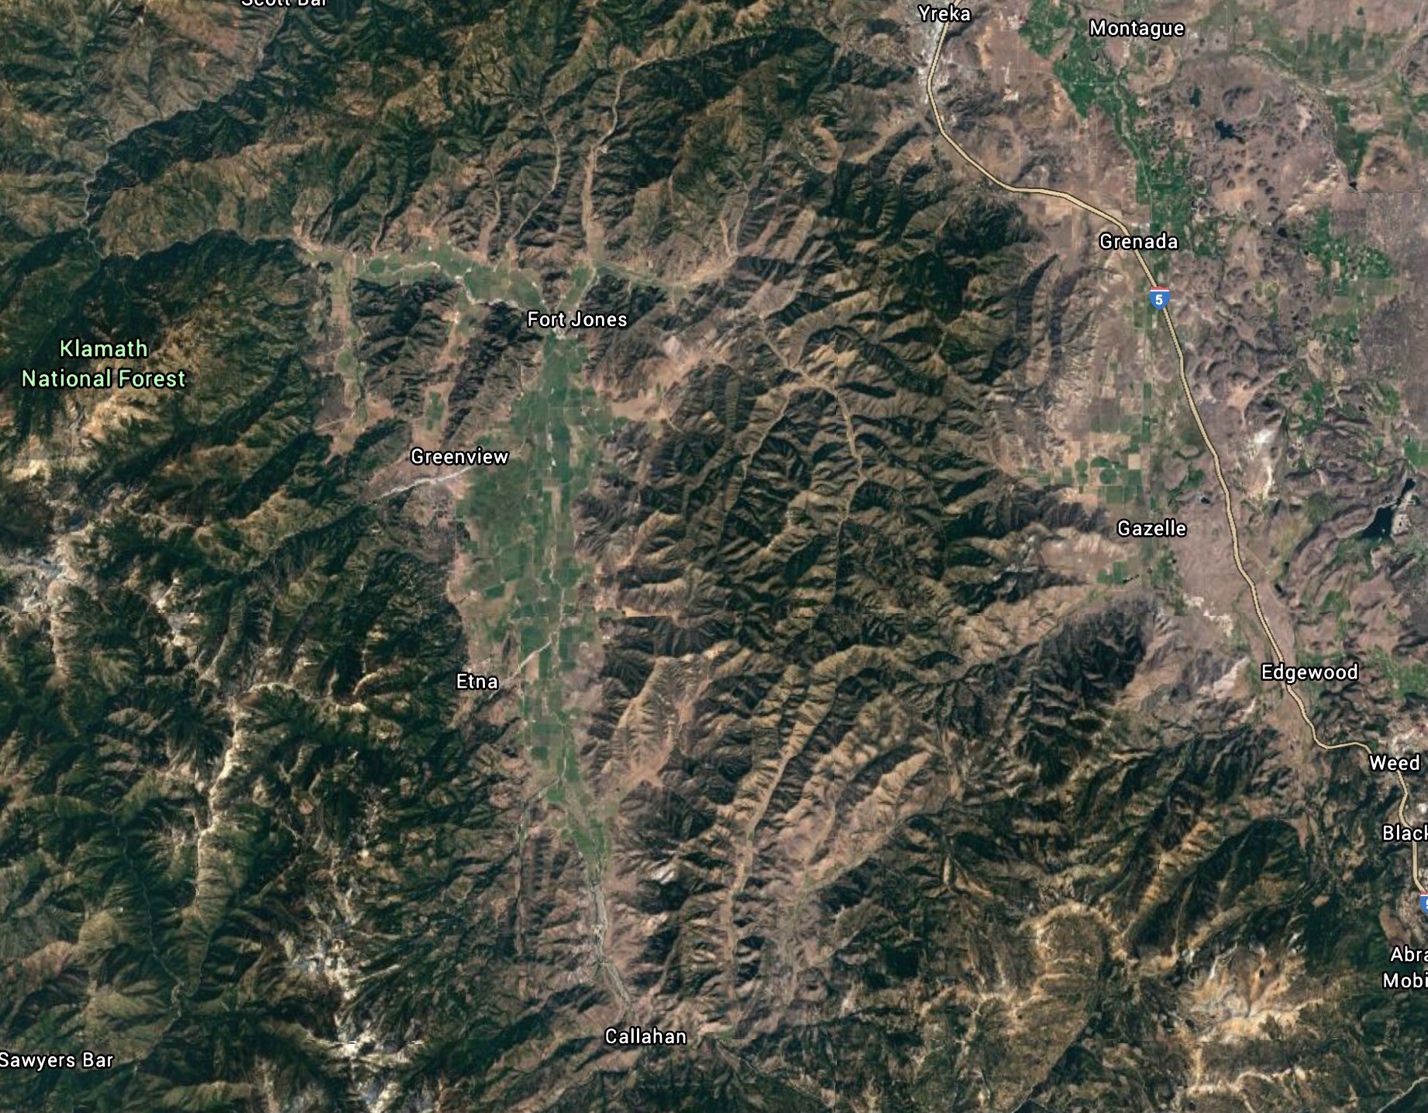
Figure 2. Google Earth view of the Scott River watershed with its snow-covered Marble Mtns to the west and the Trinity Alps to the south. Scott Valley, with its green hay fields from Etna to Fort Jones, was once called “beaver valley” due to its abundance of spring-fed beaver ponds and meadow streams ideal for over-summering salmon and steelhead.

Figure 3. Spawner-recruit relationship for Scott River Coho salmon. The number represents recruits (spawner counts) for that year versus spawners counts from three years earlier. For example: “13” represents spawner counts (recruits) in fall 2013 versus spawner numbers three years earlier in 2010. Number color represents different spawner subgroups (blue=subgroup 10-13-16-19). The Red circle highlights the significant outlier in 2016. The Yellow line is trend-line for years other than 2016 and 2020. Data source: CDFW weir counts.

Figure 4. Scott River streamflow measured downstream of Fort Jones as the river leaves Scott Valley, September 2017 to April 2019. Note the near average wet winters in 2018 and 2019, and dry summer in 2018 typical of the Mediterranean climate of northern California. The drier-than-average summer 2018 is indicative of water use for hay-pasture irrigation.

Figure 5. Klamath River streamflow measured downstream of the mouth of the Scott River, October 2018 to June 2019. Note the near average wet winter-spring with five distinct flow pulses typical of wetter years. of the Mediterranean climate of northern California. The flow pulses helped yearling coho from brood year 2017 emigrate to the ocean. The adults from brood year 2017 returned in late fall of 2020.


Scott River Coho Salmon Run – Status Fall 2019

The Scott River Coho salmon population is one of the last remaining self-sustaining wild Coho salmon runs in California and in the Southern Oregon Northern California Coho (SONCC) Evolutionarily Significant Unit (ESU).  The SONCC ESU is listed as “threatened” under the federal and California endangered species acts.  The ESU includes the Rogue River in Oregon and the Klamath River in California.

The Scott Coho run is the major wild Coho population in the Klamath River system.  Scott Coho spawn and rear in Scott Valley, once called “Beaver Valley,” located near Fort Jones.  The run has numbered over 1,000 adult Coho spawners as recently as 2013, but numbered less than 100 as recently as the 2008-09 drought years (Figure 1).

Scott Coho include three distinct sub-populations that have developed because the vast majority of spawners are three years old.  One subgroup, the 2007-2010-2013 sub-group, dominated the population in the recent past, but declined sharply in 2016.  The other two sub-groups have increased slightly since 2008 and 2009 lows.

The spawner-recruit relationship (Figure 2) shows a generally positive relationship between the number of spawners and recruits three years later for each sub-group and the overall population with one distinct outlier (the sharply lower 2016 run).  So why was the 2013 run so high and the brood-year 2013 run in 2016 so poor?

1.      2013’s Good Run

The 2013 run (brood year 2010) got off to a great start in wet water year 2011.  Flows for the fall 2010 spawning run were good from November through January [Figure 3), which ensured spawner access and good spawning conditions throughout Scott Valley.  Flows were also good through the spring and fall of 2011 (Figure 4), ensuring good smolt production and a subsequent strong run in 2013.

2.      2016’s Poor Run

The strong run in 2013 spawned in brood year 2013, which got off to a rocky start in dry water year 2013-14.  Flows in fall-winter 2013-14 encountered by the strong 2013 run were very low through the early winter spawning season (Figure 5), leading to an unusually protracted run of adult spawners (Figure 6) and poor accessibility to good spawning areas.  Spawning habitat quality and quantity likely also suffered from low flows.  Flows were then very low from spring through fall of 2014 (Figure 7), likely resulting in poor over-summer survival and low smolt production for brood year 2013.

In conclusion, the Scott Coho salmon population continues to suffer from low seasonal streamflow, especially in drought years like water year 2013-14.  The population would benefit from improved summer-through-fall streamflows.  It will also benefit from the watershed habitat restoration actions being implemented by landowners, CalTrout,  the Scott River Watershed Council, Siskiyou RCD, Scott River Water Trust, California Department of Fish and Wildlife, Quartz Valley Indian Reservation, and other stakeholders.

Figure 1. Escapement of adult Coho salmon to the Scott River from 2007 to 2019. Data source: CDFW, Yreka, CA.
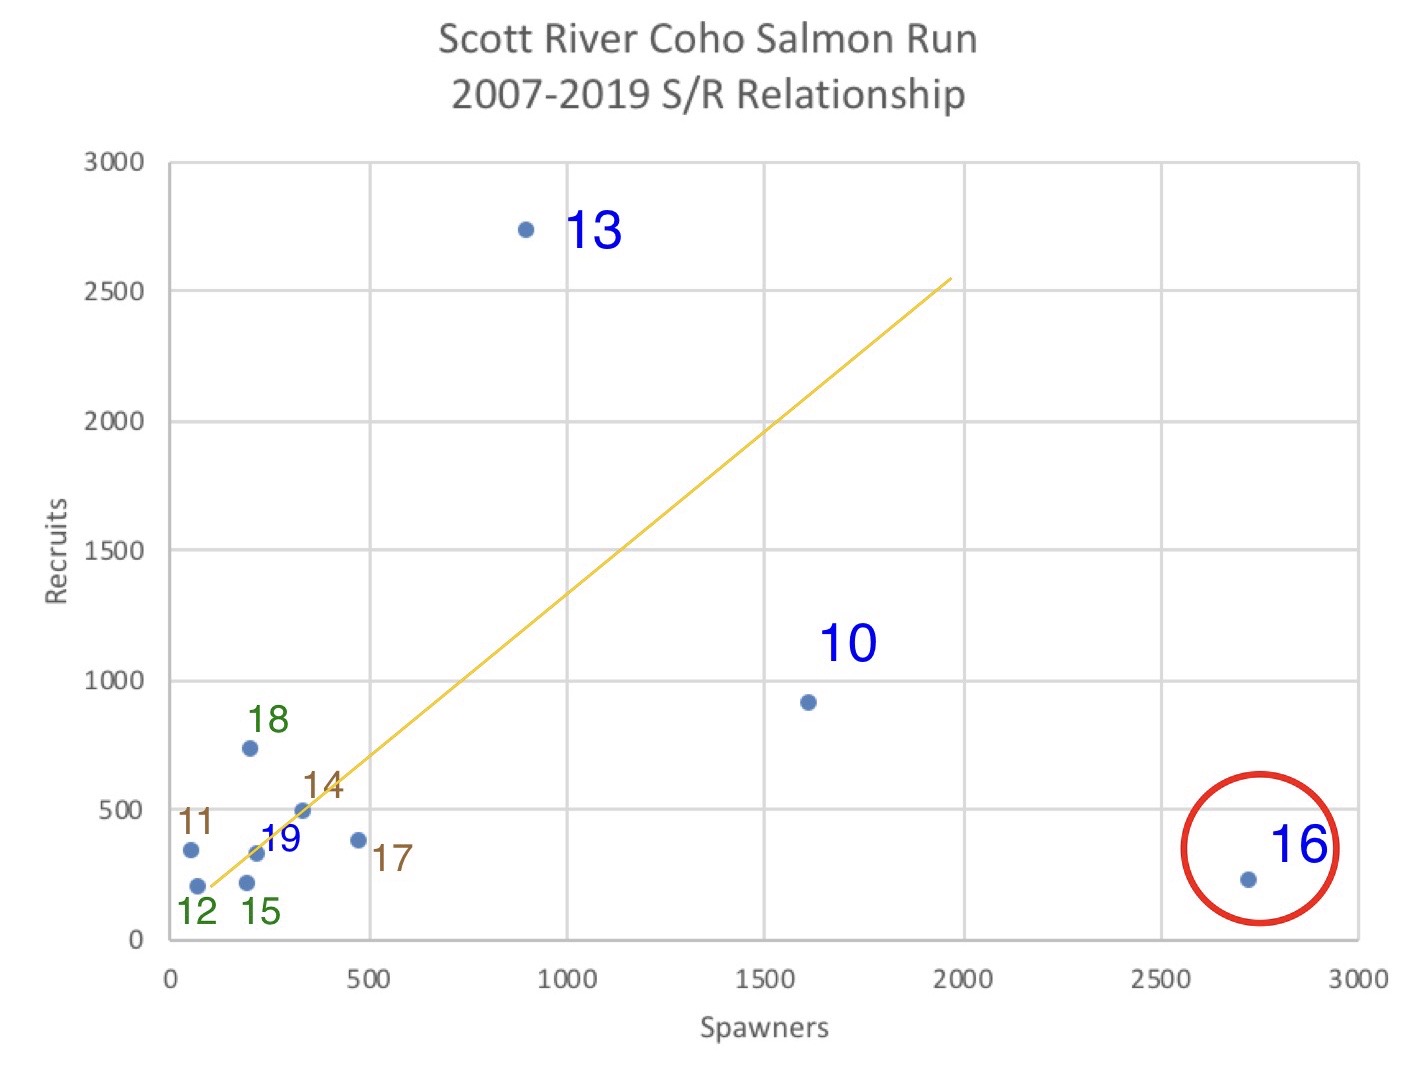
Figure 1. Escapement of adult Coho salmon to the Scott River from 2007 to 2019. Data source: CDFW, Yreka, CA.

Figure 2. Spawner-recruit relationship for Scott River Coho salmon. The number represents recruits (spawner counts) for that year versus spawners counts from three years earlier. For example: “13” represents spawner counts (recruits) in fall 2013 versus spawner numbers three years earlier in 2010. Number color represents different spawner subgroups (blue=subgroup 10-13-16-19). The Red circle highlights significant outlier in 2016. The Yellow line is trend-line for years other than 2016.

Figure 3. USGS gaged daily average flow (log scale) in lower Scott River, Klamath River tributary, 9/1/2010-2/1/2011, with 78 year average daily median flow for that date.

Figure 4. USGS gaged daily average flow (log scale) in lower Scott River, Klamath River tributary, 4/1/2011-11/1/2011, with 78 year average daily median flow for that date.

Figure 5. USGS gaged daily average flow (log scale) in lower Scott River, Klamath River tributary, 9/1/2013-2/1/2014, with 78 year average daily median flow for that date.

Figure 5. USGS gaged daily average flow (log scale) in lower Scott River, Klamath River tributary, 9/1/2013-2/1/2014, with 78 year average daily median flow for that date.

Figure 6. Scott River adult salmon collection weir counts of Coho salmon for fall-winter 2013-14. Data source: CDFW Yreka, CA.

Figure 7. USGS gaged daily average flow (log scale) in lower Scott River, Klamath River tributary, 4/1/2014-10/31/2014, with 78 year average daily median flow for that date.


Klamath’s Shasta and Scott Rivers – Update Fall 2019

In two May 2017 posts1, I discussed the status of fall-run Chinook salmon in the Scott River and Shasta River through the 2016 runs. This post updates the escapement record for the two rivers through the 2018 runs with preliminary data on the 2019 runs.

Scott River

After a slight uptick in the run in 2017, the Scott fall-run 2018 escapement fell below the 2015-2017 runs (Figure 1); all were affected by the 2012-2016 drought. The run total as of mid-October 2019 was 23. It is too early for a coho update, but the run continues at minimum levels2 with a disappointing strong-brood-year 2016 performance3. A poor 2016 run is likely to lead to a poor 2019 run.

Shasta River

In sharp contrast to the Scott, the Shasta River run continues to improve over its historical record (Figure 2). The run total as of mid-October 2019 was 2,722. The Shasta River coho population remains at critically low levels.

The remarkable recent success of the Shasta River Chinook run from habitat restoration and improvements in water management (and the lack thereof on the Scott River) continues to be undermined by misinformation promoted within the agricultural community. A February 2019 article in the news outlet Grist reported:

In 2016, The Nature Conservancy announced plans to sell Shasta Big Springs Ranch. But without its water, which California Fish and Wildlife still owns, the land isn’t of much use for agriculture. And the fish don’t seem to be doing much better, either — though salmon still spawn at Big Springs, their numbers continue to fluctuate wildly from year to year. It seems that in this ecosystem so changed by people, the salmon need some local stewardship to thrive…

The Scott River remains “the most productive coho stream in California,” according to the nonprofit California Trout. When I spoke to Plank last he told me that the river was splashing. “These fish hatched on this ranch during the last drought,” Plank said. “Today, they’re returning.” [emphasis added]

The article asks the rhetorical question: “So how did such similar conservation efforts go so right at Scott River Ranch and so wrong at Shasta Big Springs Ranch?” For fall-run Chinook, at least, the numbers tell a different story. As for coho, there is no evidence that the population is going anywhere but downhill.

The difference in water management between the two rivers is readily seen in the flow records over the last four years (Figures 3 and 4). The Shasta River has improved flows, whereas the Scott River has had historically low fall flows that keep salmon from ascending from the Klamath to the Scott River spawning grounds. Low summer and fall flows (Figure 3) have also led to very poor survival of young coho and Chinook salmon over-summering in the Scott River.

Figure 1. Escapement of adult fall-run Chinook salmon to the Scott River from 1978 to 2018. Data source: CDFW.

Figure 2. Escapement of adult fall-run Chinook salmon to the Shasta River from 1978 to 2018. Data source: CDFW.

Figure 3. Scott River streamflow 2016-2019. Source: https://nwis.waterdata.usgs.gov/


Figure 4. Shasta River streamflow 2016-2019. Source: https://nwis.waterdata.usgs.gov/


Saving Killer Whales By Increasing Salmon Production

In a January 18, 2019 post, I related the state of Washington’s plan to increase the state’s hatchery salmon production to recover salmon populations and help the endangered southern population of killer whales.  In response to an executive order by the governor of Washington, the Washington Department of Fish and Wildlife’s proposed broad measures to increase the numbers of hatchery-raised salmon smolts released into killer whale migration areas that have minimal numbers of wild salmon.  The program would also enhance commercial and sport fisheries for salmon.  Much of the hatchery program would remain committed to recovery of threatened and endangered wild salmon stocks, which would also get a boost in essential habitat restoration.

The proposal in Washington state calls for an additional 30 million smolts for the Puget Sound estuaries (near Seattle) and an additional 20 million for the Columbia River estuaries, 50 and 20 percent increases, respectively.  The proposal recognizes:

 [H]atchery practices can pose serious genetic and ecological risks to wild populations if not managed carefully with full consideration of all that has been learned over the history of salmonid hatchery programs in the Pacific Northwest. However, the design of this proposal strives to minimize such negative impacts and to afford protection to the existing wild chinook populations to the greatest extent possible.

Elements of the program would include releasing hatchery smolts in lower river and estuary areas.  The program is designed to minimize effects on wild salmon by keeping these releases outside of the normal rearing and migration routes of wild salmon.  In some cases, hatchery salmon fry would be transported to net pens in lower rivers and estuaries for rearing and eventual release of smolts near the ocean, thereby further increasing smolt survival.  Returning adult salmon would home in on such sites, creating opportunities for terminal fisheries for hatchery salmon while retaining upriver spawning grounds for wild salmon.

A similar program is being planned and tested in California in the San Francisco Bay Estuary of the Sacramento and San Joaquin rivers.  Central Valley hatchery salmon smolts are already being trucked to the Bay and nearby coastal estuaries.  A new program element under consideration is the trucking of fry to local Bay estuary net pens for rearing.  If successful, this would create new terminal sport and commercial fisheries, while enhancing coastal fisheries and prey for the California Killer Whale populations.

One goal of the program in California would also be to shift hatchery salmon fisheries away from rearing areas and migration routes of wild salmon.  Rearing fry and releasing smolts in areas not frequented by wild salmon should reduce the effects of the hatchery program on wild salmon.  Similarly, terminal fisheries would focus harvest away from migration routes of wild salmon and reduce competition with wild salmon in spawning areas in upper rivers.  Commercial and sport fisheries would be enhanced along the coast.  New terminal fisheries would be created at estuary and coastal release sites that attract adults originally released at the sites as smolts.

If all goes well, such programs will benefit killer whales, sport and commercial fisheries, and wild salmon population (through reduced competition and better harvest management).

For more detail on Oregon and Washington Select Area Fisheries Enhancement programs see https://www.dfw.state.or.us/fish/OSCRP/CRM/reports/16_reports/2016%20_SAFE%20_Annual.pdf.