This is the second post in a series on California Salmon Recovery. I have chosen this post on the Yuba River salmon for the second in the series as an example of posts to come that summarize plans for each major salmon stream. Posts will also include summaries of a recommended hatchery program, fisheries harvest management, water supply and water quality management, wild salmon sanctuaries, and monitoring.
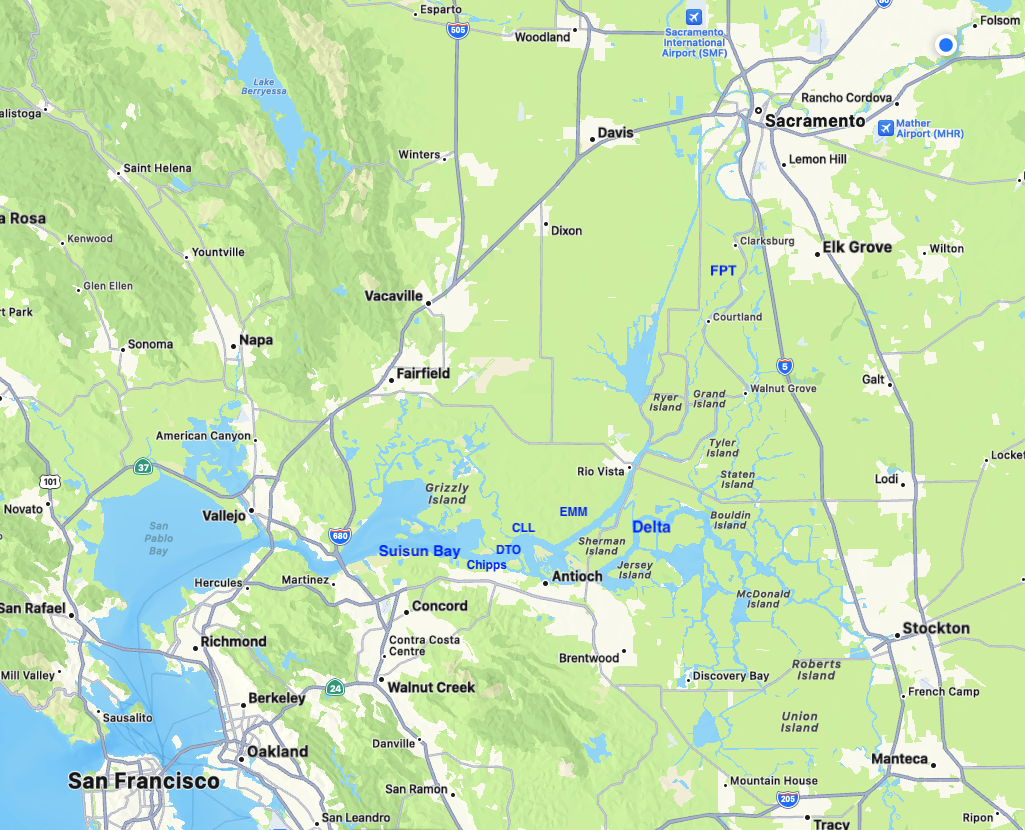
The Yuba River is the largest tributary of the Feather River, which in turn is the largest tributary of the Sacramento River. The Yuba River Watershed drains 1,339 square miles of the western slope of the Sierra Nevada and includes portions of Sierra, Placer, Yuba, and Nevada counties. The three branches of the Yuba River are the North Yuba, Middle Yuba, and South Yuba rivers (Figure 1).
Like many of the Sierra Nevada watersheds, the Yuba River has large dams and multipurpose water storage reservoirs. Major high-elevation reservoirs in the Middle Yuba and South Yuba drainages include Jackson Meadows and Bowman, owned by Nevada Irrigation District (NID), and Fordyce and Spaulding, owned by Pacific Gas and Electric Company (PG&E). These entities own multiple smaller reservoirs in the watershed at elevations above 4000 feet. Together, in a hydropower and water supply system that in part dates to the Gold Rush, NID and PG&E export an average of 400,000 acre-feet of water from the Yuba watershed to the adjacent Bear River watershed each year.
Legacy gold mining is also a source in the Yuba watershed of large volumes of alluvial sediment stored in river channels, bars, and floodplain terraces. Much sediment has been transported and deposited in New Bullards Bar and Englebright reservoirs, the watershed’s two largest low-elevation reservoirs, as well behind smaller dams (e.g., Our House Dam, Daguerre Point Dam) and the lower river floodplain (e.g., the Yuba Goldfields). These reservoirs and dams also block natural sediment transport processes that generally support spawning and rearing habitats of salmon.
The North Yuba River flows into New Bullards Bar Reservoir, constructed in 1970 and owned and operated by the Yuba Water Agency (YWA). The reservoir has a total storage capacity of 966 TAF and a minimum pool of 234 TAF. It is the principal storage facility of the YWA’s Yuba River Development Project, one of the largest hydropower projects in the state, and is also in the cornerstone of YWA’s water supply operation for Yuba County agriculture and water sales under the “Yuba Accord.” The lower North Yuba flows for approximately two miles below New Bullards Bar Dam, where it is joined by the Middle Yuba to form the “mainstem” Yuba River. Approximately six miles farther downstream, the North Yuba flows are impounded in New Bullards Bar Reservoir and later returned to the mainstem Yuba through releases at YWA’s Colgate powerhouse. The mainstem Yuba River flows approximately one mile from the New Colgate powerhouse before entering Englebright Reservoir. The South Yuba River enters Englebright Reservoir from the southeast, about a mile farther downstream. The 24 miles from Englebright Dam to the mouth on the Lower Feather River at Marysville are termed the “Lower Yuba” River (Figure 1).
Daguerre Point Dam, located 11 miles downstream of Englebright Dam and 11.5 miles upstream of from the Yuba River’s confluence with the Feather River, allows diversion of water into three large water supply canals of the Yuba Water Project. The canal intakes are poorly screened and thus allow the entrainment or predation of juvenile salmon migrating downstream. Two fish ladders are only partially successful in passing migrating salmon and steelhead past the dam. The ladders do not meet modern fish passage criteria.
Historically, spring-run salmon and steelhead were able to ascend into the Yuba’s three branches to about the 4,000 ft elevation. On the North Yuba, they ascended as far upstream as the reach between Downieville and Sierra City, about 20-30 miles upstream of New Bullards Bar Reservoir. They probably ascended only about a mile or so up the Middle Yuba because of a barrier cascade. On the South Yuba, they may have ascended to the mouth of Humbug Creek about 15 miles upstream of the main Yuba. Since the construction of Englebright Dam by the US Army Corps of Engineers in 1941, salmon and steelhead have been confined to the lower 24 miles of the Yuba downstream of Englebright Dam.
The Yuba River historically supported large numbers of spring-run and fall-run salmon as well as steelhead, but those numbers have greatly declined as the result of dams, historical gold mining, gravel mining, water resource mismanagement, and government apathy. In this post, I summarize actions needed to bring about Yuba River salmon and steelhead recovery.
Today, the most numerous Yuba salmon are the fall-run Chinook salmon (Figure 2). The 2017 spawning escapement estimate was a record low. The 2018 and 2019 runs were not much better. The 2020-2023 runs were only slightly higher. The 2013-2015 and 2020-2022 droughts, and associated water management, were major factors in these poor escapement levels. During these drought conditions, there was little flow into and through the Bay-Delta estuary, resulting in low numbers of smolts reaching the ocean and poor survival of returning adults in spawning runs.
The Yuba River’s salmon and steelhead runs now suffer from recruitment failure – the lack of spawners and smolt production to sustain the populations of salmon and steelhead. The 2018 and 2019 runs were poor despite being the product of normal (2016) and wet (2017) water years, water year types that historically produced stronger recruitment. The cumulative effect of poor recruitment is low spawner numbers – below target levels needed to replace the population (see Figure 3).
Another major factor in the long-term decline in the Yuba fall-run salmon is the continuing and persistent dwindling numbers of wild spawners and the increase in hatchery strays that now make up more than 90% of the run. Strays from hatcheries and other rivers lead to the genetic erosion of the locally adapted Yuba River wild salmon population. This was the diagnosis of the decline of the overall Feather River watershed population by Willmes et al., 2018.
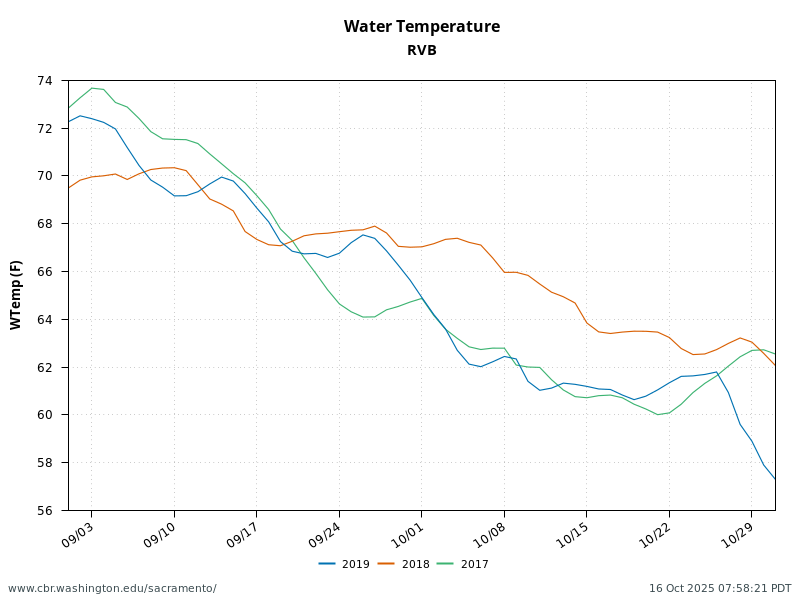
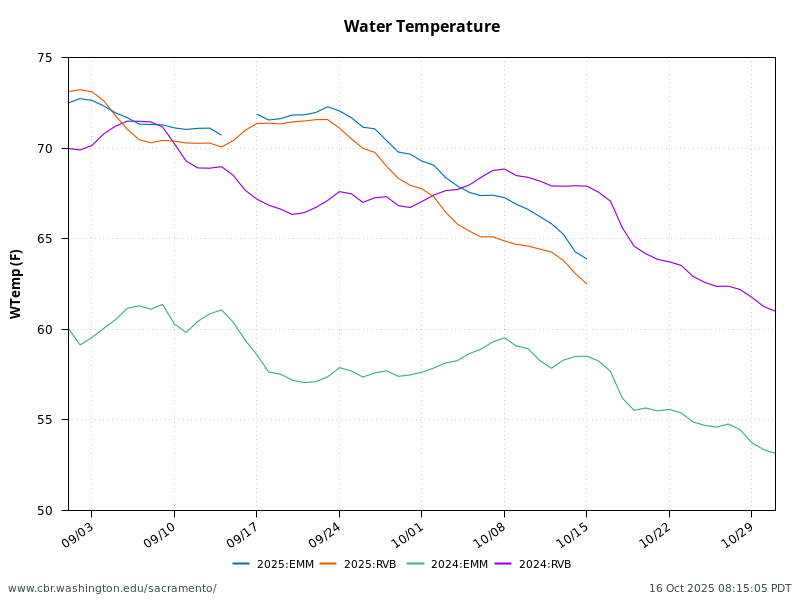
Other contributing factors in the decline of Yuba salmon include (1) low survival of young salmon and steelhead due to poor spawning and rearing habitat, and (2) stresses and impediments the fish encounter during both upstream and downstream migrations. Poor spawning habitat can result in poor pre-spawn survival and poor subsequent egg and fry survival. Rearing habitat factors include excessively warm water, low streamflow, lack of spawning gravels, lack of cover, insufficient food supplies, predation (especially downstream of Daguerre Dam), and loss at water diversions. Harvest of adults in commercial and sport fisheries also limits recruitment, though there is no in-river harvest of salmon allowed in the Yuba River itself. High water temperatures in the lower Yuba River in late summer and fall may also discourage adult salmon from choosing the Yuba in some very dry years. Habitat stresses downstream of the Yuba in the Sacramento River, Delta, and Bay also limit the survival of Yuba River salmon in their migration to and from the ocean.
The cumulative impact of all these factors eventually leads to recruitment failure – the present state of the Yuba River salmon populations. Hatchery strays sustain the Yuba River salmon and steelhead populations under present conditions.
Recommended Actions
Listed below is an array of short term (ST) and long term (LT) recommended actions to recover salmon and steelhead in the Yuba River.
Action ST-1: Establish a new fish monitoring station at Daguerre Point Dam to develop a genetic parentage-based tagging (PBT) database for Yuba River salmon and steelhead.
An immediate need is the means to identify, on an annual basis, the origins and numbers of adult salmon and steelhead currently returning to spawn in the Yuba River. This information would allow resource agencies to assess the present population status and composition of Yuba River salmon and steelhead populations.
Action ST-2: Segregate and enhance the population of wild spring-run Chinook salmon that spawns between Englebright and Daguerre Point dams.
Segregate spring-run from fall-run salmon by restricting fall-run to spawning below Daguerre Dam. Operate Daguerre Point Dam ladders to allow passage of only spring-run salmon (and steelhead). Establish a spring-run salmon sanctuary between Englebright and Daguerre Point dams.
Action ST-3: Improve Yuba River habitat conditions for salmon and steelhead spawning, rearing, adult immigration and holding, and the outmigration survival of fry/smolts.
Habitat improvements would include streamflow, water temperature, and physical habitat elements (substrate, channel and floodplain configuration, large wood debris, water quality, and riparian vegetation). This would apply to habitat above Daguerre Point Dam for spring-run salmon and steelhead, and below Daguerre Dam for fall-run salmon and steelhead.
Action ST-4: Begin planning for a conservation hatchery for spring-run Chinook salmon and steelhead.
Resource agencies may find the Yuba River numbers and/or genetic diversity of spring-run salmon and steelhead numbers so low that stock supplementation from a temporary conservation hatchery is needed. Use spring-run sourced from the Yuba River’s natural spawning population, from a hatchery, or from another nearby natural spawning population for broodstock. Release hatchery eggs/fry into the Yuba River upstream of Daguerre Point Dam, Englebright Dam, or New Bullards Bar Dam. In the short-term, undertake conservation hatchery actions at the Feather River Fish Hatchery complex.
Action ST-5: Modify the Daguerre Point Dam fish ladders to provide seasonal temporary capture/release of upstream-passing spring-run salmon and steelhead (for monitoring), and to exclude fall-run Chinook. Improve the fish passage performance of the Daguerre ladders to meet modern (NOAA and CDFW) standards.
Over the short term, use gravity-fed sources or pumps to improve the attraction flows at the ladder entrances (i.e., downstream exits). Such efforts may prove effective in the late spring period under low-flow regimes to ensure minimal stress or delays of adult migrant spring-run salmon and steelhead.
Action ST-6: Conduct trap-and-haul experimental studies for spring-run salmon and steelhead from Daguerre Point Dam to the upper Yuba upstream of Englebright and/or New Bullards Bar reservoirs, consistent with existing study plans, to assess the various aspects and feasibility of such efforts.
Action ST-7: Begin the process of updating the fish screens at the major diversions at Daguerre Point Dam so they meet NMFS and CDFW criteria for downstream-migrating juvenile salmon and steelhead.
Action ST-8: Begin the process of installing fish screens at presently unscreened small agricultural diversions downstream of Daguerre Point Dam, near Hallwood and further downstream.
Action LT-1: Design and build new fish passage facilities at (or near) Daguerre Point Dam, which may include:
- New fish passage infrastructure in the form of upgrades to existing ladders or other passage types such as the fish bypass system currently under evaluation.
- A segregation weir in which adult salmon and steelhead can be captured, held for processing, and selectively released to continue passage past the dam. Undesirable non-salmonids can be precluded from bypass use (blocked or in some cases removed or relocated).
- Downstream fish passage collection facilities (may be part of separation weir) to collect, count, and process juvenile (and downstream-migrating adult steelhead) salmonids, and other migratory fish (i.e., sturgeon, lamprey, shad, pikeminnow, suckers, etc.). The facilities would include the ability to collect wild juvenile salmonids for transport to the Bay in drier years or seasons when their potential for survival would be otherwise minimal.
- Fish holding and processing facilities associated with holding and processing fish collected at the segregation weir, including cold-water sources (g., well systems).
- A conservation hatchery for spring-run salmon and steelhead that would include egg taking, hatching, rearing, and processing facilities.
- Modern fish screens for water diversion facilities at Daguerre Point Dam.
Action LT-2: Conduct large-scale pilot fish trap-and-haul projects
Establish one or more spring-run salmon sanctuaries above Englebright Dam. Trap-and-haul spring-run salmon and steelhead adults upstream for release in the Yuba River upstream of New Colgate Powerhouse or in the North Yuba River upstream of New Bullards Bar Reservoir. Capture downstream-migrating juveniles produced from the adult spawners in a net-collector in the Yuba River near the head of Englebright Reservoir and/or in upper New Bullards Bar Reservoir or in the North Yuba River upstream. Transport juvenile fish to a location downstream of Englebright Dam or Daguerre Point Dam, or to the Bay, for release, or to a conservation hatchery for supplementary rearing and later release to the Bay.
Action LT-3: Conduct large-scale fish habitat improvement projects
Improve migrating, spawning, and rearing habitat in salmon sanctuaries upstream and downstream of dams.


Figure 2. Yuba River fall-run salmon escapement 1975-2023. (Data Source: CDFW Grandtab)

Figure 3. Spawner-Recruit relationship (log-log transformed) for Yuba River fall-run salmon population. Numbers are recruits (escapement that year). Spawners are recruits from three years earlier. Red bold numbers are years where recruitment was influenced by critical drought years (during their spawn, first year of rearing, and upon return as adult spawners). Smaller non-bold red numbers reflect years with at least two below-normal water years. Blue bold numbers are years strongly influence by series of wet years.