The Department of Water Resources’ consultant on in the WaterFix tunnels hearing testified:
“But for those Smelts that are occurring in that area, the North Delta diversions will be designed to fish agency protective standards”… “That opening, based on analyses, would prevent entrainment of Smelts that are greater than about 21 to 22 millimeters.”1
“In the EIR/EIS, the only significant and unavoidable impact that we found was for Striped Bass and American Shad. This is because of entrainment of early life stages at the North Delta diversions. These are species that spawn upstream of the North Delta diversions, in large part…..2
For American Shad, studies suggest that many American Shad were upstream of the Delta and, therefore, when they’re coming down into the Delta, they would be sufficiently large to be screened by the North Delta diversions.”
Delta Smelt
Delta smelt spawn in the north Delta in late winter and early spring. Their juveniles occur through summer. Their young would be highly susceptible to entrainment throughout spring (Figure 1).
White Sturgeon
Sturgeon, both green and white, spawn above the Delta in the lower Sacramento River in early spring. Their larvae and early juvenile stages reach the Delta in spring at a size highly vulnerable to entrainment (Figure 2).
American Shad
American shad spawn in the lower Sacramento River and tributaries in late spring and summer. Their larvae and early juveniles are prevalent in the north Delta in late spring and would be highly vulnerable to entrainment (Figure 3).
Striped Bass
Striped bass spawn predominantly in the lower Sacramento River in spring. Their larvae reach the north Delta in May and June, and would be highly vulnerable to entrainment (Figure 4).
Splittail
Splittail spawn in the lower Sacramento River floodplain in spring. Their early juveniles reach the north Delta usually in May and would be highly vulnerable to entrainment (Figure 5).
Prickly Sculpin
Prickly sculpin, an abundant native Delta fish, spawn in the lower Sacramento River in late winter and their larvae are found in the north Delta in early spring and would be highly vulnerable to entrainment (Figure 6).
Sacramento Sucker
Sacramento sucker spawn in Valley rivers in spring. Their larvae and early juveniles are present in the north Delta throughout spring and would be highly vulnerable to entrainment (Figure 7).
Threadfin Shad
Non-native threadfin shad, the most abundant forage fish in the Delta, spawn from late spring into summer throughout the Delta and lower rivers. Their larvae and early juveniles are prevalent in the north Delta in late spring and early summer, and would be highly vulnerable to entrainment (Figure 8).
Summary and Conclusions
Larval and early juvenile lifestages of many Delta fishes would be highly vulnerable to entrainment through the screens of the proposed WaterFix north Delta intakes. Juvenile/fry of these and other species (salmon3) would be highly vulnerable to impingement and predation at the screens.
Figure 1. Length frequency of Delta smelt captured in the California Department Fish and Wildlife’s annual Delta-wide 20-mm Survey. For each sub-graph within this figure and each of the following figures, the x-axis shows the length in millimeters of captured fish, and y-axis shows the number of captured fish of each length. Note that most of the early spring post-spawn larvae and juveniles are of a size highly vulnerable to entrainment (<20 mm).
Figure 2. Length frequency of white sturgeon captured in the 20-mm Survey . Note larval sturgeon were captured soon after their spawning period in spring at a highly vulnerable size to entrainment. Many larvae of the main lower Sacramento River population of white sturgeon would pass the proposed WaterFix intakes.
Figure 3. Length frequency of American shad captured in the 20-mm Survey . Note that most of the shad would have to pass the proposed north Delta intakes in spring at a size highly vulnerable to entrainment (<20 mm).
Figure 4. Length frequency of striped bass captured in the 20-mm Survey . Note that most of these striped bass larvae would have had to pass the area of the proposed north Delta WaterFix intakes at a size would be highly vulnerable to entrainment (<20 mm).
Figure 5. Length frequency of splittail captured in the 20-mm Survey Note that many splittail spawn in the Sacramento Valley floodplain just upstream of the proposed north Delta WaterFix intakes, and that many of the juvenile splittail emigrating back to the Delta would pass the proposed WaterFix intakes at a size vulnerable to entrainment (<20 mm).
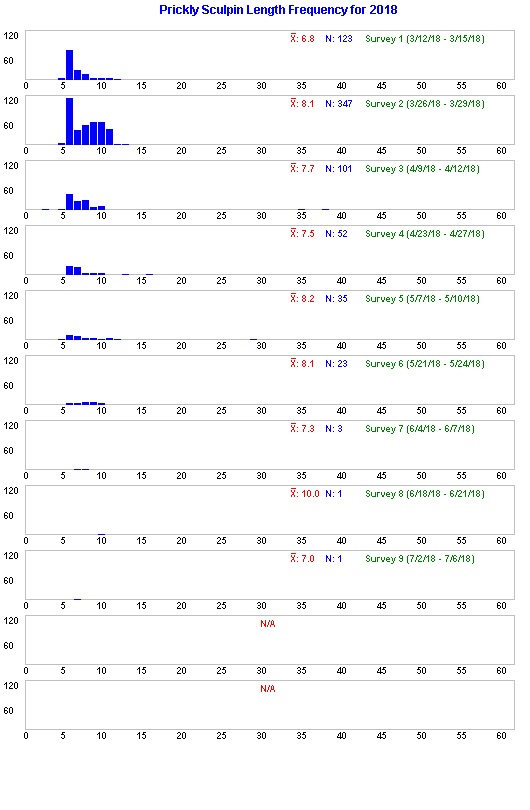
Figure 6. Length frequency of prickly sculpin captured in the 20-mm Survey . Note that the larvae of winter-spring spawning sculpin would be highly vulnerable to entrainment (<20 mm).
Figure 7. Length frequency of native Sacramento sucker captured in the 20-mm Survey . Note that the juveniles of late winter-early spring river spawning suckers return to the Delta at a size vulnerable to entrainment (<20 mm).
Figure 8. Length frequency of threadfin shad captured in the 20-mm Survey . Note the late spring-early summer spawning threadfin shad are highly vulnerable to entrainment (<20 mm).
- WaterFix hearing transcript, 2/23/18, Page 124, line 2: Dr. Greenwood testimony at State Board WaterFix hearing. ↩
- Id., Page 156, line 6. Note that many shad and striped bass spawn their buoyant eggs in the area of the proposed intakes and immediately upstream, as well as in the lower Feather, Sacramento, and American rivers. Nearly all the eggs and newly hatched larvae would pass the proposed CWF intakes. ↩
- Much of the wild salmon production from the American and Feather rivers’ fall-run populations comes from fry (30-50 mm) leaving these rivers in winter. Winter is the peak period of proposed north Delta diversions of the WaterFix project. These fry would not be protected by the proposed WaterFix screens. ↩