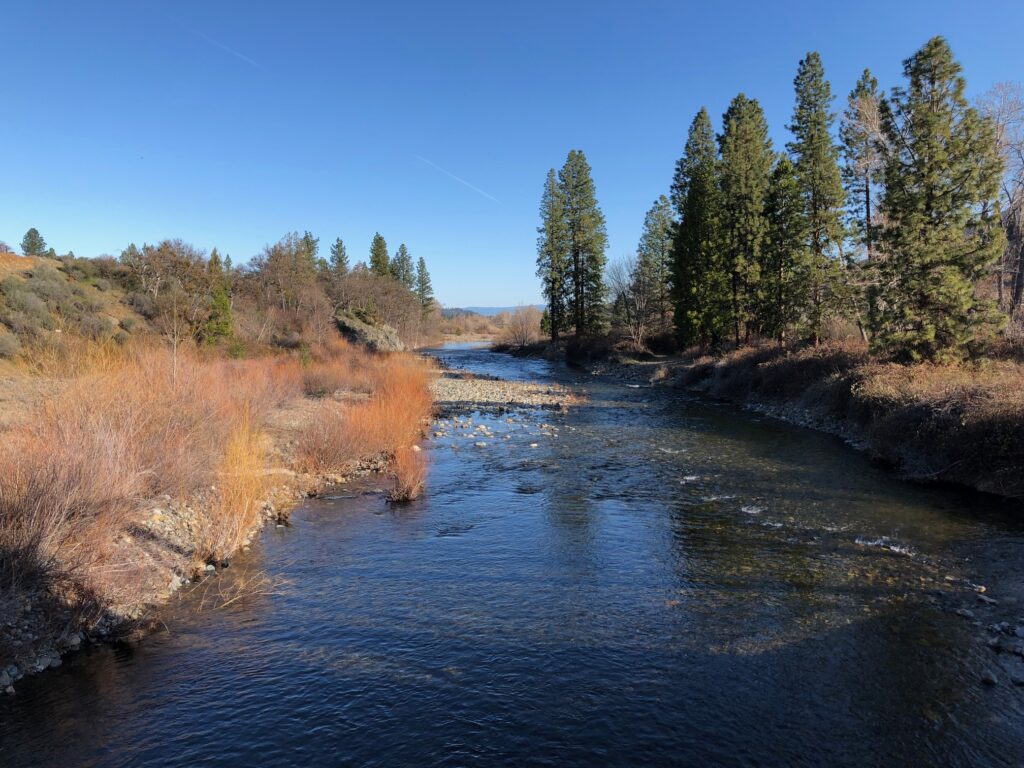
The upper Scott River near Callahan in early spring of drought year 2013.
At the end of November 2023, the Beaver Moon, the last full moon before December, appeared. The Beaver Moon was so named because it was the last chance for trappers to catch beaver with full coats before winter set in. The Beaver Moon also occurs at the peak of the Coho and Chinook salmon runs in the Scott River Valley, once named Beaver Valley. The beaver were once very abundant before being “removed” by ranchers and trappers. Today, beaver are slowly coming back. The beaver help maintain the local groundwater tables, streamflow, water temperatures, riparian vegetation, and create good coho salmon rearing habitat.
The State Water Resources Control Board took up the Scott and Shasta Rivers water issues again in fall 2023, following its adoption of emergency drought regulations in 2022 and a 2023 petition from the Karuk Tribe and environmental organizations to protect salmon and steelhead in the Scott river in all water years.
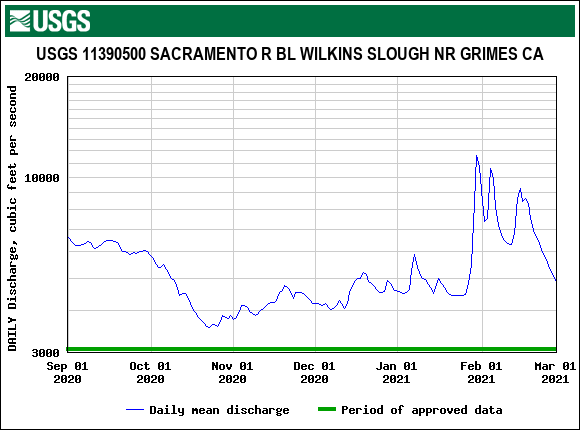
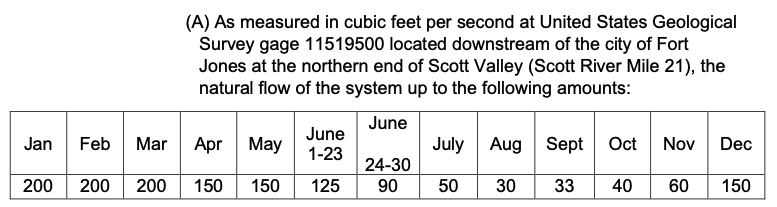
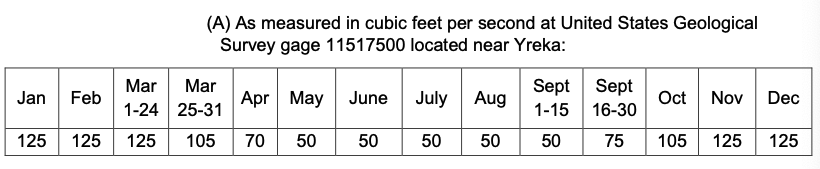
The emergency regulations for 2022 called for summer minimum flows of 30-50 cfs in the Scott River and 50 cfs in the Shasta River. Such minimums were not achieved on the Scott River (Figure 1), but for the most part were achieved on the Shasta River (Figure 2). Such flows were necessary for two key flow functions: (1) maintaining connectivity between spawning and rearing areas in the valleys and the Klamath River, and (2) sustaining over-summering rearing habitat of salmon and steelhead throughout the two rivers and their tributaries.
Without adequate summer flows, salmon fry become trapped in upstream spawning areas without access to productive spring-fed Valley rearing habitat. Maintaining flow in Valley spring-fed habitats provides connectivity and rearing refuges. Late summer and fall minimum flows are necessary to provide access to the valleys from the Klamath River canyon for salmon and steelhead adult spawners.
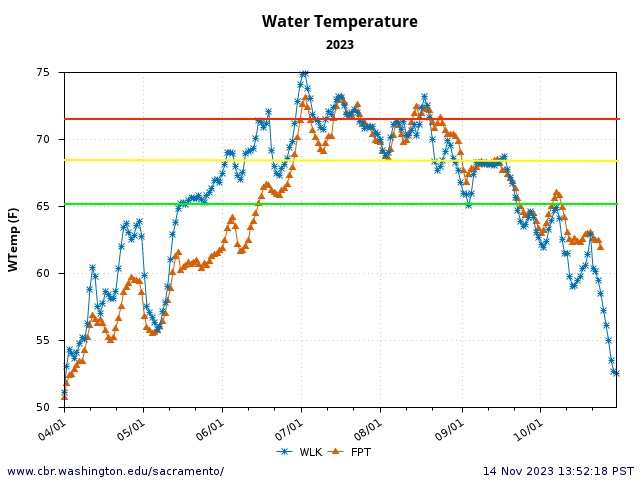
The State Board should have kept some emergency order elements in place after the orders ended in July 2023, even though 2023 was a wet year. In 2023, both rivers and their salmon were stressed again by low flows (Figures 3 and 4).
Because base flows from mountain and valley springs are just over 100 cfs in both streams, stressful conditions are brought on by the cumulative effects of small water diversions and groundwater pumping. Surface water diversions and groundwater extraction for agricultural and domestic water use draw from this supply, with peak use in the summer-fall irrigation season. On the Shasta River, the irrigation season ends at the beginning of October, allowing flows from springs to fill the river channel for returning salmon. On the Scott River, the irrigation season extends through November to water pastures and to get in the last crop of hay.
In the Shasta River, flows in October are sufficient for Chinook spawners passage to spawning areas around Big Springs in Shasta Valley. But in the Scott Valley, Chinook often do not have adequate passage flows to ascend from the Klamath Canyon up to Scott Valley until the first late-fall rains. In most years, early December rains accommodate the Coho run in the Scott River. Young salmon from the prior year’s spawning also need the fall flows to emigrate from the Valley to the Klamath River and ocean.
2023 Karuk et. al. Petition for Scott River
On May 22, 2023, the Karuk Tribe, Environmental Law Foundation, Pacific Coast Federation of Fishermen’s Association, and Institute for Fisheries Research petitioned the State Water Board to initiate a rulemaking to establish permanent (not just emergency) instream flows on the Scott River.
As an initial response, the State Water Board re-adopted, on an emergency basis, the emergency minimum instream flows previously in effect in both the Scott River and Shasta River.
Comment: The State Board did not readopt the emergency regulations in wet year 2023 and the salmon suffered.
2024 Coastkeeper et al. Petition for Shasta River
On January 17, 2024, California Coastkeeper Alliance, Friends of the Shasta River, Mt. Shasta Bioregional Ecology Center, Water Climate Trust, Shasta Waterkeeper, Save California Salmon, and Environmental Protection Information Center petitioned the State Water Board to initiate a rulemaking to establish permanent (not just emergency) instream flows on the Shasta River.
Recommendations
As an initial matter, the State Water Board should adopt as permanent the minimum instream flows it adopted on February 1, 2024 as emergency instream flows. This will put an immediate end to dry streambeds in the summer and fall as shown in Figures 3-5 below. This will admittedly also significantly reduce water available for human use and cause a conflict between groundwater and surface water users, as well as among water right holders.
In the longer term, there are some relatively straightforward additional measures that could help create solutions to the problems in Scott and Shasta Valleys and potentially reduce the water supply impacts. Whether these actions are equitable, reasonable, cost-effective, and/or politically doable is open to question and evaluation. The adoption of the flow requirements as shown must not be contingent on the implementation or effectiveness of such actions.
Possible additional measures include:
- Create additional instream or off-stream storage to capture winter water for summer release to meet demands and needs.
- Make concerted efforts to recharge groundwater storage with the often-plentiful winter-spring runoff.
- Deepen the river channel by removing accumulated fine and course sediments to enhance channel access to groundwater. Removing Young’s Dam in the middle Scott Valley would deepen channel upstream and alleviate the dam’s impediment to salmon and steelhead migration.
- Eliminate all surface water diversions from stream channels. There are many small water diversions from the Scott and Shasta rivers that divert streamflow and juvenile salmon. Surface diversions should be replaced by a regulated groundwater extraction program.
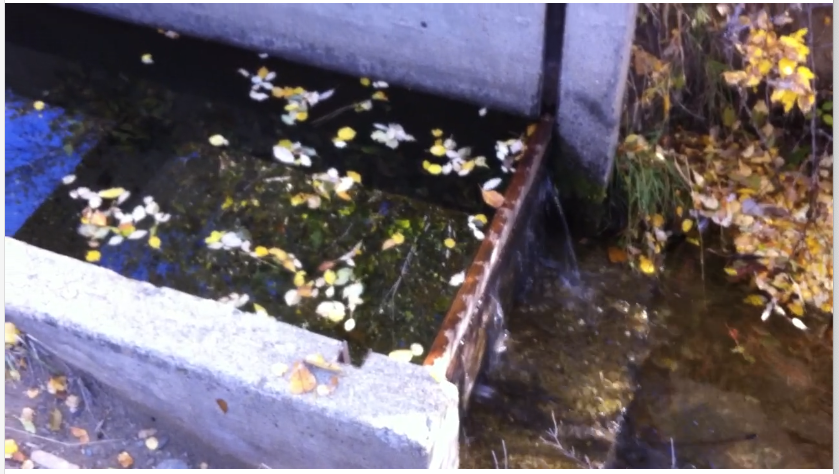
Small water diversion on a Scott River tributary. All small and larger surface diversions should be eliminated. The present system was controlled by the state watermaster program that no longer covers the Scott River and its tributaries.
- Use unused well capacity to temporarily augment surface water flow in the streams in late summer to help with salmon migrations and to accommodate spawners. In Scott Valley, many hay producers cease pumping from wells at the beginning of August or September. A monitoring and evaluation program would be required to avoid long-term impacts to groundwater levels. The target flow in both the Scott River and Shasta River should be near 100 cfs by October 1 at the Fort Jones and Yreka gages, respectively.
- Enhance and restore water storage in mountain and valley meadows through watershed management, including introductions of beaver.
- Institute an aggressive water conservation program in the two watersheds.
Latest Actions
The petitioners requested the following:
Drought emergency minimum flows are specified below:
Scott River:
 Shasta River:
The State unveiled the California Salmon Strategy for a Hotter, Drier Future: Restoring Aquatic Ecosystems in the Age of Climate Change on January 31, 2024. The Strategy describes state actions for the Scott and Shasta rivers, as follows:
Scott/Shasta:
- Designate Salmon Strongholds: the Klamath River and its tributaries including the Salmon, Scott, and Shasta rivers.
- In April 2023, CDFW awarded $20 million in Drought Emergency Salmon Protection Grants to 10 projects demonstrating support from and collaboration with Tribal Nations and landowner interests in the Shasta and Scott rivers and their watersheds. These include habitat improvement, removal of barriers to fish passage, and groundwater recharge projects that help ensure streamflow.
- The State Water Board, acting upon a petition from the Karuk Tribe, began consideration of an emergency regulation in 2023 to set emergency minimum flows for the Scott and Shasta rivers while a longer, inclusive process evaluates long-term strategies for these salmon strongholds.
- By early 2024, commence work to establish minimum instream flows in the Scott and Shasta Rivers, working with local partners on locally driven solutions and coordinating on options for incentivizing the reduction of diversions and groundwater pumping. (SWRCB, CDFW)
- Currently, with state funding support, the Yurok Tribe, the Karuk Tribe, California Trout, Scott River Water Trust, and Farmers Ditch Company are developing a design-build project to restore habitat in the Scott River and improve water diversion infrastructure for on-farm water utilization and efficiency.
For more on the Scott River issues see: https://calsport.org/fisheriesblog/?p=1608 .
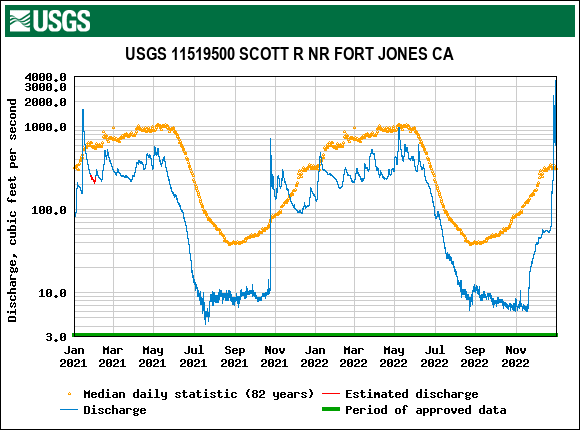
Figure 1. Scott River streamflow in 2021 and 2022 at Fort Jones gage. Note the end of the irrigation season in November-December. Note also prescribed emergency flows were not met in 2022.
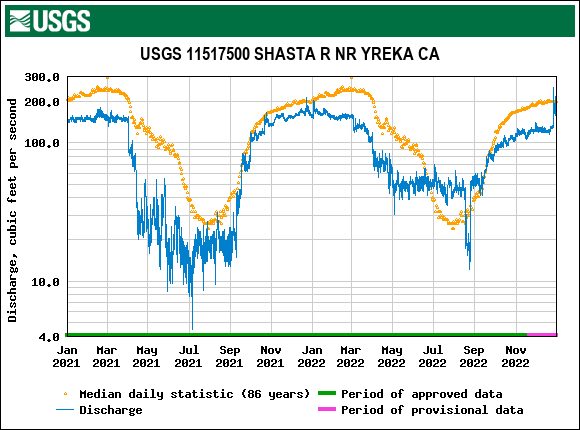
Figure 2. Shasta River summer 2021 and 2022 streamflow at the Yreka gage. Note the end of the irrigation season on October 1st. Note also prescribed emergency flows were met in 2022 with the exception of about a one-week period in August.
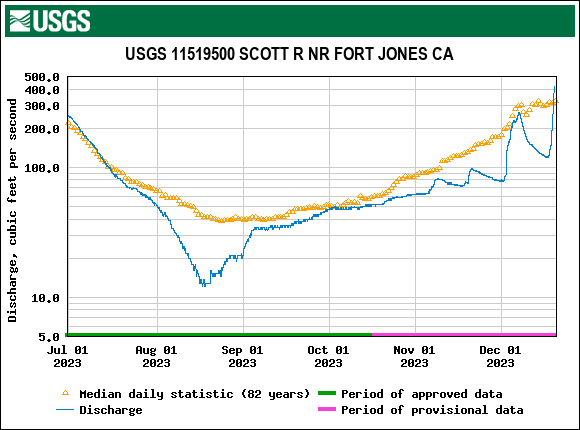
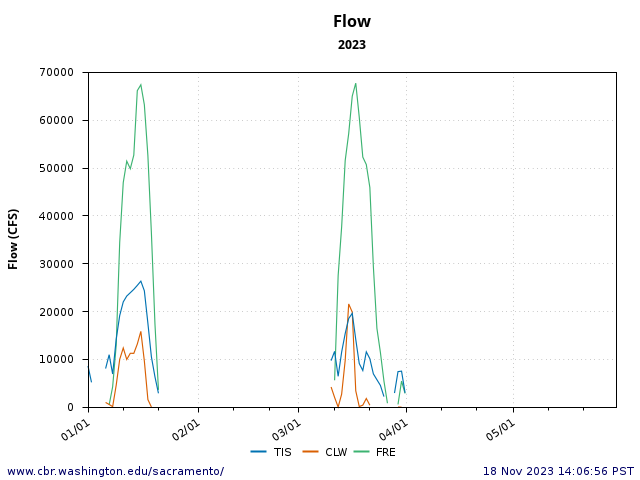
Figure 3. Scott River streamflow in summer-fall 2023 at Fort Jones gage. Note the July 2023 flow reduction when the emergency flow regulations ended. Note also the end of the irrigation season on December 1st.
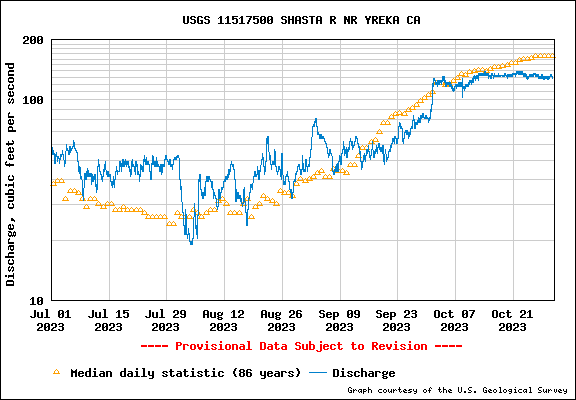
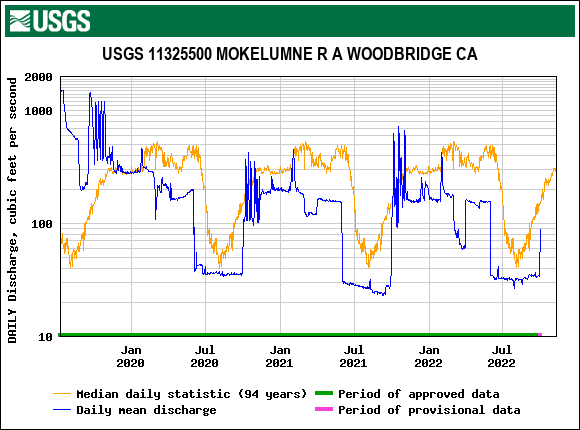
Figure 4. Shasta River summer 2023 streamflow at the Yreka gage. Note the July 2023 flow reduction when the emergency flow regulations ended. Note also the end of the irrigation season on October 1st.
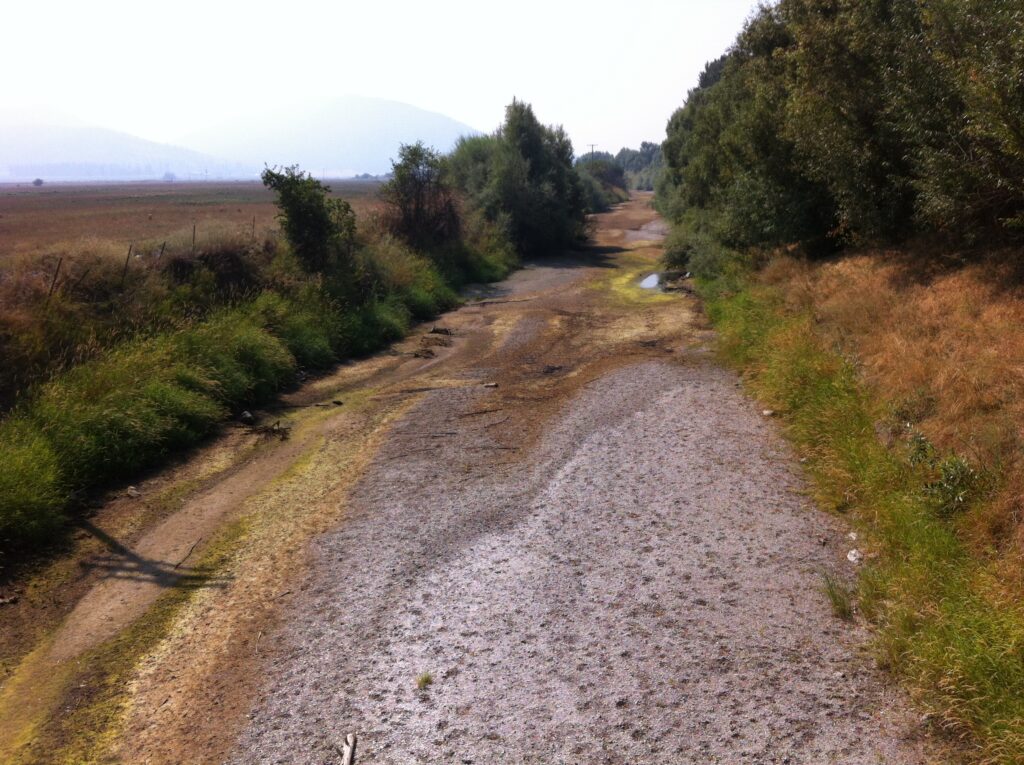
Figure 5. Scott River in Scott Valley in August 2013. The riverbed is perched above the water table that was low due to groundwater extraction for hay and pasture watering.
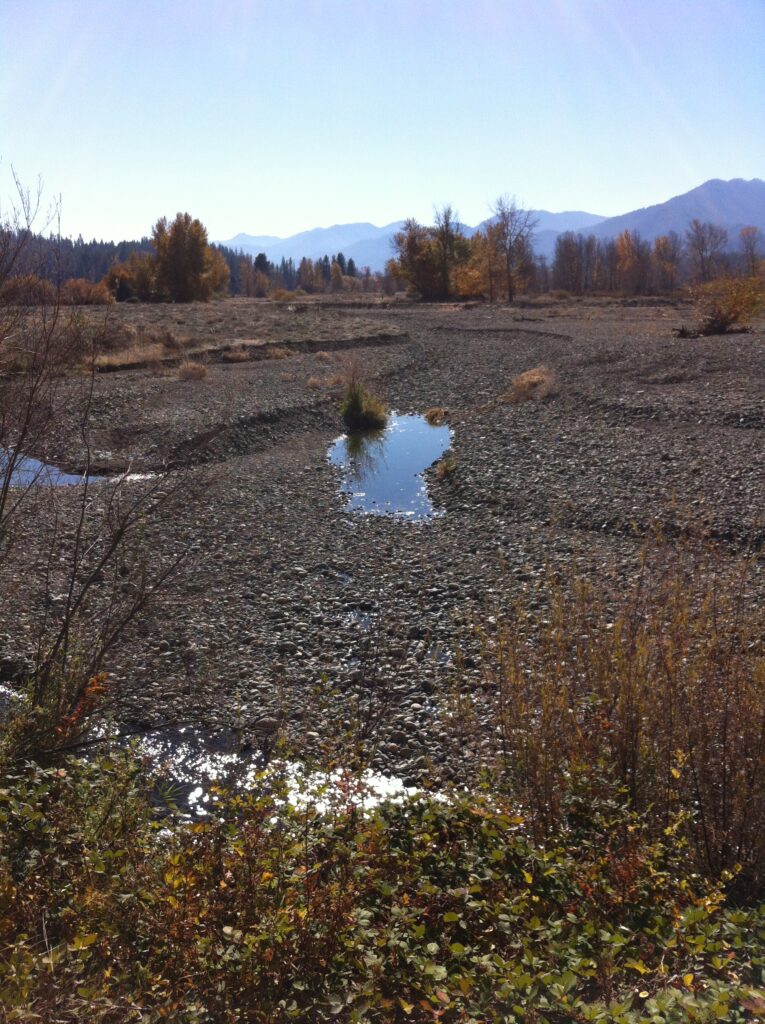
Figure 6. Lower Valley location of Scott River at the mouth of Shackleford Creek, a major salmon spawning tributary, on October 26, 2013.
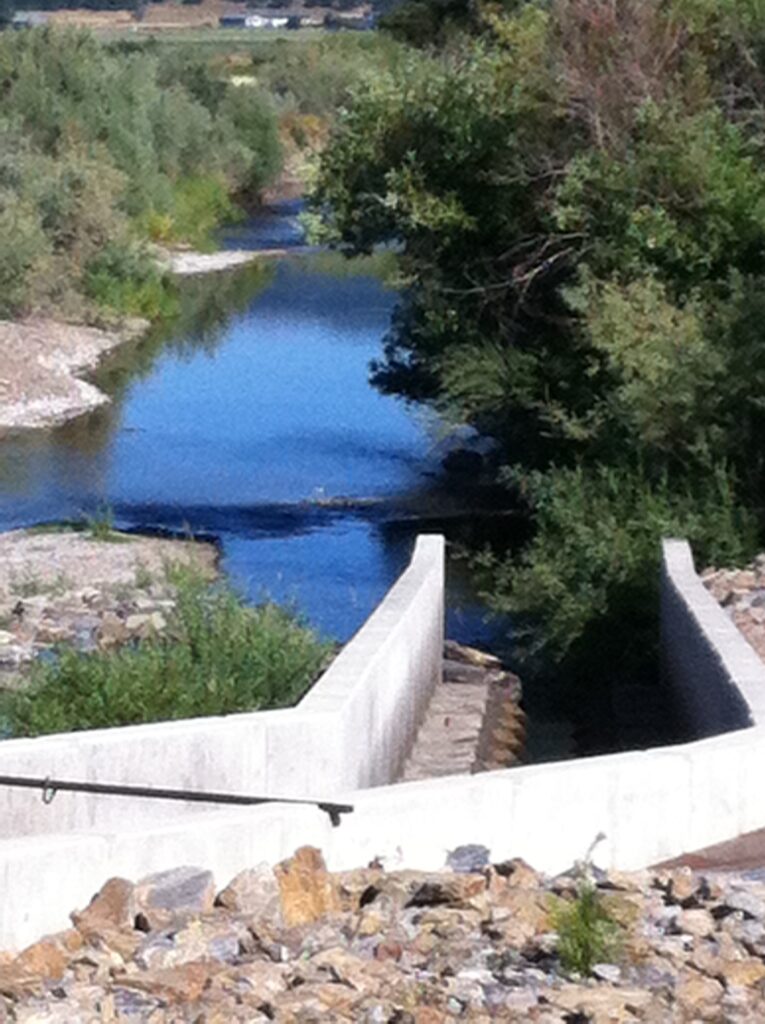
Figure 7. Young’s Dam and fish ladder. Portions of the dewatered Scott Valley stream are located in the perched channel upstream of Young’s Dam. Under low late-summer streamflows, the ladder at Young’s Dam is not functional and blocks the Chinook migration. The channel upstream of the dam is wide and perched above the water table, so it is often too warm, with insufficient flow and cover, for rearing salmon. In contrast, the channel below the dam is deep and shaded with spring-fed juvenile salmon refugia.