Management of flows and water temperatures in the upper Sacramento River near Redding for endangered salmon is frequently presented to the public as complicated, but it is really not that difficult to understand. Chart 1 below depicts about everything that is involved with Sacramento River flows and their history so far this spring. The box outlined in red indicates what has been wrong this spring. The high temperatures shown in this box have hurt winter-run salmon, spring-run salmon, late-fall-run salmon, and green sturgeon, as well as fall-run salmon, steelhead, trout, and white sturgeon. All of these species have suffered unnecessarily from this spring’s water management below Shasta.
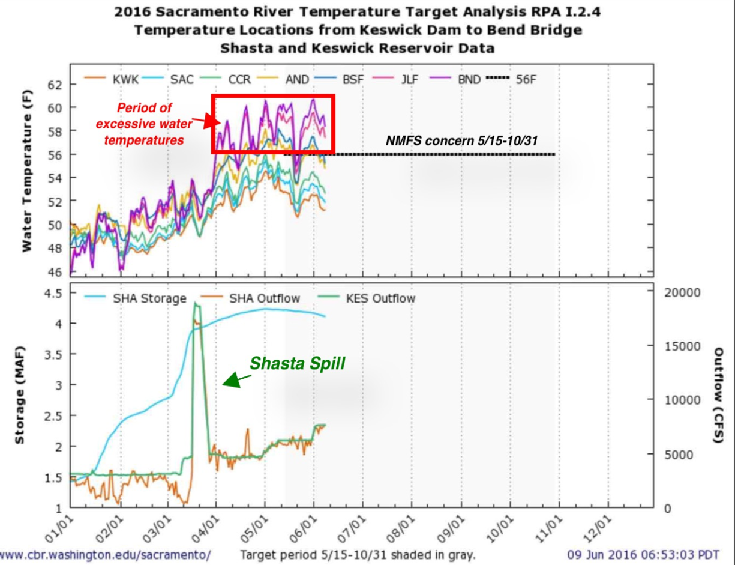
Chart 1. Latest update (6/9/16) from USBR on management of the upper Sacramento River below Shasta for winter-run Chinook salmon. The “spill” in late March was a managed flood release of over 200,000 acre-feet of storage, which kept Shasta (SHA) from filling (4.5 MAF). A key list of the location abbreviations pictured can be found in Table 1 at end of this post. A map of the locations is shown in Chart 3.
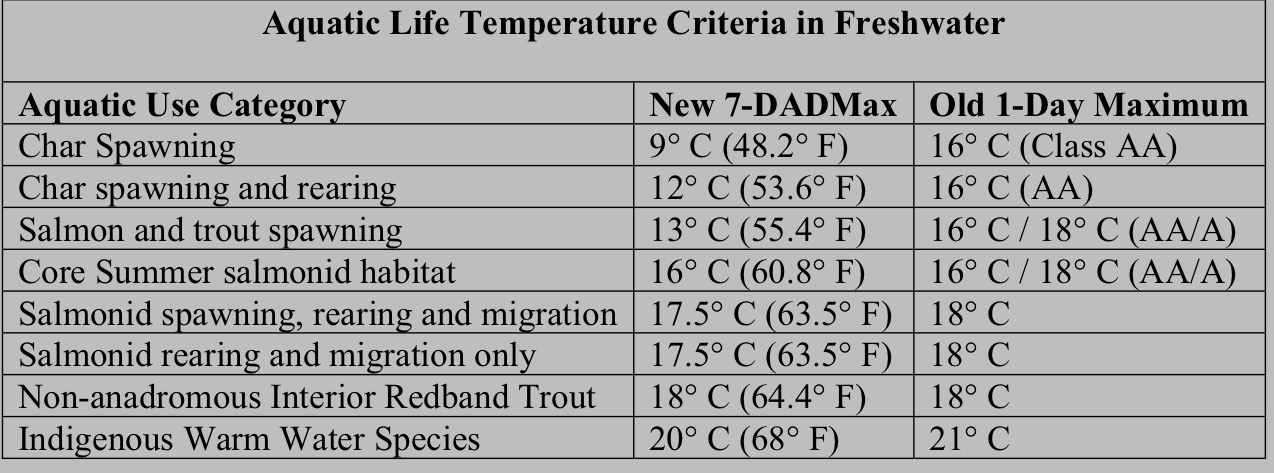
The red box in Chart 1 shows that water temperatures since April 1 have exceeded the 56°F target water temperature as defined in the State’s Sacramento Valley Basin Plan, the State’s Water Right Order 90-05 for Shasta Reservoir, and NMFS’s Biological Opinion for salmon and sturgeon as it applies to Shasta operations. These standards have been in place for many decades and are based on sound science.
In a March 31, 2016 letter to Reclamation1, a week after the flood control release from Shasta, NMFS stated: “Winter-run brood years in 2014 and 2015 experienced very low egg-to-fry survival to Red Bluff as a result of high water temperatures during their egg and alevin incubation stages. As brood year 2016 is the third of three winter-run cohorts, it is very important to operate Shasta Reservoirs conservatively to provide and maintain adequate water temperatures throughout the winter-run early life stages.” The letter concludes as shown immediately below:
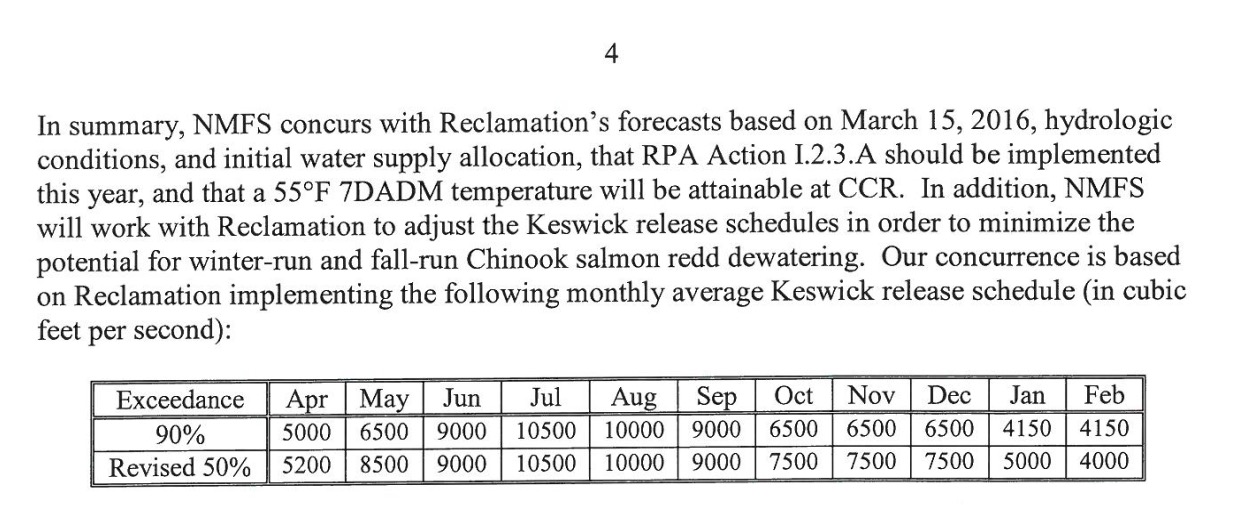
So, within a week of the flood release, and based on a pre-spill March 15 forecast by Reclamation, NMFS changed the management compliance point to 55°F 7-day-average-daily-maximum at CCR (Bonneville Bridge in Redding) as a surrogate for a 56°F daily compliance at Balls Ferry (BSF) and Jellys Ferry (JLF). Note that Chart 1 above shows that this surrogate did not satisfy the requirements for either BSF or JLF. Note also that none of the flows prescribed in the table above for April (was 4700), May (6000), or June (7500 so far) have been met. (These flows should have been daily average minimum flows, not monthly averages.)
In an April 22 letter to Reclamation, the Pacific Fisheries Management Council recommended a 56°F compliance point at Jellys Ferry (JLF). That too has been exceeded in May and June.
In a May 2 letter, NMFS changed the compliance point to Keswick Dam: “We will continue to use the maintenance of 52°F daily average temperature (DAT) at Keswick Dam as an indicator of the ability to meet 55°F 7-day average of the daily maximum temperatures (7DADM) at the Bonnyview Bridge temperature compliance point (CCR CDEC location) throughout the temperature management season.” Note this new Keswick criterion was not met in late April or early May, but seems to be controlling after mid-May (Chart 1).
So why has there been so much compromise this spring (red box, Chart 1)? Why not simply meet the longstanding objective of keeping the daily average water temperature at Bend (BND) near Red Bluff? The reason is an unfounded fear by the managing agencies that they will run out of cold water in Shasta before the end of summer, as occurred in 2014 and 2015. Storage in Shasta in spring 2016 started with 4.2 maf. In contrast, storage in Shasta in spring 2014 and 2015 started out at 2.4 and 2.7 maf, respectively. Storage in Shasta in spring 2013 started out at 3.8 maf and met the standard. Storage in Shasta in spring 2009 started out at 3.2 maf and met the standard. There was more cold-water volume stored in Shasta this spring than the total spring storage in 2009 or 2013.
Between March 18 and March 28, 2016, a “flood release” of over 200,000 AF occurred, but the reservoir storage still rose from 3.9 to 4.0 maf. Most of the water released during the flood release was warmer surface water (Chart 2). Even then, the average water temperature from the surface outlets (upper gates) was only 48-50°F.
There is simply no information that indicates the reservoir will run out of cold water by the end of summer. Even Reclamation’s own conservative modeling indicates that a compliance point of 56°F at Balls Ferry can be met, which appears to be the present target in early June (Chart 1).
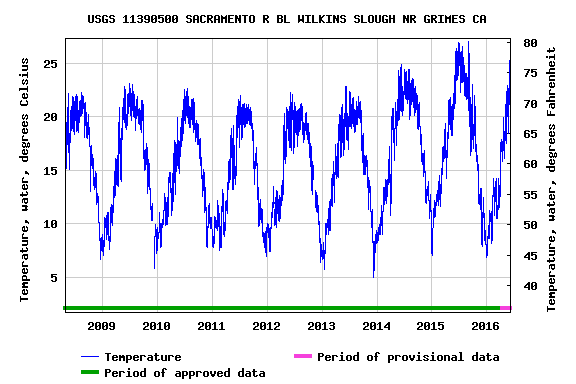
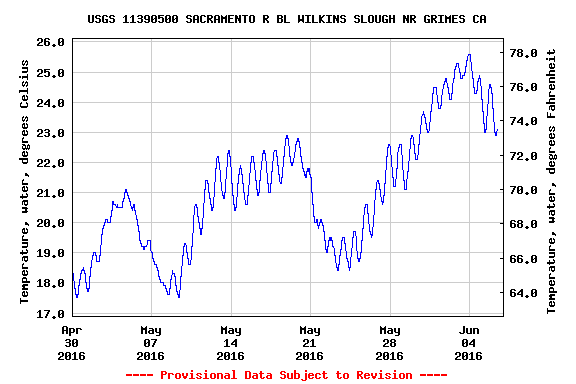
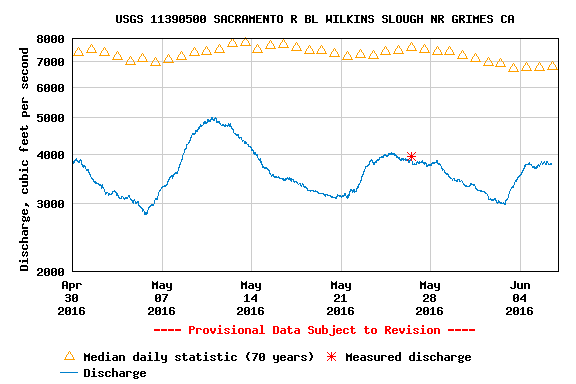
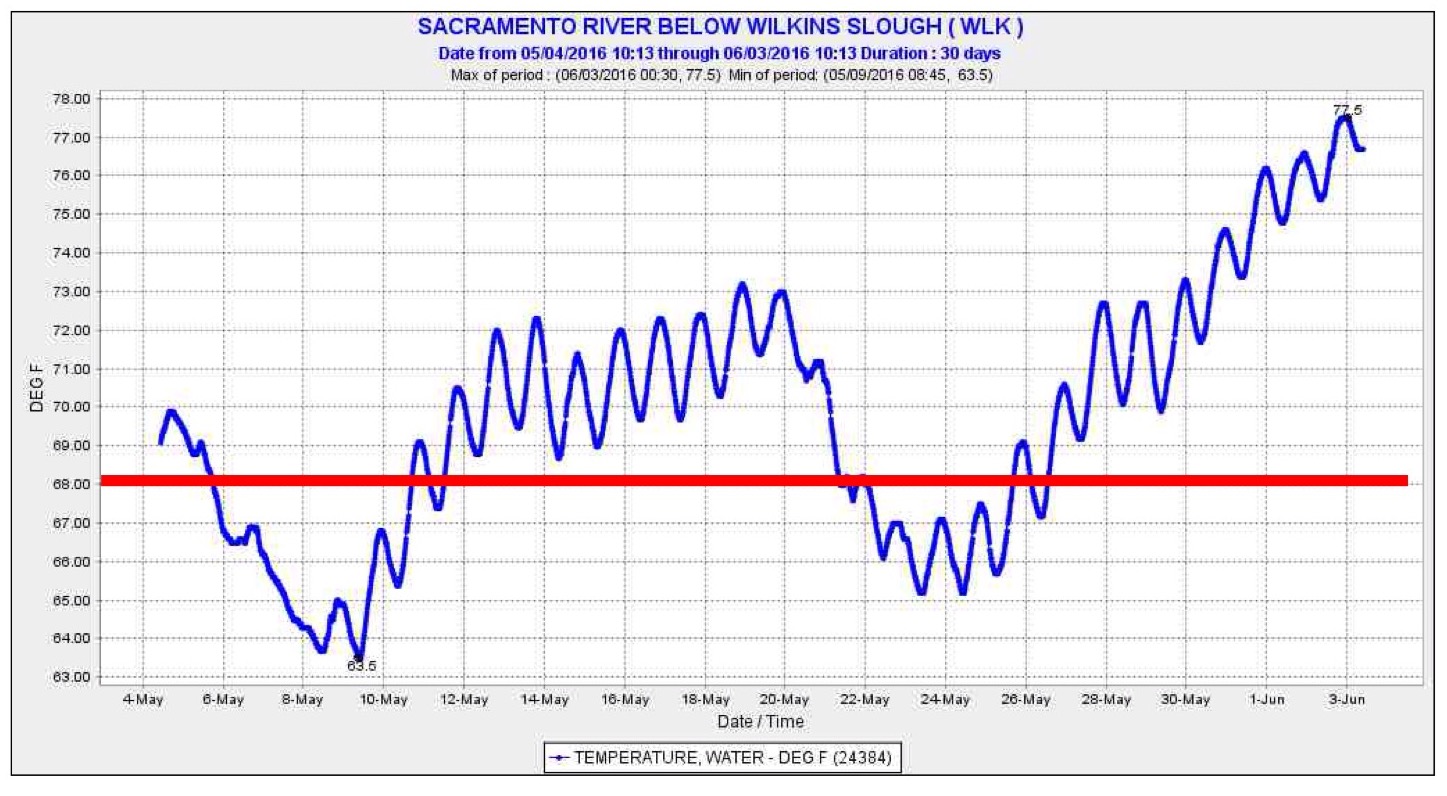
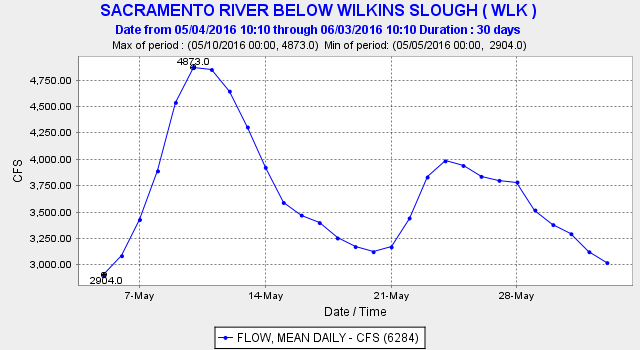
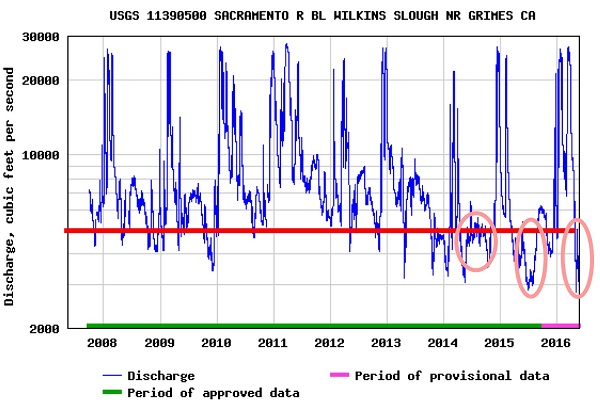
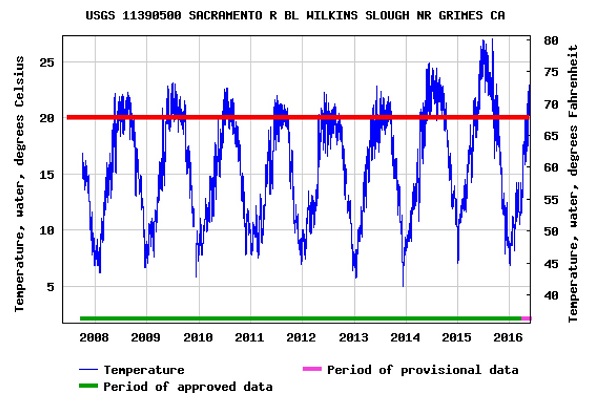
In conclusion, there is no reason why the Bend or at least the Jellys Ferry 56°F compliance point cannot be met. Perhaps more important is NMFS’s prescribed 9000 cfs June Keswick release. The lower release of 7500 cfs so far in June has resulted in (and allowed) the increased water temperature at Bend (and Red Bluff). These low flows and higher temperature (60-62°F at Red Bluff and higher downstream) have, in addition to adding stress on winter-run salmon, also jeopardized green sturgeon, white sturgeon, spring-run salmon, and steelhead (see previous post). Of the present 7500 cfs release, over 5000 cfs is diverted by downstream Sacramento CVP water contractors. An extra 2000 cfs Keswick release would increase mid-river flows at Wilkins Slough from the existing level of 3000-4000 cfs to 5000-6000 cfs, which would lower Water temperature at Wilkins at least several degrees from daily highs of 75-78°F, which are lethal to migrating adult salmon and young sturgeon.
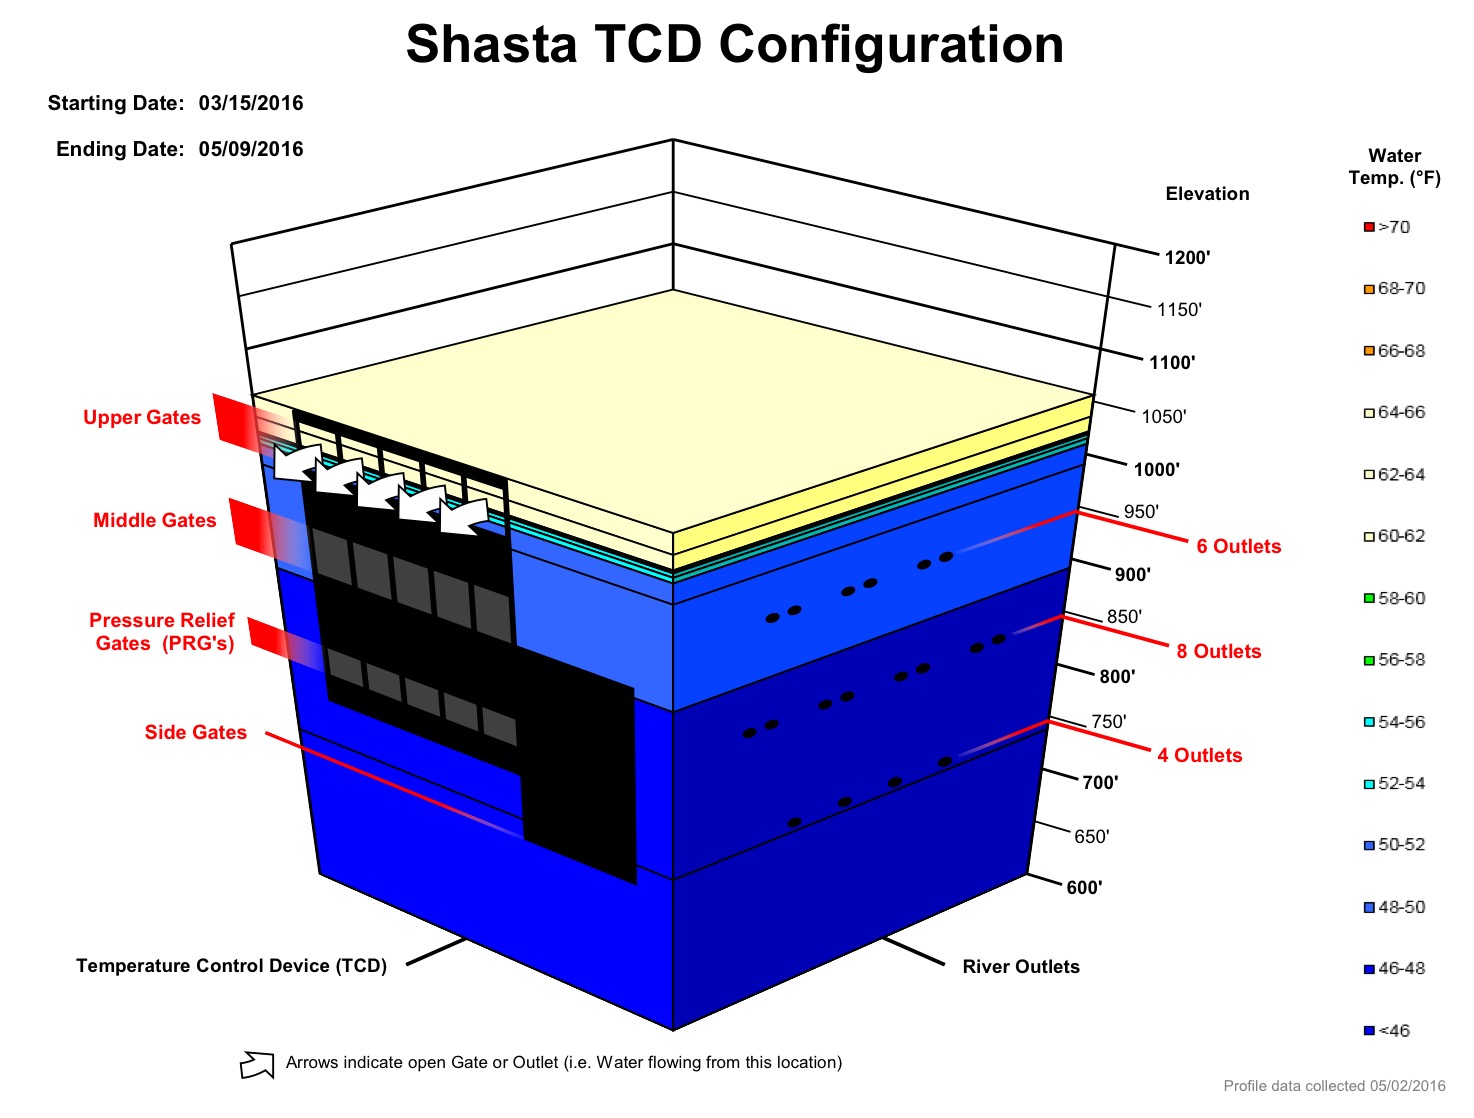
Chart 2. Shasta Dam Temperature Control Device configuration on March 15, 2016.
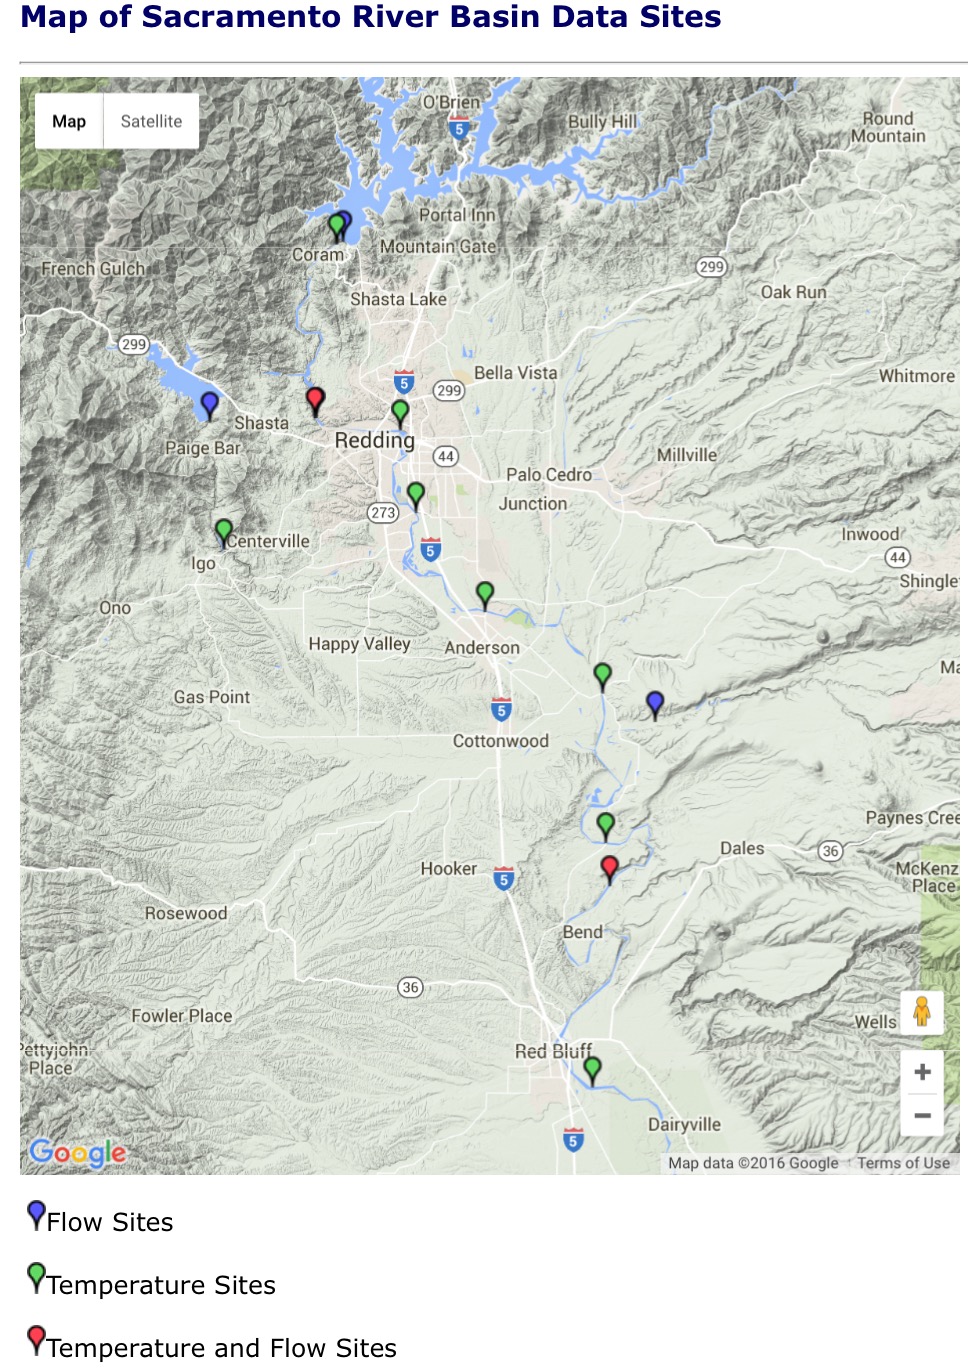
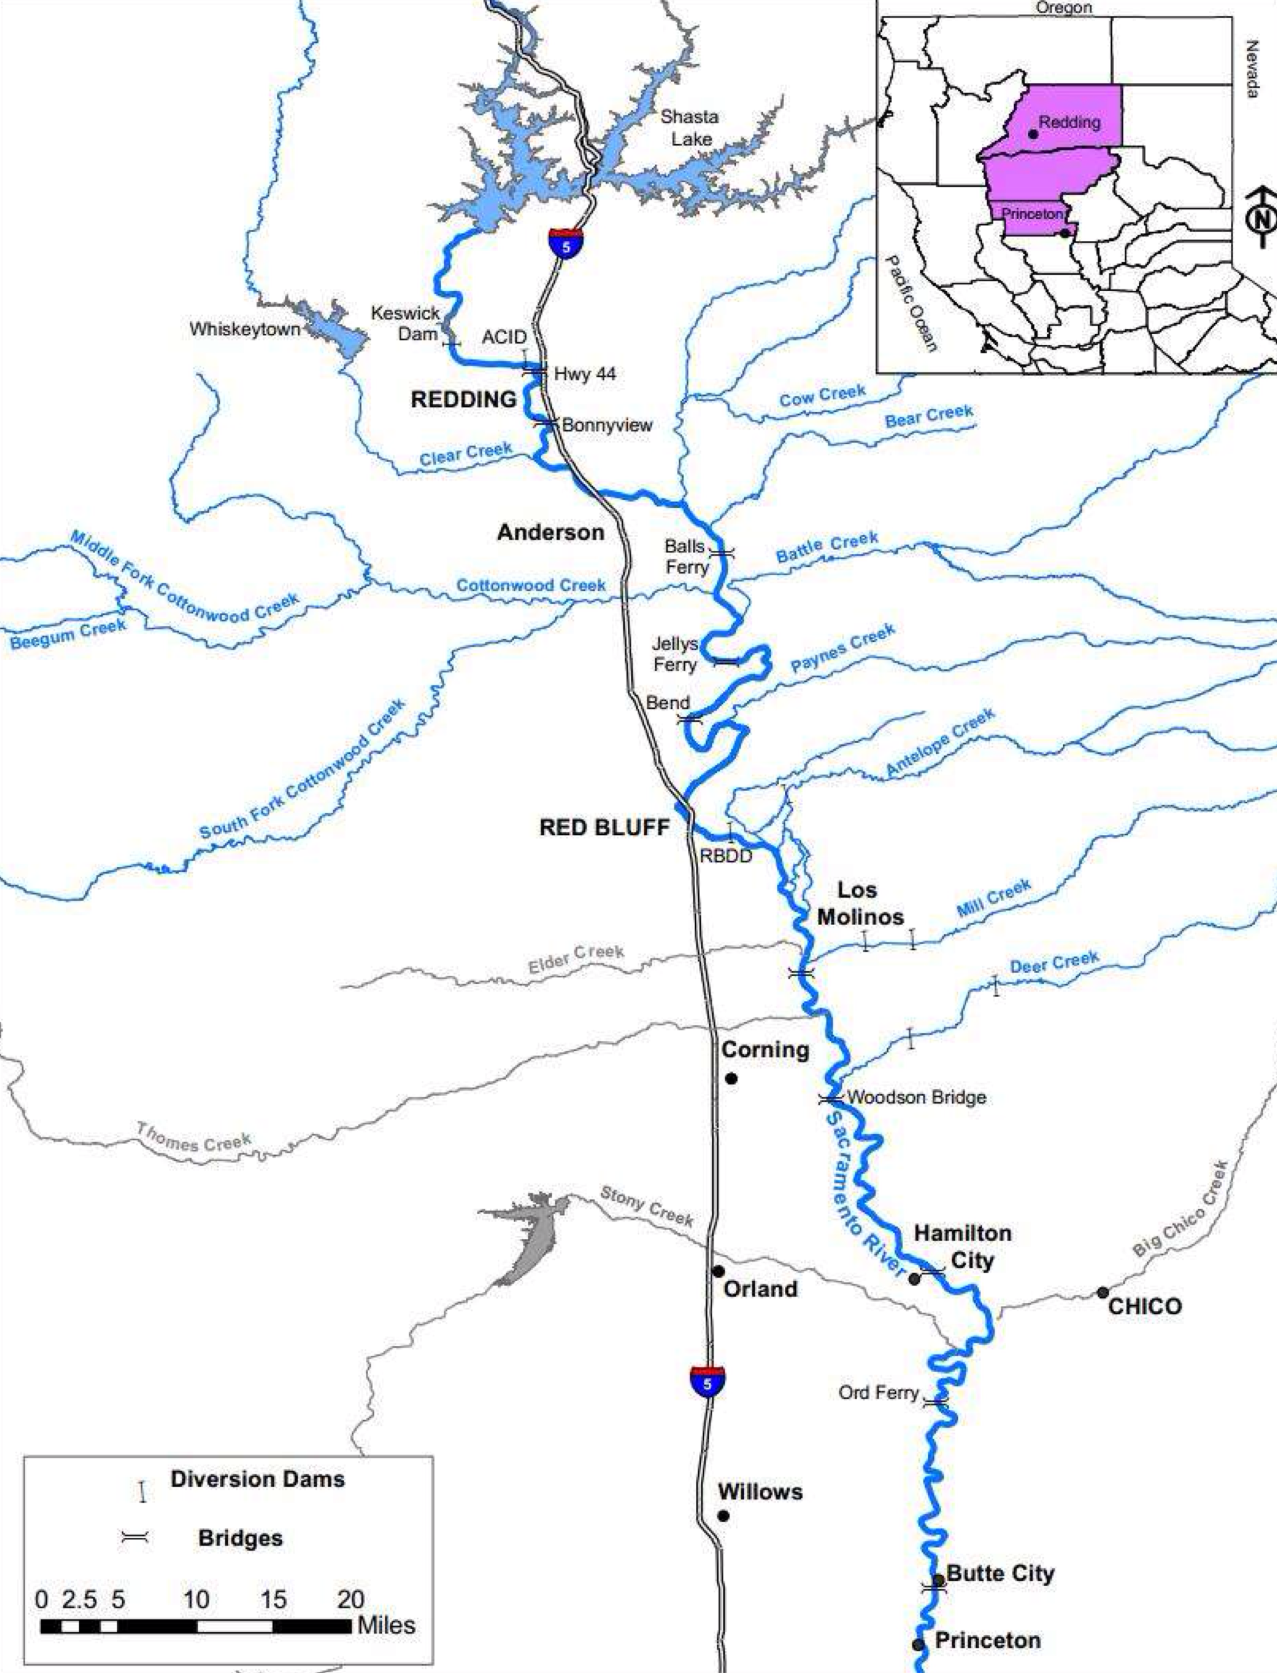
Chart 3. Map of key monitoring stations in upper Sacramento River below Shasta.
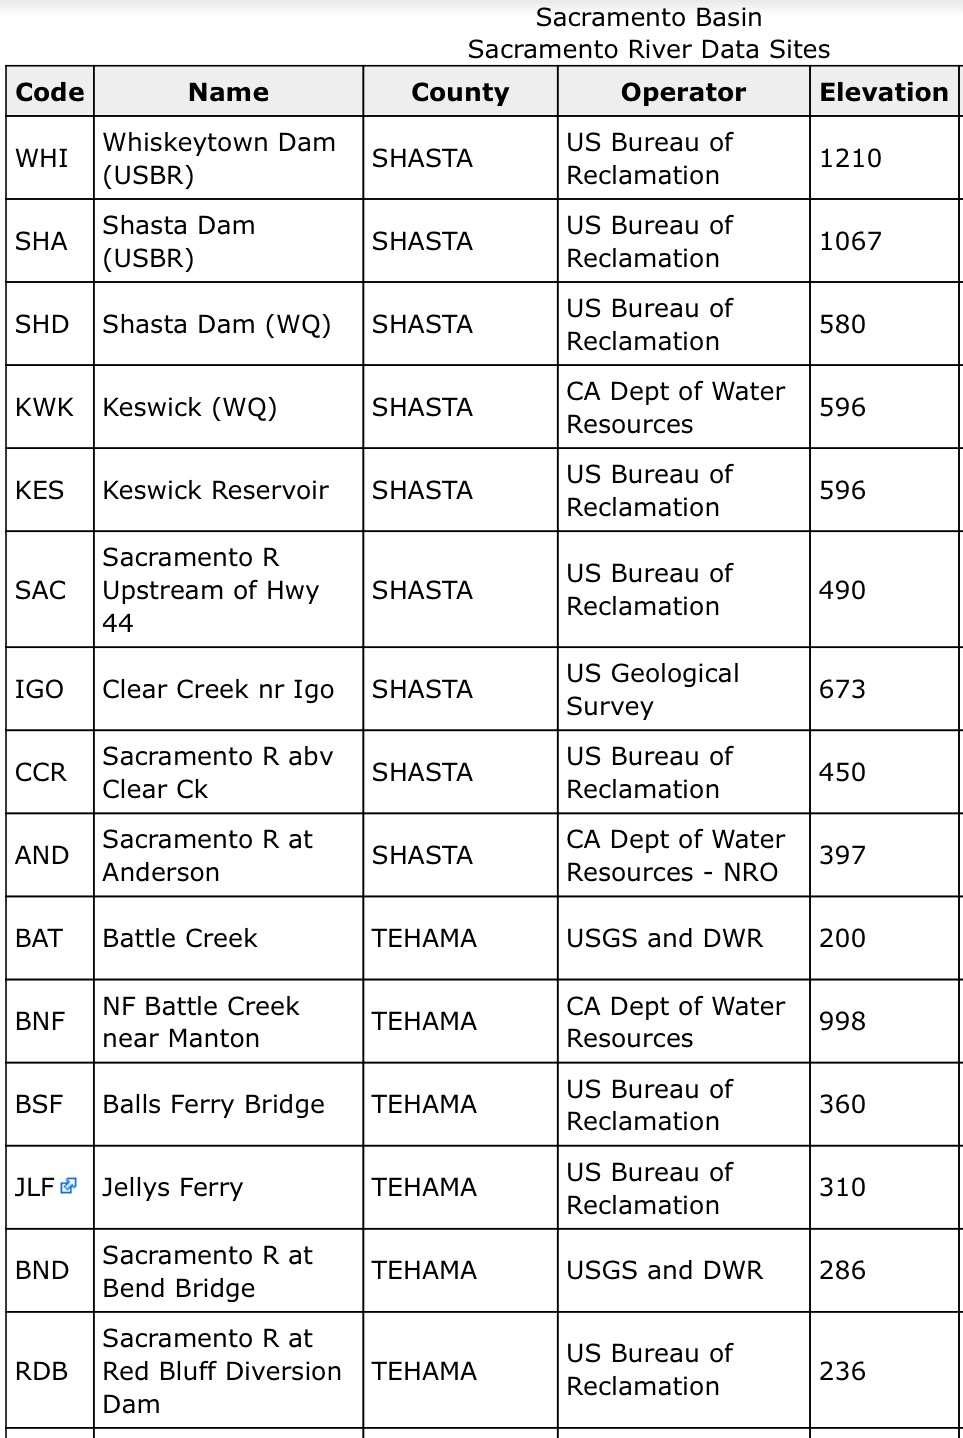
Table 1. List of abbreviations for locations in Chart 1. A map of locations is shown in Chart 3 above.
- All communications cited are available at: http://www.waterboards.ca.gov/waterrights/water_issues/programs/drought/sacramento_river/ ↩