Delta Smelt Population Dynamics

Introduction

The population dynamics of the San Francisco Bay-Delta estuary’s endangered Delta smelt can be viewed using patterns in annual indices of their abundance published by the California Department of Fish and Wildlife (CDFW). Indices of abundance are available from the Fall Midwater Trawl and Summer Townet surveys over the past five decades. Since Delta smelt have a short one to two year lifespan, they readily lend themselves to spawner-recruitment (S/R) analyses that help define the population dynamics of the species.

This report employs S/R analyses to review long-term trends in the population indices of the Delta smelt. The analyses support the hypotheses that abundance (adult numbers) and recruitment into the adult population are primarily controlled by the numbers of adult spawners, adjusted by wet-dry year differences in production of juveniles. In other words, the population abundance from year to year is determined by the number of eggs laid each year and the survival of each egg cohort to adults a year later.

Annual Indices of Delta Smelt Abundance and Recruitment

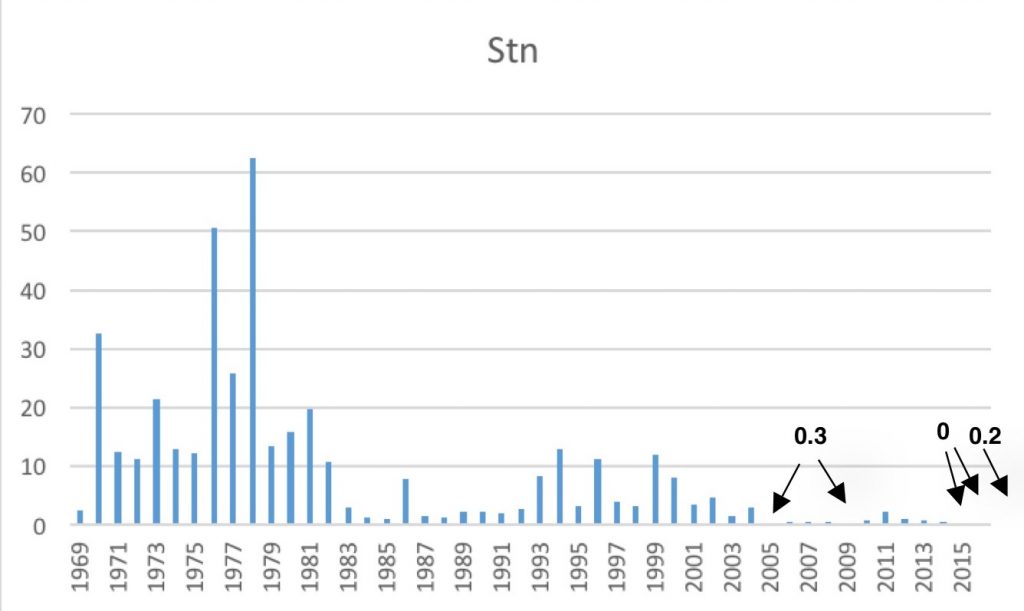
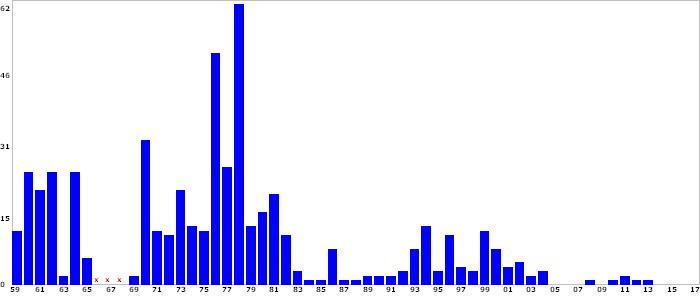
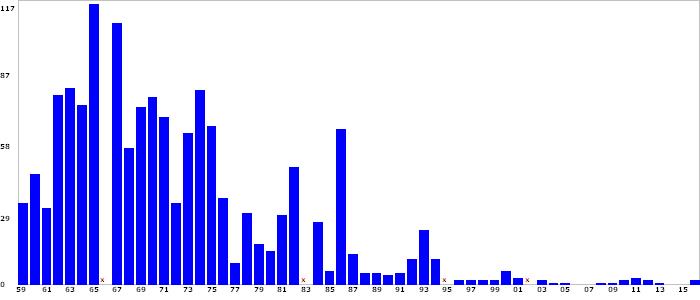
The long-term trends in Delta smelt reflected in the CDFW annual indices of summer and fall survey catch show dramatic declines over the past five decades (Figures 1 and 2). In the Summer Townet (STN) Index (Figure 1), the most obvious population declines are in the early 1980’s and the mid-2000’s. The Fall Midwater Trawl (FMWT) Index (Figure 2) highlights several key periods of population change: 80-83, 88-91, 00-05, and 09-13.

Figure 1. Delta smelt Summer Townet Index (1959-2016). Data source: CDFW

Figure 2. Delta smelt Fall Midwater Trawl Index (1967-2016). Source: CDFW

Spawner-Recruit Analyses

In this report I break down these indices by depicting three relationships: fall adults to the following summer recruits, summer recruits to following fall adults, and fall adults to following fall adults.

The relationship between the fall index of adult spawners to the index of juveniles the following summer is shown in Figure 3. Note the strong positive and highly significant relationship between the numbers of fall adult spawners and the numbers of juveniles that survive to the following summer. This relationship is indicative of the strong role the number of adult spawners (egg production) has on recruitment into the population. Note also the generally lower recruitment-per-spawner in drier years (red years), which is likely the result of a complex of factors related to Delta inflow/outflow and the export of water from the Delta. The population tends to expand (up to 10-fold, one log10 level) with the higher recruitment-per-spawner in wet years and tends to contract with the lower recruitment-per-spawner in dry years. There is also a strong pattern of reduced abundance in the past three decades, starting with a sharp decline in recruits per spawner in the 80’s and 90’s often attributed to the proliferation of exotic clams, the 2001-05 period often referred to as the Pelagic Organism Decline (POD), and the drought periods of 2007-09 and 2012-15.

A closer look at these patterns in Figure 3 indicates possible explanations for the overall 50-year pattern of trending lower numbers of spawners and recruits, and recruits per spawner, over time. In the 70’s, the population expanded initially with the abundant 1970 year-class that featured a high number of recruits-per-spawner, followed by another increase with the strong 1978 year-class. The population was sustained by high recruits per spawner through the wet and dry years of the 70’s. In the 80’s and 90’s, recruits per spawner dropped sharply in drier years, while remaining relatively high in wetter years. A sharp drop in the spawning population occurred after the 1980 fall peak (red 81). In the 80’s and 90’s, the population had matching upward (Group B) and downward (Group A) movements that maintained the population into the early 2000’s (00, 01, and 02). Despite low recruits per spawner in the 87-92 drought, the population rebounded in the wet years from 93 to 99. The population then took a sharp drop from the high fall level in 99 to the much lower level in 04 and the very low recruit-per-spawner year 05. Again, that latter period corresponds to the POD and a drier 00-05 period with four normal and two dry years. There was a sharp uptick in recruitment per spawner in wetter 10-11 (Group C) following the dry years of 07-09, but the population collapsed again with very poor recruitment per spawner in 2012.

The lower recruits-per spawner in drier years can be explained by low Delta outflows and high exports in winter and spring of drier years. This is best exemplified by comparing Groups A and B in Figure 3. The low recruits per spawner in 05, followed by the drought of 07-09, defined the late 2000’s (Group D). A short recovery period in 10-11 (Group C) was crushed by the poor recruits per spawner in the drought period of 12-16. The poor number of recruits in 15-16 (Group E) is simply a lack of spawners (low eggs) and continuing drought conditions.

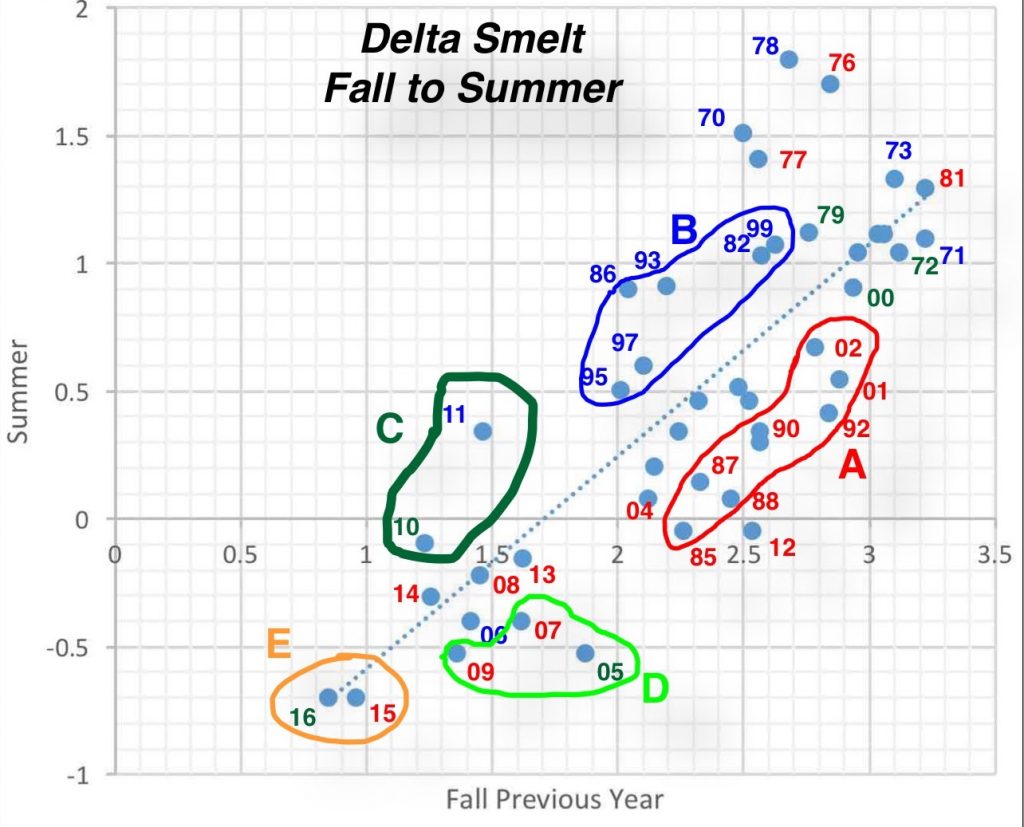
Figure 3. Groupings A to E in Log vs Log plot (Figure 3) of Summer Index of Delta smelt as related to the previous Fall Index of abundance, by year of summer index. Blue years are wet water years (Oct-Sept). Green years are normal water years. Red years are dry and critical water years. Year types are as determined by the California Department of Water Resources for the Sacramento Eight-River Index.

The relationship between summer juvenile production as reflected in the STN index for the year and survival as reflected in the following fall adult FMWT index is shown in Figure 4. The comparison represents the relative survival between summer and fall, most likely reflecting July-September conditions in the Bay-Delta. The strong positive relationship indicates that the number of juvenile smelt in summer determines in large part the population in the fall, adjusted by summer-fall environmental conditions that can significantly affect survival to the fall. Again, Delta inflow/outflow and exports are likely factors in defining the survival relationship, over and beyond the beginning summer numbers of smelt. As in the previous fall to summer relationship described earlier, summer to fall survival is generally higher in wetter years, with notable exceptions. These exceptions are due mainly to the fact that conditions in the Bay-Delta in many summers, regardless of water-year type, are drought-like: there is often little difference between wet and dry year summer-fall conditions. Note the pattern of falling indices over the five decades of the surveys.

A closer look at the pattern in Figure 5 indicates possible explanations for the overall 50 year pattern of trending lower numbers of fall survivors from summer juveniles, and fall production per summer juvenile production level index over time. In the 70’s, the population was high and remained so through 1982. Reduced summer to fall production from 1976-81 led to a lower 1982 population. The subsequent declines from 1982 to 1985 have been attributed to the 80s clam invasion, although there was no apparent decline in summer to fall survival. Poor summer to fall survival in 2004 led to a sharp downward population shift. Group A is indicative of poor over-summer survival in high-export dry years. Group B represents very wet years when part of the population is distributed below the survey area. Group C represents moderately wet years under low to moderate Delta exports. Group D includes wet years and three dry years with low summer exports. Near zero 2015-16 summer indices led to near zero fall indices, a pattern indicative of recruitment failure, where summer production is so low that only low numbers remain in the fall.

Figure 4. Log vs Log plot of fall FMWT Index of Delta smelt as related to the prior summer STN Index of abundance for that year. Blue years are wet water years (Oct-Sept). Green years are normal water years. Red years are dry and critical water years. Year types are as determined by the California Department of Water Resources for the Sacramento River runoff to the Bay-Delta Estuary (http://cdec.water.ca.gov/cgi-progs/iodir/WSIHIST ).

The plot of LogFall to following LogFall indices (Figure 5) indicates strong recruitment in wet years and poor recruitment in dry years. While the prior year or starting abundance remains the dominant factor as in the above relationships, generally higher recruits-per-spawner occur in wet years and lower recruits-per-spawner occur in drier years. The poor recruitment years (81, 05, and 12) led to sharply negative population shifts. Multi-year droughts 07-09 and 12-15 also led to declining year-to-year population levels. Good recruitment years (e.g., 70, 93, 95, and 11) led to strong positive population recruitment.

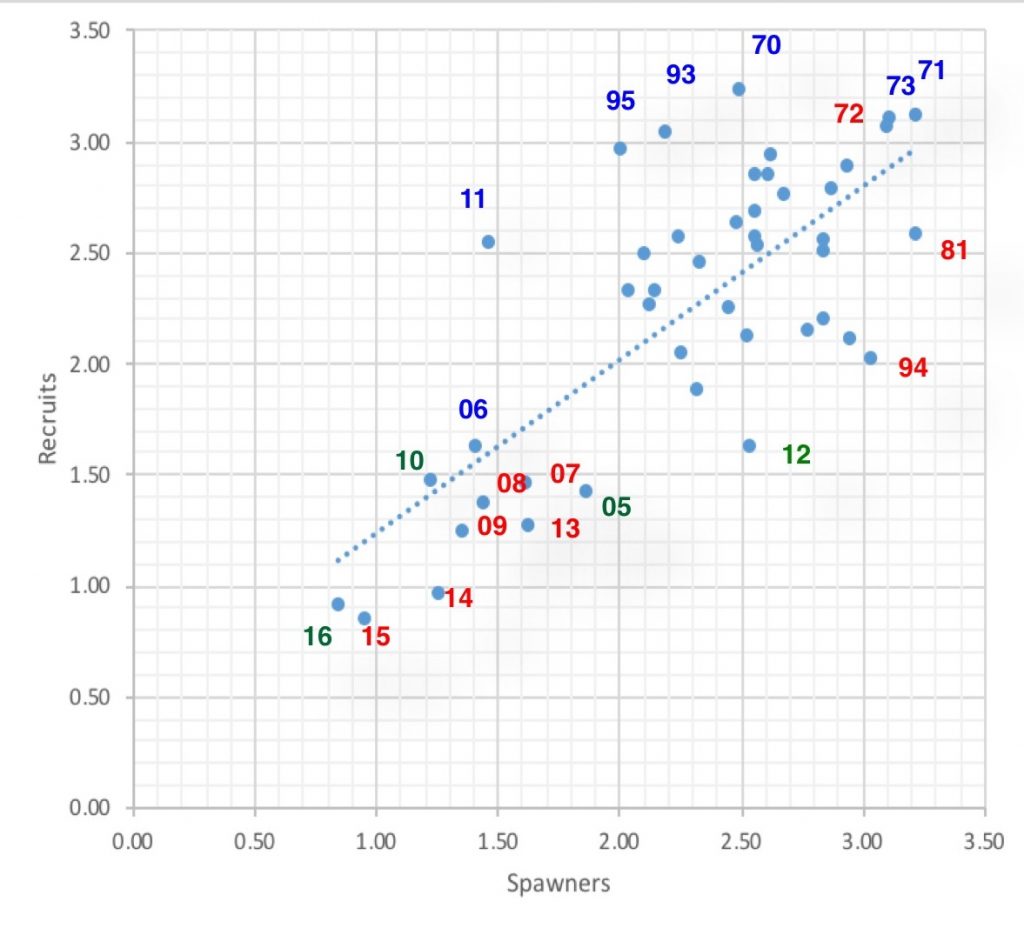
Figure 5. Log vs Log plot of fall FMWT Index of Delta smelt (recruits) vs previous fall index (spawners). Blue years are wet water years. Green years are normal water years. Red years are dry and critical water years. Year types are as determined by the California Department of Water Resources for the Sacramento River runoff to the Bay-Delta Estuary (http://cdec.water.ca.gov/cgi-progs/iodir/WSIHIST ).

Summary

The population dynamics of Delta smelt are characterized by a strong positive spawner-recruit relationship, modified by wet-dry year conditions. Dry year sequences drive population abundance down, hindering future abundance levels. Wet years generally lead to higher recruitment per spawner. The number of spawners remaining in 2017 may be too low to sustain the population and bring about recovery without extraordinary positive measures such as improved flow conditions, reduced exports, and/or stocking of hatchery-reared Delta smelt.

State Puts Fall X2 Back Where It Belongs

The State of California, after initially complying with the Bureau of Reclamation’s request to remove the Fall X2 protections for Delta smelt,1 has had second thoughts. Instead, the Department of Water Resources has cut exports at Clifton Court to keep X2 (roughly 3800 EC) at km74 (near Mallard Island).

  1. “Fall Smelt Protections Removed,” October 1, 2017, http://calsport.org/fisheriesblog/?p=1811

Salmon and Smelt Shorted in 2017

The Northern California Water Association stated on September 14: “For the better part of three decades, greater and greater quantities of water were dedicated to instream flows with the expectation that this “silver bullet” of flows, on its own, would solve the diverse assortment of fish mortality causes. The result, on the rivers and streams where this was the primary or only action used to promote survivability, was generally unproductive.” This statement is so misleading and untrue. It is outright propaganda. Streamflow is absolutely necessary to maintain salmon, steelhead, sturgeon, and smelt throughout the Central Valley, and reductions in streamflow have been directly related to fish mortality and population abundance.

The truth is that each year the state and federal water projects in the Central Valley keep squeezing more and more water from the system. There is no better example than in 2017, a near record water and snowpack year. Even in this very wet water year, water managers are saving water for use in future years rather than applying it as required for the fish. Their excuse is that they must save the water to preserve the cold-water pool in Shasta reservoir for the summer and fall salmon spawn. While that is a true need in drier years, it is not in wet years when Lake Shasta fills.

Water users got full allocations this year. Delta exports reached a near record 6.2 million acre-feet (MAF) of water in Water Year 2017. So instead of keeping river flows up to meet salmon needs with water that users did not need, project managers saved the water for next year’s use. While saving Shasta storage for next year is not a bad thing, saving this year’s fish water for next year’s contractor allocations is certainly not good for fish species near extinction.

How is the fish water saved? The basic approach is to limit Shasta releases and violate fish water temperature standards in the 200-miles of the Sacramento River down to the Delta. The standards require maintaining spring-to-fall water temperature at Red Bluff at 56oF and at 68oF between Red Bluff and the Delta. It takes releases of cold water from Shasta to maintain the Red Bluff standard. In the lower river, it is the flow rate that maintains the standard. With Sacramento River contractors receiving their full allocations and the Delta diverters getting all the water they needed in 2017, there was an overt effort to save the water in Lake Shasta at the expense of the salmon.

The water managers and resource agencies started by moving the Red Bluff 56oF standard compliance point upstream 33 miles to Balls Ferry, leaving over half the upper 60-mile salmon spawning reach without protection. That action is for dry years, not wet years. The combination of lower and warmer Shasta/Keswick releases resulted in excessively high water temperatures near Red Bluff (Figure 1). Lower Shasta releases and lower flows below Red Bluff led to low flows and high water temperatures 120 miles downstream at Wilkins Slough during the summer (Figure 2). By ignoring the water temperature standards, water managersheld approximately 300 thousand acre-feet (TAF) of extra water in storage at Lake Shasta (the amount in yellow area of Figure 2). The standards were also exceeded 40 miles further downstream at Verona (Figure 3); again, the amount that would have been necessary to maintain the standard was about 300 TAF. The effect translated to higher water temperatures 30 miles further downstream in the Delta at Freeport (Figure 4).

Was the 300 TAF of storage saving necessary to preserve Shasta’s cold-water pool to protect salmon in the upper river spawning area over the summer and into the fall? No, and certainly not at the expense of salmon, steelhead, sturgeon, and smelt over the summer in the river, Delta, and Bay. First, there was sufficient cold water to maintain the standards through the summer, regardless what the agencies say or their models predicted. There was 400 TAF more water in the Shasta cold-water pool than in 2016 (Figures 5 and 6). Standards had been maintained in the two previous wet years, 2006 and 2011. Had water managers released the water for fish in 2017, the end-of-September storage would have been 3.1 MAF instead of the projected 3.4 MAF. The 3.1 MAF is adequate and within project goals. It is twice the end-of-September storage of 2015, and 10% higher than 2016. Second, if the 300-TAF was too high a price, some or all of it could have been allocated from the over 8 MAF of water diverted from the Sacramento River and the Delta for water use. Third, if a shortage of the cold-water was a concern, less warm water from the Trinity-Whiskeytown trans-basin diversion could have been delivered to the Sacramento River, or less peaking hydropower generation at Shasta Dam could have occurred: both are known factors in cold-water pool depletion.

In summary, water project managers in the Central Valley saved 300 TAF by not meeting water temperature standards for the Sacramento River in summer 2017. In the whole scheme of 2017 water management it seems “small potatoes” (Figure 7), but maintaining the long-held standard is important for salmon. There was no valid excuse for not meeting the water temperature standards. Salmon, steelhead, sturgeon, and smelt suffered unnecessarily from the violation of the water temperature standards.

Figure 1. Summer 2017 water temperature in the Sacramento River at Red Bluff (RM 243). Red line denotes 56oF water temperature standard necessary to protect spawning salmon, steelhead, and sturgeon. (Base chart source: CDEC)

Figure 2. Summer 2017 water temperature at Wilkins Slough (Sacramento River at RM 125). Multiple temperature lines indicate daily highs and lows. Red line is the 20oC (68oF) standard. Yellow area is the roughly 300 TAF that was saved by not meeting the standard (maintaining about 7000 cfs). (Base chart source: USGS)

Figure 3. Summer 2017 water temperature at Verona (Sacramento River at RM 80). Multiple temperature lines indicate daily highs and lows. Red line is the 20oC (68oF) standard. Yellow area is the roughly 300 TAF that was saved by not meeting the standard (maintaining about 17,000 cfs). (Base chart source: USGS)

Figure 4. Summer 2017 water temperature at Freeport (Sacramento River channel in north Delta). Multiple temperature lines indicate daily highs and lows. Green line is the flow that would have occurred to maintain upriver water temperature standards. Yellow area is the roughly 300 TAF that was saved by not meeting the standard. Had this water reached the Delta and Bay it would have benefitted Delta smelt by keeping the Delta cooler and maintaining the low salinity zone further downstream in the Bay. (Base chart source: USGS)

Figure 5. Water storage and temperature distribution profile in Lake Shasta in 2016. (Source: USBR CVO)

Figure 6. Water storage and temperature distribution profile in Lake Shasta in 2017. (Source: USBR CVO)

Figure 7. Water Year 2017 flows in the Sacramento River at Wilkins Slough. Near 300 TAF of Shasta storage was saved by reducing flows below the norm in summer (red circle). Base chart source: USGS.

Fall Smelt Protections Removed

On September 28, the US Fish and Wildlife Service (Service) approved removal of fall protections for Delta smelt that have been in place since 2008. The action allows south Delta pumping plants to export an additional 400,000 acre-feet of water on top of the 6.2 million acre-feet already exported through September in Water Year 2017. The water, earmarked for the Bay and Delta smelt, instead will go to southern California to fill reservoirs.

The action allows X2, the 2 parts per thousand salinity prescription, to be moved from Chipps Island (river kilometer 74) upstream to Collinsville (river kilometer 81). The action occurs simply by increasing south Delta exports, keeping all other factors constant (Figures 1 and 2). Exports have risen from 8,000 cfs to the maximum of 11,700 cfs. Delta net freshwater outflow to the Bay has fallen from 15,000 cfs to 10,000 with the higher exports and slowly falling Delta inflow (Figure 3). Salinity at Collinsville has nearly reached its new allowed level (Figure 4).

The effects of the higher exports can be seen in flows measured in Old River in the central Delta near Highway 4 (Figure 5). Flows through nearly the entire tidal cycle are negative as water rushes to meet the maxed-out exports in the south Delta. The daily average, also called OMR, is -5,000 cfs. Other channels, including the lower San Joaquin River, make up the remainder of the 11,700 cfs level of export.

The Service concludes that “the proposed Fall X2 action for 2017 would not adversely affect Delta Smelt” P5. They state that they see no evidence that the change will affect the smelt population. This is an incredible conclusion given the present state of the population (Figure 6). There is simply no basis for the conclusion other than saying the smelt are all gone anyway.

Reductions in Delta outflow, upstream movement of X2 into the western Delta, and negative net flows in any Delta channel are a direct and real threat to Delta smelt and their habitat (as the Service points out in its approval letter on page 8). In Reclamation’s request for the action, Reclamation frames the issue an adaptive management action within the context of the original 2008 biological opinion prescription. With the species on the brink of extinction, such negative “adaptive management” actions are not the logical approach to be taken toward recovery of the species. The prescription allowed adaptive management actions to help toward recovery, not to top off southern California reservoirs.

Sad thing is, 2017 is only the second year with hydrological conditions applicable to the 2008 fall X2 prescription. In 2011, the first and now only application of the prescription, the fall X2 requirement proved to contribute significantly toward recovery, as shown in the Fall Midwater Trawl Survey. I suspect there will be no similar “bounce” in the October-through-December survey index in 2017.

Figure 1. Tracy (federal) exports in September 2017.

Figure 2. Clifton Court (state) exports in September 2017.

Figure 3. Delta outflow to Bay in summer 2017.

Figure 4. Salinity (EC) at Collinsville (river kilometer 81) in September 2017.

Figure 5. Hourly flow in cfs in Old River in central Delta near Highway 4 crossing.

Figure 6. Delta smelt summer townet index 1969-2017. (CDFW data).

Figure 7. Fall midwater trawl index for Delta smelt

WaterFix will devastate more than just Salmon

Dave Vogel and I are contributing a series of posts on the potential effects of the WaterFix Twin Tunnels Project on Delta fishes. Our focus to date has been on salmon. In this post, I focus on the “other” fishes of the Bay-Delta that will be harmed by WaterFix.

Striped Bass (non-native gamefish)

Striped bass will be devastated by WaterFix tunnel intakes located on the lower Sacramento River. The main spawning run of striped bass is in spring in the lower Sacramento River from near Colusa down to the tidal Delta. Eggs and larvae are buoyant and are carried by currents to the tidal Delta and Bay. Nearly all the eggs and larvae must pass the tunnel intakes. The original Peripheral Canal (circa 1980) had a provision to limit diversions during the striped bass spring spawn. The Vernalis Adaptive Management Program (VAMP) from the late 1990s to the late 2000s protected striped bass in spring with higher Delta inflows and reduced exports (generally a limit of 1500 cfs from mid-April to mid-May). The D-1485 Delta standards had a limit on exports through June (6000 cfs). The proposed WaterFix would have spring exports up to 15,000 cfs (9000 from tunnels and 6000 from existing South Delta pumps). Those eggs and larvae that pass the tunnel intakes would be subject to the pull of south Delta exports without the benefit of the extra flow taken at the tunnel intakes.

Longfin Smelt (native)

Longfin smelt will suffer from reduced flows in the winters of drier years. The WaterFix will take a quarter to a third of sporadic uncontrolled winter flow pulses that support the spawn of longfin smelt in drier years. The lower flows will force longfin to spawn further upstream in the Delta where they are vulnerable to central and south Delta exports. The longfin population declines in drier year sequences; the WaterFix will add to downward population pressure.

Delta Smelt (native)

A recent post by Moyle and Hobbs at UC Davis suggests Delta smelt will be better off under WaterFix:

“The status quo is not sustainable; managing the Delta to optimize freshwater exports for agricultural and urban use while minimizing entrainment of delta smelt in diversions has not been an effective policy for either water users or fish.” Comment: So allowing the water projects to take more water will help? Delta inflow and outflow are the key factors in Delta smelt population dynamics – both will be negatively affected by WaterFix.

Moyle and Hobbes point out “reasons to be optimistic about Waterfix,” as follows:

  • “Entrainment of smelt into the export pumps in the south Delta should be reduced because intakes for the tunnels would be upstream (of) current habitat for delta smelt and would be screened if smelt should occur there.” Comment: The existing south Delta intakes will continue to take spring-summer water (and smelt) from the Delta in similar amounts as in the past. However, smelt in the south Delta will not have the benefit of the inflow taken by the proposed tunnels. Smelt will also be more likely to spawn near or upstream of the tunnel intakes. Screens on the tunnel intakes would not help save larval smelt and would be minimally effective for adult smelt.

  • “Flows should be managed to reduce the North-South cross-Delta movement of water to create a more East-West estuarine-like gradient of habitat, especially in the north Delta.” Comment: If outflow remains low or becomes even lower, the low salinity zone will more frequently move further into the Delta. The north Delta already has a strong gradient – allowing the gradient to move further upstream into the Delta will have adverse effects. Circulation in the south Delta will remain poor, and the south Delta will continue to experience reverse flows, because south Delta exports will continue. The south Delta will lose the benefit of inflow taken by the tunnels.

  • “Large investments should be made in habitat restoration projects (EcoRestore) to benefit native fishes, including delta smelt.” Comment: Delta smelt are totally dependent on pelagic (open-water) habitats, but few EcoRestore projects will improve such habitats. Salinity, water temperature, turbidity, tidal-flow dynamics, water quality, and nutrients are by far the most important factors controlling smelt population dynamics.

Steelhead (native)

Steelhead, much like salmon, are affected by ancillary changes in reservoir storage and releases, river flows, Delta inflow and outflow, water temperatures, and turbidities. But the greatest threat to steelhead, as for salmon, is from the three large intakes and their screen systems, which will adversely affect young steelhead passing on their way to the ocean.

Splittail (native)

Splittail were once on the endangered species list. Today, splittail numbers, especially for recruitment of juveniles, are way down, well below the numbers occurring at the time of their listing. Splittail from the Bay-Delta migrate upstream into river floodplains upstream of the Delta to spawn in spring. The three largest floodplain areas are in the Yolo Bypass, Sutter Bypass, and the lower San Joaquin River wildlife areas. The Sutter group will be at high risk to fry-stage entrainment/impingement at the tunnel intakes. The San Joaquin group will have a continued risk to south Delta exports, a risk made worse by the diversion of inflow from the Sacramento River into the tunnels.

American shad (non-native gamefish)

American shad migrate from the ocean to Valley rivers to spawn in the spring. Eggs, larvae, and fry from the major spawning rivers of the Sacramento Valley must pass the tunnel intakes in the north Delta. Like the striped bass, these lifestages of American shad will be devastated by entrainment and impingement at the tunnel intakes.

Pacific Lamprey

Like salmon and steelhead, Pacific lamprey migrate from the ocean to spawn in Valley rivers during the spring. Young larval lamprey would pass the tunnel intakes on their migration back to the ocean. Because they are weak swimmers they would be highly vulnerable to impingement or predation at the screens.

Native Minnows and Suckers

Many species of native minnows and suckers migrate upstream from the Delta to Valley rivers to spawn in spring and summer. Their young must pass the tunnel intakes on their return to the Delta, and thus will be at risk to entrainment/impingement at the tunnel screens.

The Delta smelt Summer Townet Index is at record low numbers in recent years including the wet year 2017 index.

The striped bass Summer Townet Index remains near record low in 2017.