Summer water transfers are predominantly made with water released from Shasta and Oroville reservoirs. Instead of being used by Sacramento Valley CVP and SWP contractors, water is sold to South of Delta contractors who take the water via the South Delta CVP and SWP export pumps. Non-project water transfers are also facilitated by CDWR. Transfers usually occur in drought years when allocations to South of Delta contractors are low and excess export capacity exists at the South Delta pumping plants. Purchasers must also pay for an additional 15-25% of “carriage” water to limit salinity intrusion into the Delta that would occur with export of transfer water.
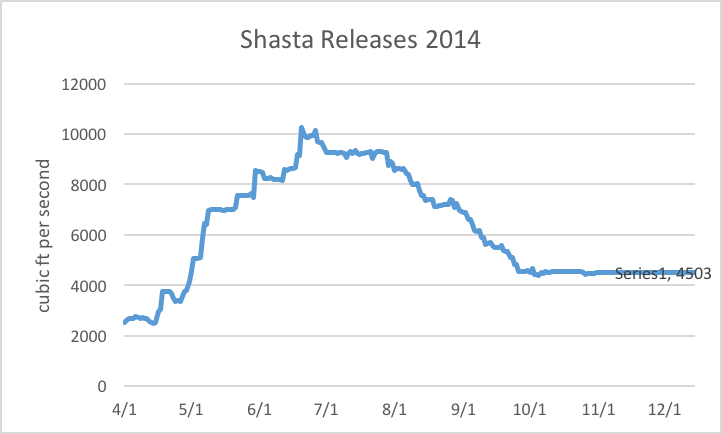
Under existing “rules”, up to 600,000 AF of water may be transferred through the Delta during the allowed summer transfer “window”. In 2014, 110,000 AF of CVP water from Shasta Reservoir was transferred from July through November (Reclamation was granted a temporary change to transfer water in the Oct-Nov period in 2014). In 2014, approximately 300,000 AF of transfers were conducted by CDWR during the summer. In 2015 CVP transfers of Shasta water are expected to be 240,000 AF, while SWP transfers are expected to be less than they were in 2014.
So what are the problems with water transfers from an ecological perspective1?
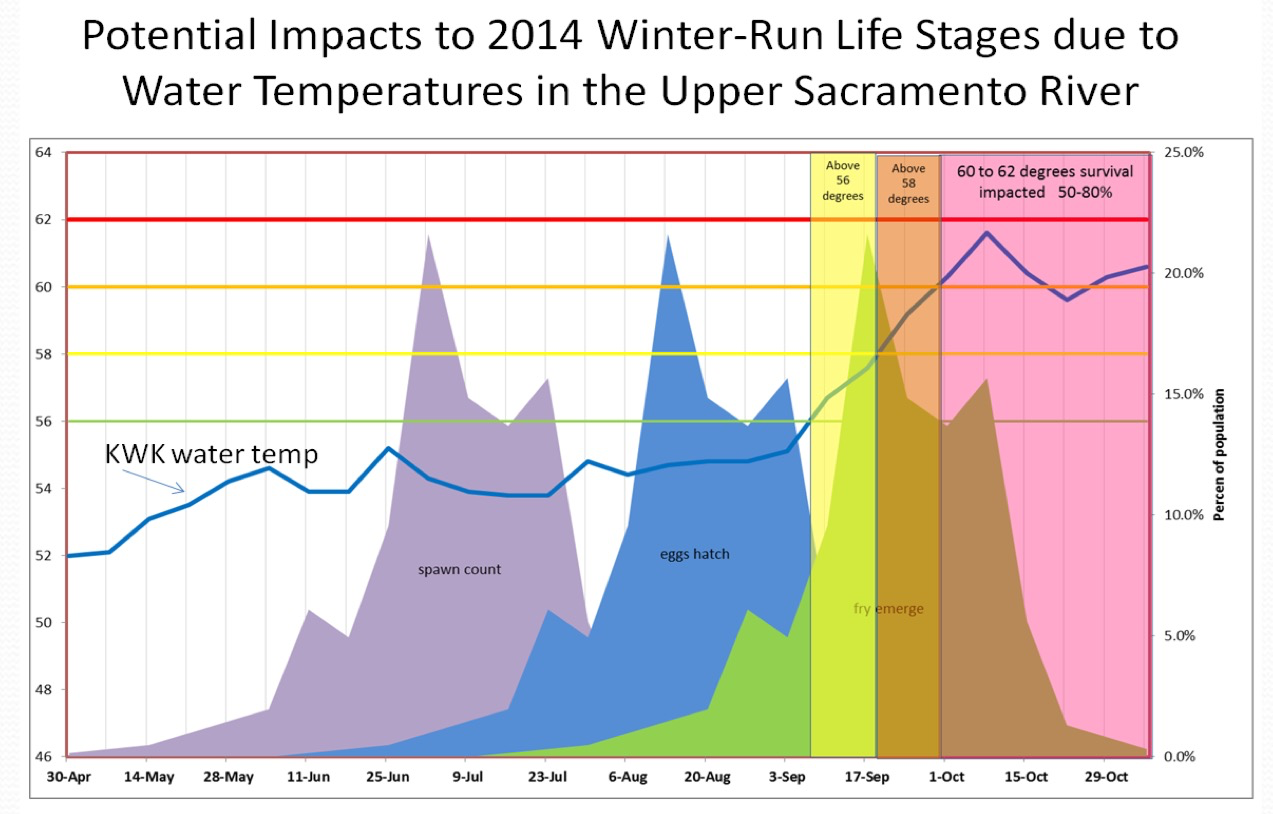
- Transfer water is released from reservoirs in summer where during drought years there may be a limited cold-water pool to sustain downstream fish populations through the summer and fall. In 2014, the brood year for Winter Run Chinook Salmon was lost when the Shasta cold-water pool was exhausted at the end of August (Figure 1). Some would argue that the water would have been released in any case to downstream ag contractors. However, there are other options that would keep the water in the reservoir (e.g., fallowing programs, water purchase, deferring transfers).
- The water is released from multi-year storage, thus limiting the amount of carry-over storage in the coming years that is needed to sustain fish and their habitat, as well as water supplies for public health and safety.
- Transfer water exported from the Delta is not the same water released from the reservoirs. Water exported is a combination of Sacramento River inflow, San Joaquin River inflow, and Delta low-salinity (brackish) water from the North, Central, and West Delta. Sacramento River inflow includes flows from the Feather, Yuba, and American rivers, as well as many smaller rivers.
- The already inadequate protections that apply to “normal” export water don’t apply to transfer water. Transfers increase the flow towards the Delta pumps, pulling fish with them. But the ratio of inflow to outflow that generally limits exports doesn’t count transfer water; there are no restrictions in moving transfer water through the Delta other than carriage water requirements. Transfer water can make up 25% or more of Delta inflow.
- Transfer water exported thus takes water with fish from many Central Valley habitats. Most prominently is the taking of Delta Smelt from the brackish and freshwater zones of the North, Central, and West Delta. Transfer water essentially must pass through the Delta’s designated critical habitats to get to the South Delta export facilities (Figure 2).
- When water quality standards for inflow, outflow, and salinity are relaxed, the process is further aggravated. Adding transfers during drought conditions with barriers, DCC open, low exports, low inflows, and low outflows worsens the effects of transfers by bringing in added warm, fresh, low turbidity water to the Low Salinity Zone from the north, while exporting turbid, brackish, higher turbidity, more biologically productive water from the south (Figure 2).
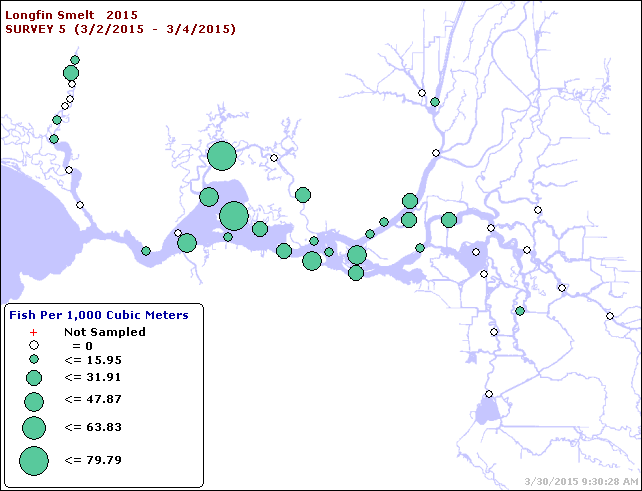
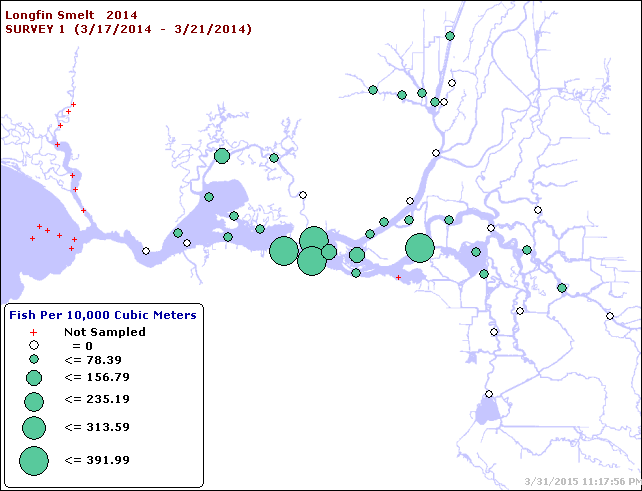
- Delta Smelt are highly vulnerable in the summer of drought years because the entire population is within the Delta (figure 3), where water temperatures are near or above lethal levels.
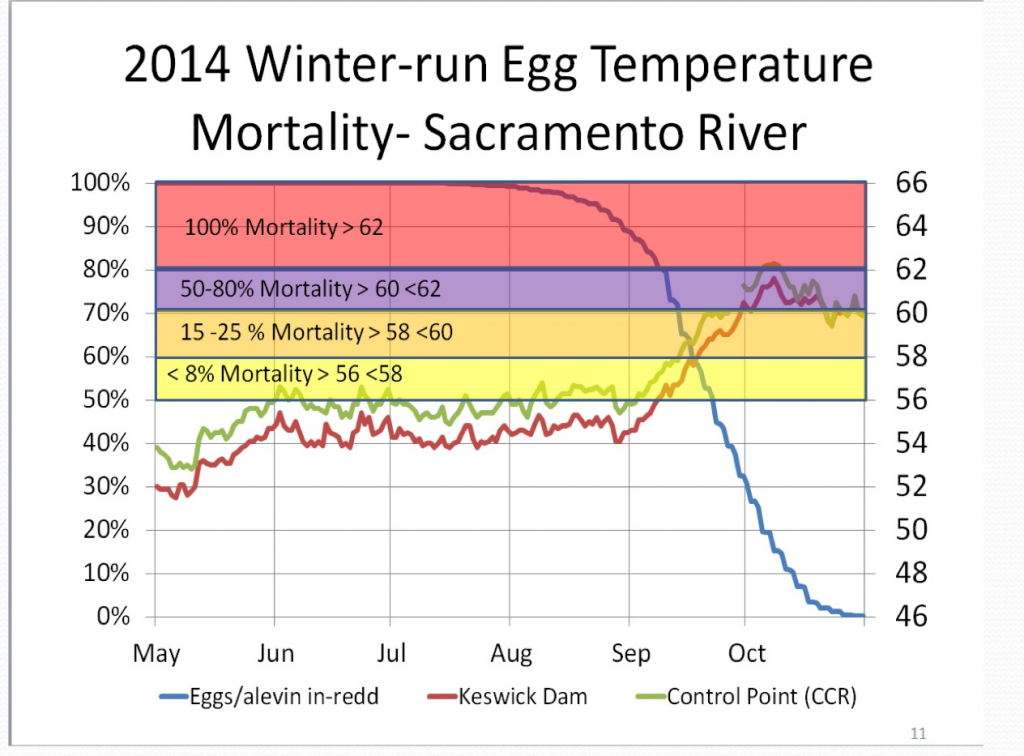
Figure 1. Water temperature of Keswick Dam releases in summer 2014. Chart depicts rapid rise in water temperature in early September as Shasta cold-water pool was exhausted. (Chart Source: NMFS)

Figure 2. Freshwater inflows to the Delta (blue arrows) including transfer water must mix first with many other source waters including brackish waters (green lines) from San Francisco Bay. South Delta exports draw water across the Delta (red arrows).
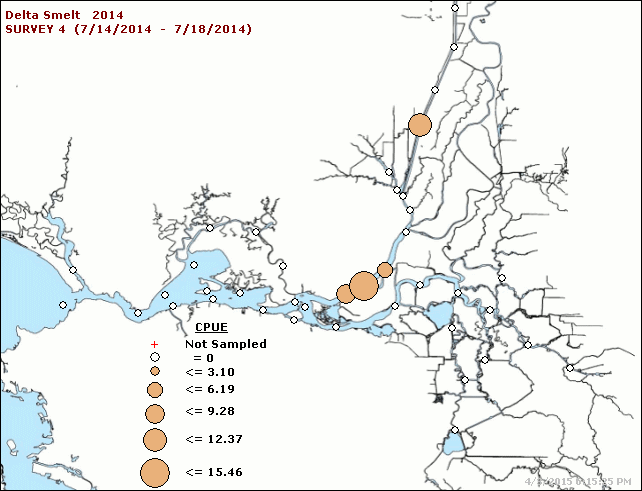
Figure 3. Catch distribution of Delta Smelt in CDFW Summer Townet Survey, July 2014. (Source: http://www.dfg.ca.gov/delta/data/townet/ )
- See http://www.water.ca.gov/watertransfers/issues.cfm for non-ecological issues ↩