Barging Hatchery Smolts to the Bay

In this blog I often recommend barging hatchery and even wild salmon from spawning rivers to the Bay up to 200 miles or more over conventional trucking or direct releases from hatcheries. The theory is that continuous recirculation of water in the barge (or boat) holding tank helps the young salmon remember from where they came and imprint the route back to their home river or hatchery.  Trucking directly to the Bay is believed to cause straying to non-natal rivers, resulting unnatural mixing of stocks, hatchery fish straying into wild fish spawning rivers, and less salmon returning to their home hatcheries where their eggs may be needed to meet quotas.  It is well documented that trucking and pen acclimation significantly increases the contribution of hatchery smolts to the ocean fishery up to two or three fold or more.  Concern over straying has kept the practice to a minimum.

Well it turns out from studies conducted with tagged hatchery salmon beginning with releases in 2008 that trucking, at least of American and Feather hatchery smolts, does not lead to significant amounts of straying.  Also, barging does not significantly reduce the already low straying rate.  So trucking to Bay net pens for acclimation remains the chosen strategy for the two largest State hatcheries, and probably the other two on the Mokelumne and Merced rivers.

The jury is still out on the Coleman and Livingston Stone federal hatcheries near Redding.  Straying rates are higher and the benefits of trucking over 200 miles seem questionable.  One concern I have is the high straying rate encountered for Coleman (Battle Creek) fish includes fish that move past Battle Creek further up in the Sacramento River and its upper tributaries.  Most of the spawning fish in these areas come from Coleman and Livingston Stone national fish hatcheries.  Because Coleman was built to mitigate for the loss of fish to those areas, I question their inclusion in the straying estimates.  The USFWS, which manages the two hatcheries, continues to be reluctant to truck and barge fish.

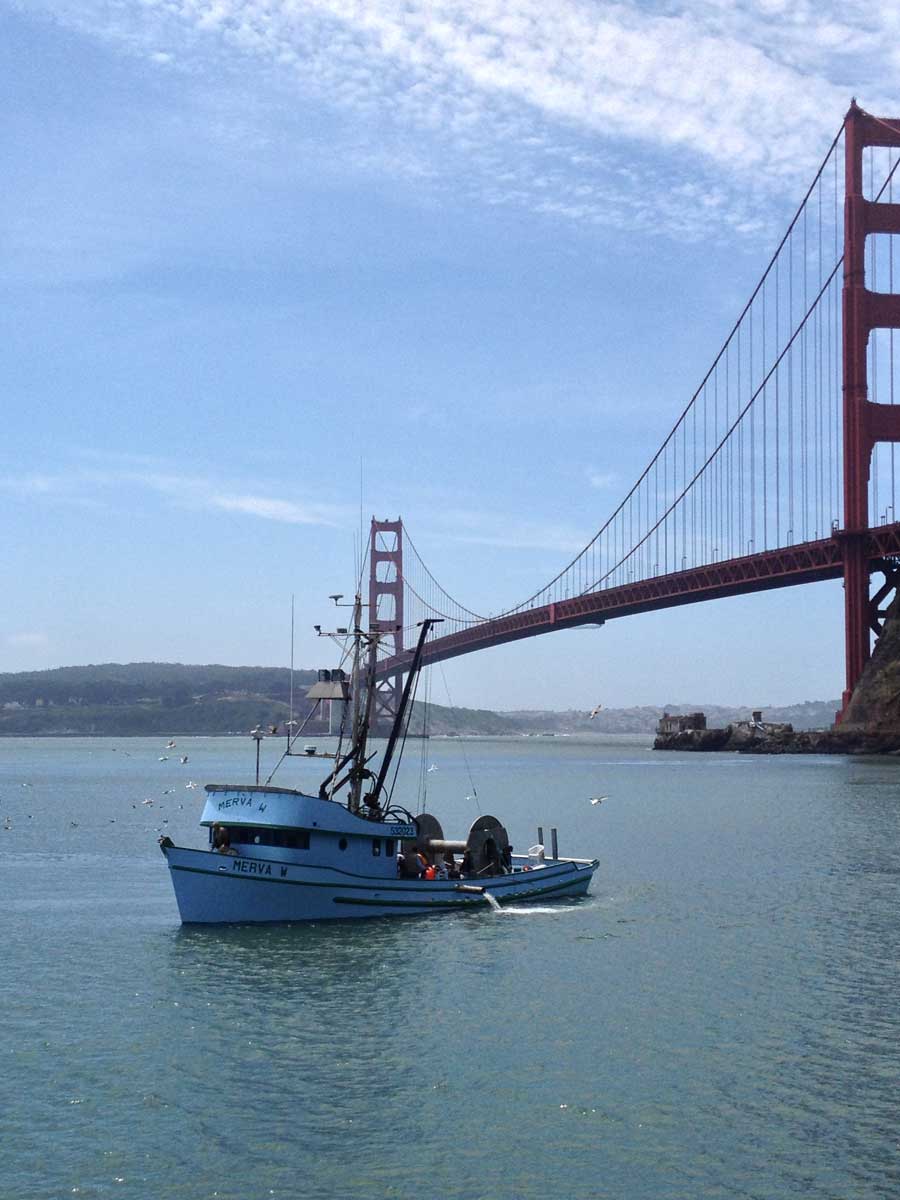
Though barging may not be needed for the Feather and American River hatcheries, it still holds potential for improving survival and reducing straying overall.  So far, there is no evidence that barging improves survival over trucking to Bay net pens.  I reviewed subsequent tag returns for a barge release group in early May 2012 with returns from two net pen groups released at the same time in the Bay.  I found the subsequent return percentage of the barge group  to be in between the two trucked pen release groups.  In the notes of the barge release, high predation by birds was noted.  In the photo of a barge release below many birds can be seen.  I wonder if the barge release would also benefit from the same pen acclimation that is employed after trucking, which significantly improves trucked fish release survival and subsequent contribution to the fishery.  (Note: I have been present at numerous truck releases to the Bay and have observed obvious extreme predation on the disoriented and confused hatchery fish, often released into warmer, saltier water than was present at the hatchery by a horde of well-trained and waiting birds and predatory fish.  Release to net pens at variable locations for acclimation and tow to open waters for underwater release seemed to greatly reduce predation, which proved true in subsequent tag returns.)

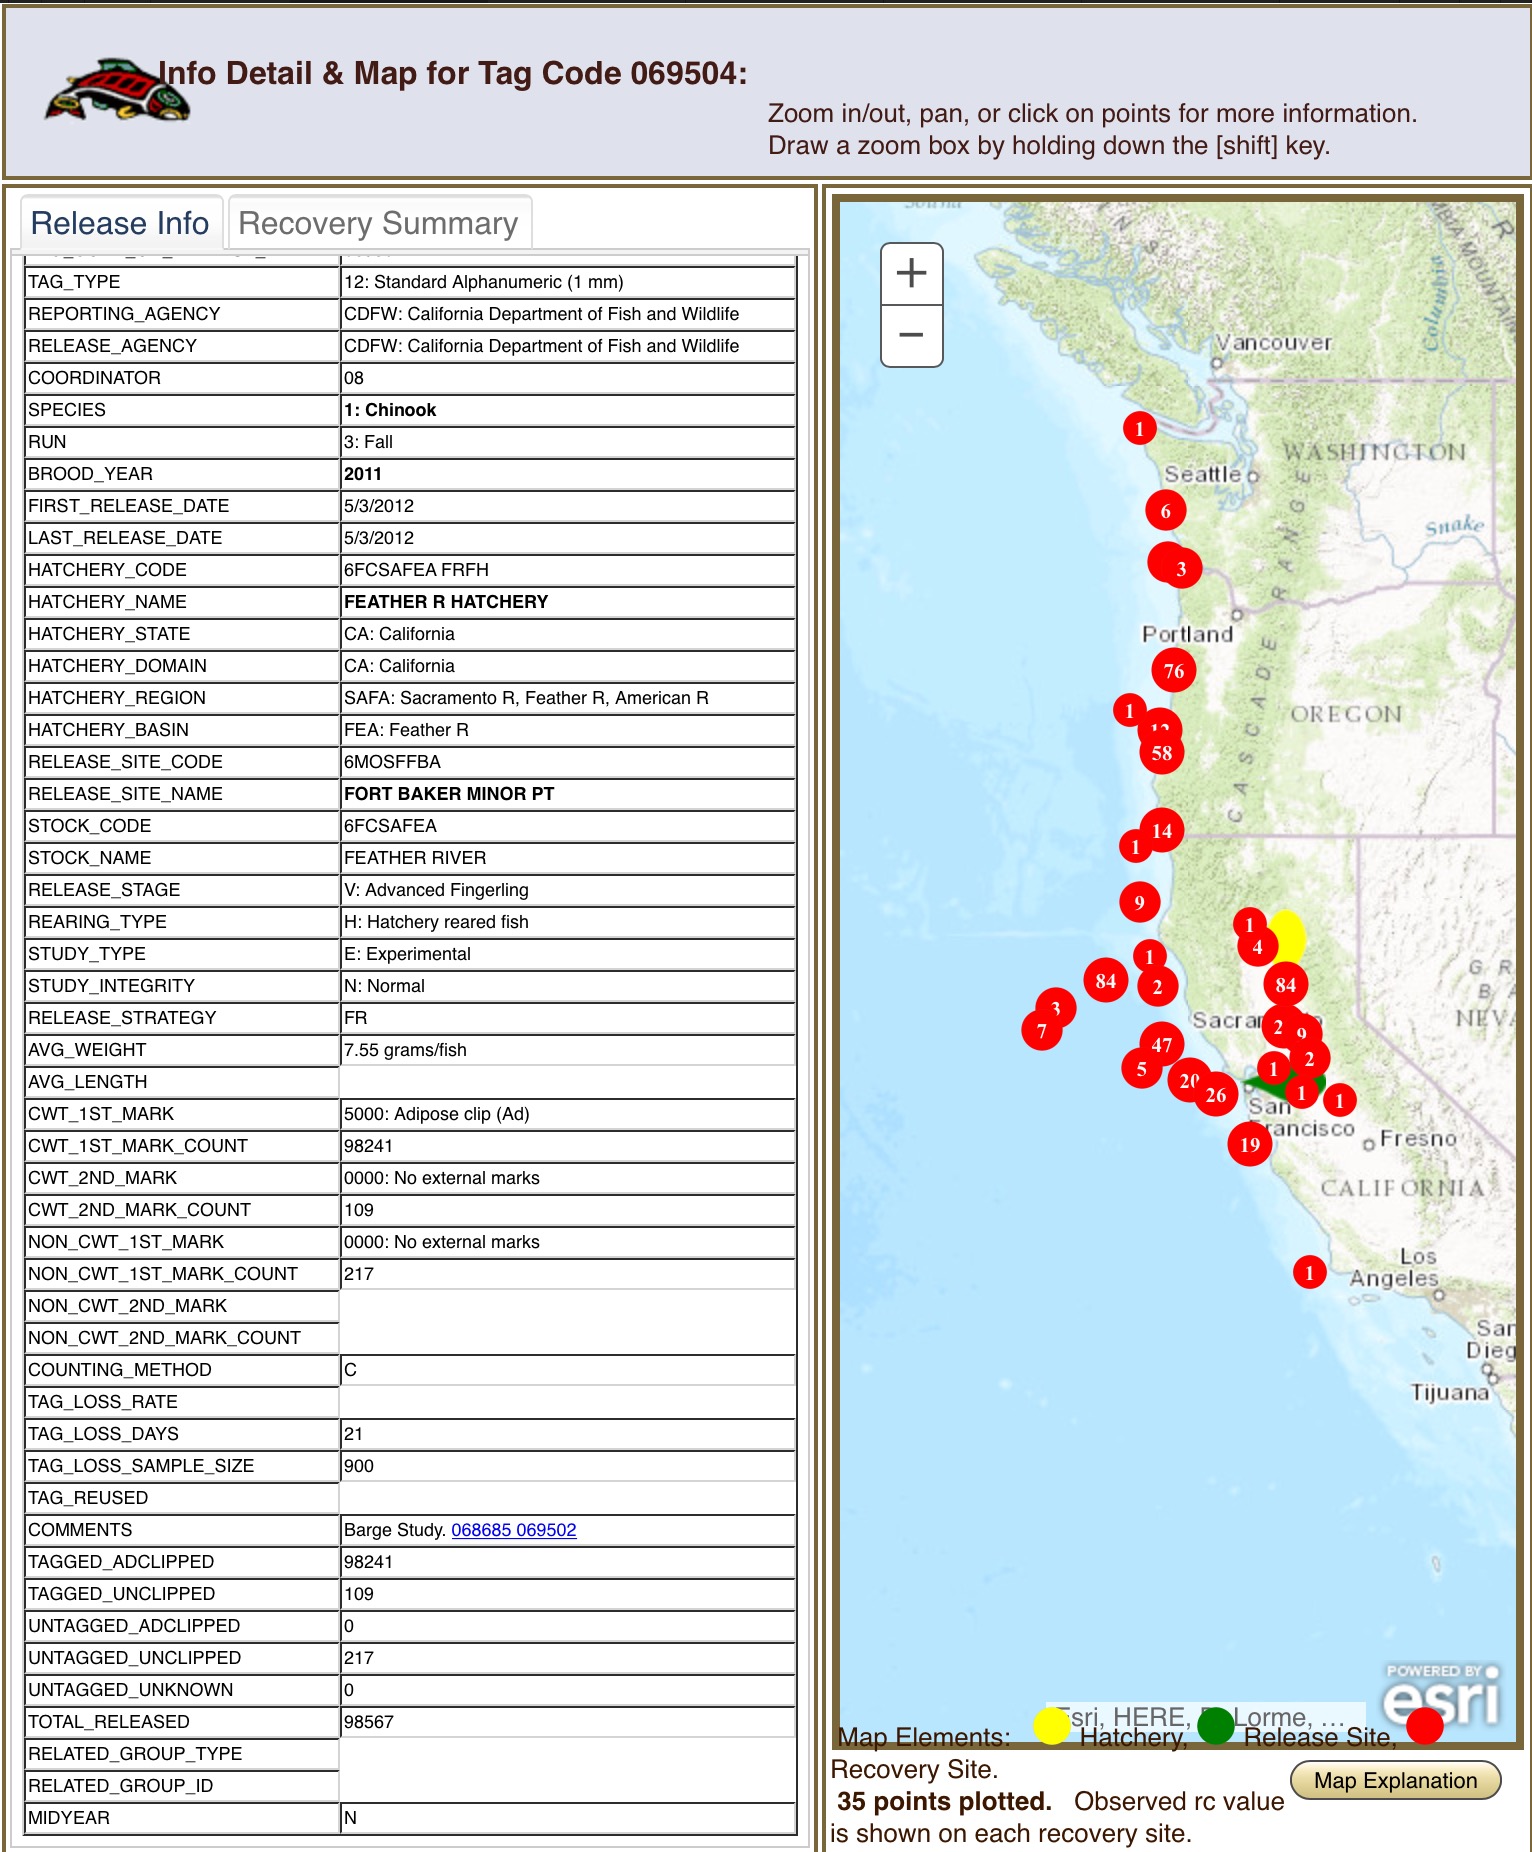
A closer look at the tag-release-recovery data and further experimentation would better answer the questions, concerns, and hypotheses.  There were nine barged groups released into the Bay from 2012-2014.  With some tags still out or not processed (tags are in noses of adult fish returns 2-4 years after release), information continues to come in.  The nearly million or so coded-wire-tags released from the nine barge groups swam with approximately 30 million other tagged fish from the six Central Valley hatcheries.  Furthermore, records are meticulously kept with other tagged groups from Washington and Oregon, as well as from other California watersheds (e.g., Klamath), by the Pacific States Marine Fisheries Commission.  An example of the type of information available is shown in the map-chart below for just the one barge release group from 2012.  The California Department of Fish and Wildlife has its own team and program to keep track of California immense database on releases and recoveries.  The Department’s report from November 2015 provides an excellent review of the whole process and results to date.

Barge in SF Bay

image2

Managing the Delta in Summer to Protect Delta Smelt

During June of this year, there was an effort on the part of the US Fish and Wildlife Service to procure water for summer Delta outflow for Delta smelt. Now the State has announced a similar plan. The summer standards for outflow in this Below Normal water year are a monthly average of 6500 cfs in July, 4000 cfs in August, and 3000 cfs in September. These outflows and the variability inherent in the monthly average standard are not protective of Delta smelt. In a June post, I recommended 9000, 5000, and 4000 cfs, respectively, to protect remaining smelt after four years of drought conditions. No water has been procured, and Delta outflow so far in July has averaged 7000 cfs.

The map below (Figure 1) shows the average location of X2, the location where salinity is approximately 2 parts per thousand (sea water is approximately 30 ppt) at various Delta outflows in cubic feet per second. X2 is the general location of the critical mixing zone of the estuary and the upper end of the Low Salinity Zone (1-6 ppt). The state Delta outflow standard for August is 4000 cfs, which should keep the daily average location of X2 west of Emmaton (EMM) and Jersey Pt (SJJ). This standard is required to protect Delta water quality, keep Delta smelt west of the influence of South Delta exports, and keep emigrating juvenile salmon moving west toward the Bay and Ocean. The standard applies in wetter year types including this year. In drier years, as in the past four years, the standard is 3000-3500 cfs.

The need for the higher July outflow protection stems from the fact that the smelt gradually move westward into more brackish water over the summer. In July they tend to be upstream of X2 in a planktonic stage and vulnerable to being drawn into the central Delta. They are often located at the upper end of the Low Salinity Zone (500-1500 EC) which in July, at 6500 cfs outflow, is vulnerable to exports (see location of Threemile Slough TSL, Jersey Pt SJJ, and False River FAL in Figure 1).

The issue of summer protections for smelt is critical to the future management prescriptions being developed in new water quality standards and smelt biological opinions. That makes it important to water contracting agencies like the Metropolitan Water District:

One of the key things the water contracting agencies are focusing on is the science behind the summer flow. “There’s been nothing that’s been articulated in writing in a comprehensive nature describing the science that leads to this proposal as to what kind of function is this summertime flow providing or what types of changes do they expect to occur for Delta smelt as a result of taking this kind of action,” he [Steve Arakawa, Bay Delta Initiatives Manager of Metropolitan Water District] said. “The water contracting agencies are following this very carefully because of the longer term implication of where such an action could show up in future regulations, whether it’s the biological opinions for the projects or whether it’s the State Water Resources Control Board setting standards and how Fish and Wildlife Service might be making proposals in future regulation proceedings.”… “There has been no clear indication of the science behind the flow proposal,” he said. “There have been discussions about turbidity, temperature, and salinity, but in many cases it’s mainly salinity that is affected by this flow. Whether turbidity or temperature can be affected by the flow is another question or maybe uncertain. Then it’s about with this additional flow, where do the fish go – do they stay in the Suisun Bay, do they go up into the channels into Suisun Marsh, farther up north? All of that is in question. The interest of the water contracting agencies is if this does proceed, is there a thought-out way of measuring the benefits of such proposed flows to monitor where do the fish go, what kind of results do we expect, and whether in fact those results did occur with such action.” 1

Figure 1. Location of X2 (2 parts per thousand salinity) in the Delta at various Delta outflows.

Figure 1. Location of X2 (2 parts per thousand salinity) in the Delta at various Delta outflows.

To protect Delta smelt in early summer (June and July), X2 and the Low Salinity Zone need to be located west of Emmaton and Jersey Point to ensure portions of the LSZ are not drawn into the central Delta from Jersey Point (via False River FAL) or Threemile Slough (TSL). In the following sections, graphs show clearly that such protections did not occur in drought years 2014 and 2015, and as yet not in 2016.

Keeping X2 below Jersey Point requires some daily, even hourly tuning of the Central Valley and Delta plumbing to compensate for tides. The next two charts (Figures 2 and 3) show that EC of 2000-4000 (X2 is about 2700 EC) reaches Jersey Point when tidally-filtered flow falls below zero during spring tides. The LSZ and X2 were at Jersey Point in early summer in both drought years.

Figure 2. Salinity (EC) in blue and tidally filtered flows in red at Jersey Point in early summer 2015. Delta outflows were 3000-4000 cfs in this critically dry year.

Figure 2. Salinity (EC) in blue and tidally filtered flows in red at Jersey Point in early summer 2015. Delta outflows were 3000-4000 cfs in this critically dry year.

Figure 3. Salinity (EC) in blue and tidally filtered flows in red at Jersey Point in early summer 2014. Delta outflows were 3000-5000 cfs in this critically dry year.

Figure 3. Salinity (EC) in blue and tidally filtered flows in red at Jersey Point in early summer 2014. Delta outflows were 3000-5000 cfs in this critically dry year.

In 2016 to date, by contrast, with outflow about 7000 cfs in early summer, salinity at Jersey Point is lower (Figure 4), but the upper LSZ remains at Jersey Point. Increasingly high salinity is indicative of rising south Delta exports through the period, beginning near 3000 cfs in early June and reaching 8000 cfs in early July. The tidally filtered flow at Jersey Point (Figure 5) gradually declined with increasing exports after mid-June.

In short, my recommendation for 9000 cfs outflow in July, and rationale for the quest for more water by the USFWS, are simply to bring salinity at Jersey Point back where it was in early June: below 500 EC. This would keep X2 and the LSZ with its remaining Delta smelt downstream of Jersey Point and away from the net negative flows toward the export pumps. Also, the further west X2 and the LSZ are located, the cooler they will be, which also benefits the smelt. If it were up to me, I would set a standard that EC should not exceed 500 at Jersey Point in early summer.

Figure 4. Salinity at Jersey Point in early summer 2016. X2 (EC 2700) has remained downstream.

Figure 4. Salinity at Jersey Point in early summer 2016. X2 (EC 2700) has remained downstream.

Figure 5. Tidally filtered flow at Jersey Point in early summer 2016. High negative flows are caused by South Delta exports during spring tides.

Figure 5. Tidally filtered flow at Jersey Point in early summer 2016. High negative flows are caused by South Delta exports during spring tides.

Striped Bass Comeback Stalls in June

In a June 1 post, I wrote of an apparently strong year class of striped bass developing in 2016.  This analysis was based on May surveys.  I suggested then the comeback could fall short after higher exports began in June.

The results of the two DFW 20-mm Surveys for June are in, and these results indeed show a sharp decline in the densities of juvenile striped bass between early and late June (Figure 1), coincident with a rise in south Delta exports over the month (Figure 2).  Some of the greatest changes occurred in the interior Delta (900 stations), where the effect of exports would be greatest.

The late June densities, though higher than 2014 and 2015, are consistent with densities over the previous decade of striped bass decline and are lower than the prior decade of striped bass recovery.  With the demise of the Delta smelt population, it may be appropriate to consider striped bass once again as the Delta’s “canary-in-the-coal-mine.”

 Figure 1. Striped bass juvenile density in the Delta in June 2016 20-mm surveys. The 700 stations are from the lower Sacramento River channel of the west and north Delta. The 800 stations are from the lower San Joaquin River channel of the west and central Delta. The 900 stations are from interior Delta channels. ( http://www.dfg.ca.gov/delta/data/20mm/stations.asp )


Figure 1. Striped bass juvenile density in the Delta in June 2016 20-mm surveys. The 700 stations are from the lower Sacramento River channel of the west and north Delta. The 800 stations are from the lower San Joaquin River channel of the west and central Delta. The 900 stations are from interior Delta channels. ( http://www.dfg.ca.gov/delta/data/20mm/stations.asp )

Figure 2. Reverse flow in Old and Middle Rivers in central Delta in June 2016. Reverse flows are representative of the direct effects of south Delta exports on central Delta channels. The survey periods of the two DFW 20-mm surveys are shown.

Figure 2. Reverse flow in Old and Middle Rivers in central Delta in June 2016. Reverse flows are representative of the direct effects of south Delta exports on central Delta channels. The survey periods of the two DFW 20-mm surveys are shown.

Central Valley Salmon Require Improved Resilience

A suite of disturbances in the Central Valley has eroded many of the inherent characteristics that once conferred resilience1 in historically abundant salmon populations.  Resilience is provided by natural abundance, diverse run timing, multiple habitats, and broad habitat availability and connectivity.  Last November, I recommended a dozen specific actions to save winter-run salmon.  This post focuses on long-term actions to restore resilience in Central Valley salmon populations and fisheries.

Resilience has declined due to the narrowing of optimal adult migration conditions, the confinement of spawning to localized areas and time periods, the limitation of outmigration periods and regional conditions, the confinement of rearing periods, and the amount of and connectivity of geographical habitats.

Confinement of salmon below dams constructed in the 1940’s  took away much of the resilience in the salmon populations.  In the past 70 years, the populations have depended upon a narrowing range of habitat conditions in time and space in the limited spawning habitat below Shasta and other major rim dams, as well as in the migration and rearing habitat between these spawning areas and San Francisco Bay.  The development of the State Water Project further diminished Central Valley salmon’s remaining resilience.

Resilience has been lost in following ways:

  1. Spawning habitat has gradually declined below dams due to lack of new gravel recruitment and the gradual armoring of spawning riffles.
  2. Spawning habitat has declined with weakened management of water temperature below Shasta, narrowing the spawning reach from 40 miles to as little as 10 miles. Early spawning of winter-run salmon in April and May has been lost even in wetter years like 2016 because of flow reductions in these months and because the temperature of water released from Shasta in these months has been increased.
  3. Embryo survival in redds and fry survival in rearing reaches has been compromised by low, warm summer and fall flows. More redds are dewatered with more frequency as water deliveries for irrigation taper off in the fall.
  4. Winter flows that carry juveniles to and through the Delta are lower and more sporadic. Fall and early winter flows and pulses that occurred historically and enhance smolt emigration no longer occur to the extent they once did, particularly in the spawning reaches immediately below the major reservoirs that regulate all the inflow.
  5. With lower and warmer river and Delta flows, salmon predators have become increasingly more effective.
  6. The quality of the physical habitat of salmon, and winter-run salmon in particular, has been adversely modified over time.

Hatcheries can reduce resilience over time if specific precautions are not taken to avoid weakening the gene pool and population diversity, and to avoid interactions with wild fish.  But hatcheries can also be used to strengthen resilience by increasing genetic diversity and spreading populations in time and geographical range.

Habitat restoration can increase resilience by limiting bottlenecks such as lack of spawning gravels or migration corridor connectivity.  Flow and water temperature remain the two most important habitat factors in the Central Valley.  The availability of floodplain rearing habitat is also important.  Reduced winter flooding resulting from global warming and lower reservoir carryover storage levels has reduced habitat resilience over time.  The gradual decline of large wood in Valley rivers over the decades has reduced the rearing capacity of streams and rivers.  River and stream channels have gradually degraded due to scour and the lack of large wood and natural sediment supplies.

A resilience-based approach is likely to be more successful than traditional mitigation or restoration approaches “by seeking to rebuild suites of disturbance-resistant characteristics” that were historically present in the Central Valley.  A resilience-based strategy “emphasizes the diversification of life history portfolios” and “would seek to maintain a diversity of habitat types, including less productive habitats that may have primary importance only as refugia or alternate spawning habitat during disturbances.”  The ultimate goal is to get salmon smolts to San Francisco Bay and the ocean, which offer cold waters and abundant food.

Historically, resilience occurred at all life stages, beginning with an abundance of adults.  With the present depressed adult runs, resilience is thus already handicapped.  Building runs requires restoring resilience of all life stages, starting with egg survival.  Turning around the decades of decline in resilience and increasing it, especially in the short term to avoid extinctions, is a therefore a major, expensive undertaking.  First, we should focus on stopping further declines in resilience.  Second, we should improve resilience where we can to begin the healing.  The following are some suggestions:

  1. Increase the salmon spawning reach below Shasta in time and space by providing better flows and water temperatures. Extend the spawning reach back down to Red Bluff and diversify timing with better early season conditions (e.g., April-May winter run spawning).  Improve physical habitat further downstream toward Red Bluff, not just near Redding.  Extend habitat improvements where possible into tributaries (e.g., Clear and Battle Creeks).
  2. Extend the range of salmon into former habitats, such as the planned improvements on Clear and Battle creeks, and in the reaches above selected rim dams.
  3. Expand the conservation hatchery program to diversify genetics and support expanded range. Select for specific natural genetic traits that have been lost or changed to increase diversity.
  4. Develop and implement a river flow management plan for the Sacramento River downstream of Shasta and Keswick dams that considers the effects of climate change and balances beneficial uses with the flow and water temperature.
  5. Increase the range in time and space of rearing and migratory habitats that accommodate diversity.
  6. Develop and implement a long-term large wood and gravel augmentation2 plan consistent with existing plans and flood management to increase and maintain spawning habitat for salmon and steelhead downstream of dams. Diversify habitats and reduce habitat bottlenecks.  Expand rare and important habitat types.
  7. Counteract where possible the effects of climate change. Where changes in flow and water temperature changes delay smolting, make changes that return diversity.
  8. Provide a more natural diversity of flow pulses immediately below major dams during the emigration season (i.e., December-April) to diversify the timing and life stages of the emigration of juvenile salmon.

A final note:

Instead of improving resilience, the Delta “WaterFix” will only cut further into and adversely modify the resilience of the salmon populations.  There will be more demands on Shasta storage to meet new Tunnel diversion capacity.  Flows below the Tunnel intakes will be lower, further reducing resilience by warming through-Delta spring migration routes (Figure 1).  Less freshwater flow into the Delta will further alter Delta habitats and make them more conducive to non-native invasive species of plants and animals.  Delta habitat will be warmer earlier in the season, less turbid, and more brackish.

Figure 1. Water temperature versus mean daily flow at Rio Vista in spring 2016. (Source of data: CDEC). Resilience in terms of Delta migration survival would be reduced by the effects of the proposed WaterFix on water temperature in the Delta spring migration route.

Figure 1. Water temperature versus mean daily flow at Rio Vista in spring 2016. (Source of data: CDEC). Resilience in terms of Delta migration survival would be reduced by the effects of the proposed WaterFix on water temperature in the Delta spring migration route.

  1. Resilience Approach or Portfolio Effect – The “portfolio effect,” is the coexistence of multiple life history strategies within a population – how diversity in life history can increase resilience and stability.
    http://fisheries.org/2016/03/a-resilience-approach-can-improve-anadromous-fish-restoration/
  2.  http://www.redding.com/news/local/gravel-work-to-aid-salmon-2bcbc5bc-999f-2cba-e053-0100007fbf34-369363581.html

July 1 Smelt Update

The Smelt Working Group packed its bags for the summer after its last meeting on May 31, just when it was most needed.  The water temperature in the South Delta had reached 77°F/25°C in the first week of June, forcing the Working Group to close shop, consistent with the biological opinion.  The 5000 cfs June south Delta export limit in the biological opinion also departed.  Exports soon rose above the earlier 3000 cfs limit, reaching nearly 7000 cfs later in June (Figure 1).

Figure 1

Figure 1. Old and Middle River net flows in June 2016. Negative flows generally correspond with export rates at the south Delta pumping plants. The limit in the Delta Smelt biological opinion is -5000 cfs for June, but the limit does not apply once the south Delta water temperature reaches 77°F/25°C.

The two June DFW 20-MM surveys showed that small numbers of Delta smelt remained in their normal northwest Delta nursery area (Figures 2 and 3) in slightly brackish, cooler (20-22°C) water. Still directly and indirectly vulnerable to the effects of exports, these smelt were sustained by a bare minimum of Delta outflows (7000-7500 cfs). What they needed and are still failing to receive are higher outflows to move them west to Suisun Bay.1 With exports soon to rise in July up to the full 11,400 cfs maximum capacity, and without further hope of higher outflow to the Bay, these last smelt may soon succumb to the rigors of the Delta as they did during the past four years of drought.

Instead of the prescribed standard of 6,500 cfs Delta outflow in July, an outflow of at least 8,000 cfs is necessary to protect the remaining smelt.

 Figure 2. Survey 7 of 20-MM Survey results for Delta smelt.


Figure 2. Survey 7 of 20-MM Survey results for Delta smelt.

Figure 3. Survey 8 of 20-MM Survey results for Delta smelt.

Figure 3. Survey 8 of 20-MM Survey results for Delta smelt.