
In my August 2017 post on the status of American River fall-run Chinook salmon, I analyzed recruitment through the fall 2016 spawning run. The 2016 run was a product of fall 2013 spawners (brood year 2013). In a May 2019 post, I discussed the survival of hatchery brood year releases through 2014. After record low escapement/recruitment in 2008 and 2009, there was a modest recovery from 2010-2014, followed by lower runs in 2015 and 2016 (brood years 2012 and 2013), the product of the 2012-2016 drought. Brood years 2012, 2013, and 2014 suffered from poor juvenile survival of hatchery and wild salmon in critical drought years 2013-2015. Overall production was sustained by Bay and coastal hatchery smolt releases (trucking and pen releases).
In this post, I update the status of the American River fall-run through 2018 with the addition of escapement estimates for the 2017 and 2018 runs. I also provide updated information on returns of hatchery brood year 2014 (2015 smolt releases). In addition, I provide a prognosis for the fall 2019 and future runs (returns/escapement).
2017 and 2018 Escapement
Poor river escapement in 2017 (Figure 1) likely reflects poor survival of naturally spawned salmon from fall through spring of critical drought water year 2015. The strong hatchery escapement in 2017 (Figure 2) reflects higher survival of brood-year 2014 hatchery releases to the Bay. Escapement improved in 2018 with higher river contributions from brood year 2015.
Updated Brood Year 2014 Hatchery Survival
Survival estimates based on hatchery coded-wire-tag returns for brood year 2014 (released in spring of critical drought year 2015) ranged from 0.3 to 1.4% (Figure 3). All were releases to Bay net pens. The two higher (good) survival rates were from mid-May releases, when outflows were slightly higher and Bay temperatures were cooler (Figure 4). Differences in survival among and within years reflect a positive relationship between survival and Delta outflow on the date of release (Figure 5).
Brood Year 2015 Hatchery Survival
Survival of hatchery brood year 2015 (2018 hatchery counts, Figure 2) was slightly depressed, possibly as a consequence of more of the hatchery smolt production being released into the lower American River rather than trucked to Bay pens (Figure 6). Early tag returns from the 2016 releases indicate much higher survival of the Bay pen releases than river releases (Figure 6).
Prognosis for Brood Year 2016 (Fall 2019 Run)
River flows and Delta outflow conditions were much better in springs of 2016-2019, wetter water years, than in the springs of the 2013-2015 critical drought years (Figure 7). Survival of naturally produced fish and hatchery fish released into the river should show improvements given the wetter conditions. Survival of hatchery fish released to the Bay should be good given higher Delta outflows. It may take wet-year-type spring river flows (Figure 8) or timed pulsed flows to achieve high survival of river smolt releases. River-release survival rates from 2016 and 2018 release groups are likely to be depressed since these water years were saw only moderate flows after mid-April, whereas river-release survival rates from the abundant water years 2017 and 2019 are likely to be good, as in 2010 and 2011.
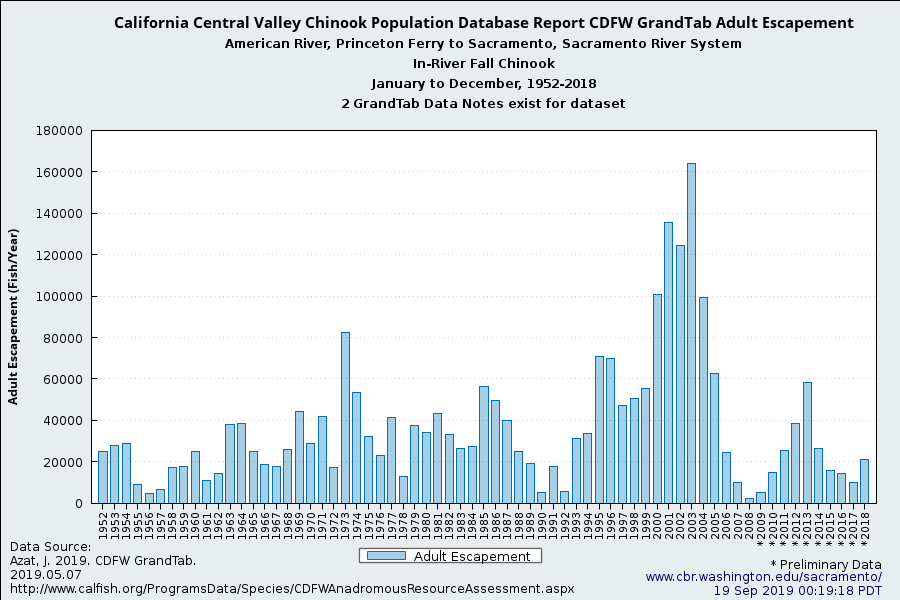
Figure 1. River spawner estimates 1952-2018.
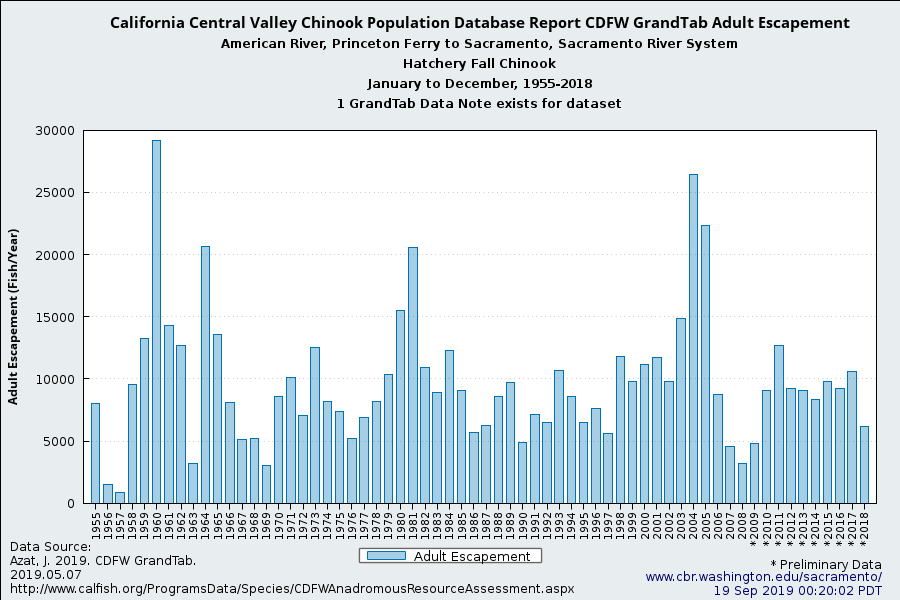
Figure 2. Hatchery spawner estimates 1955-2018.
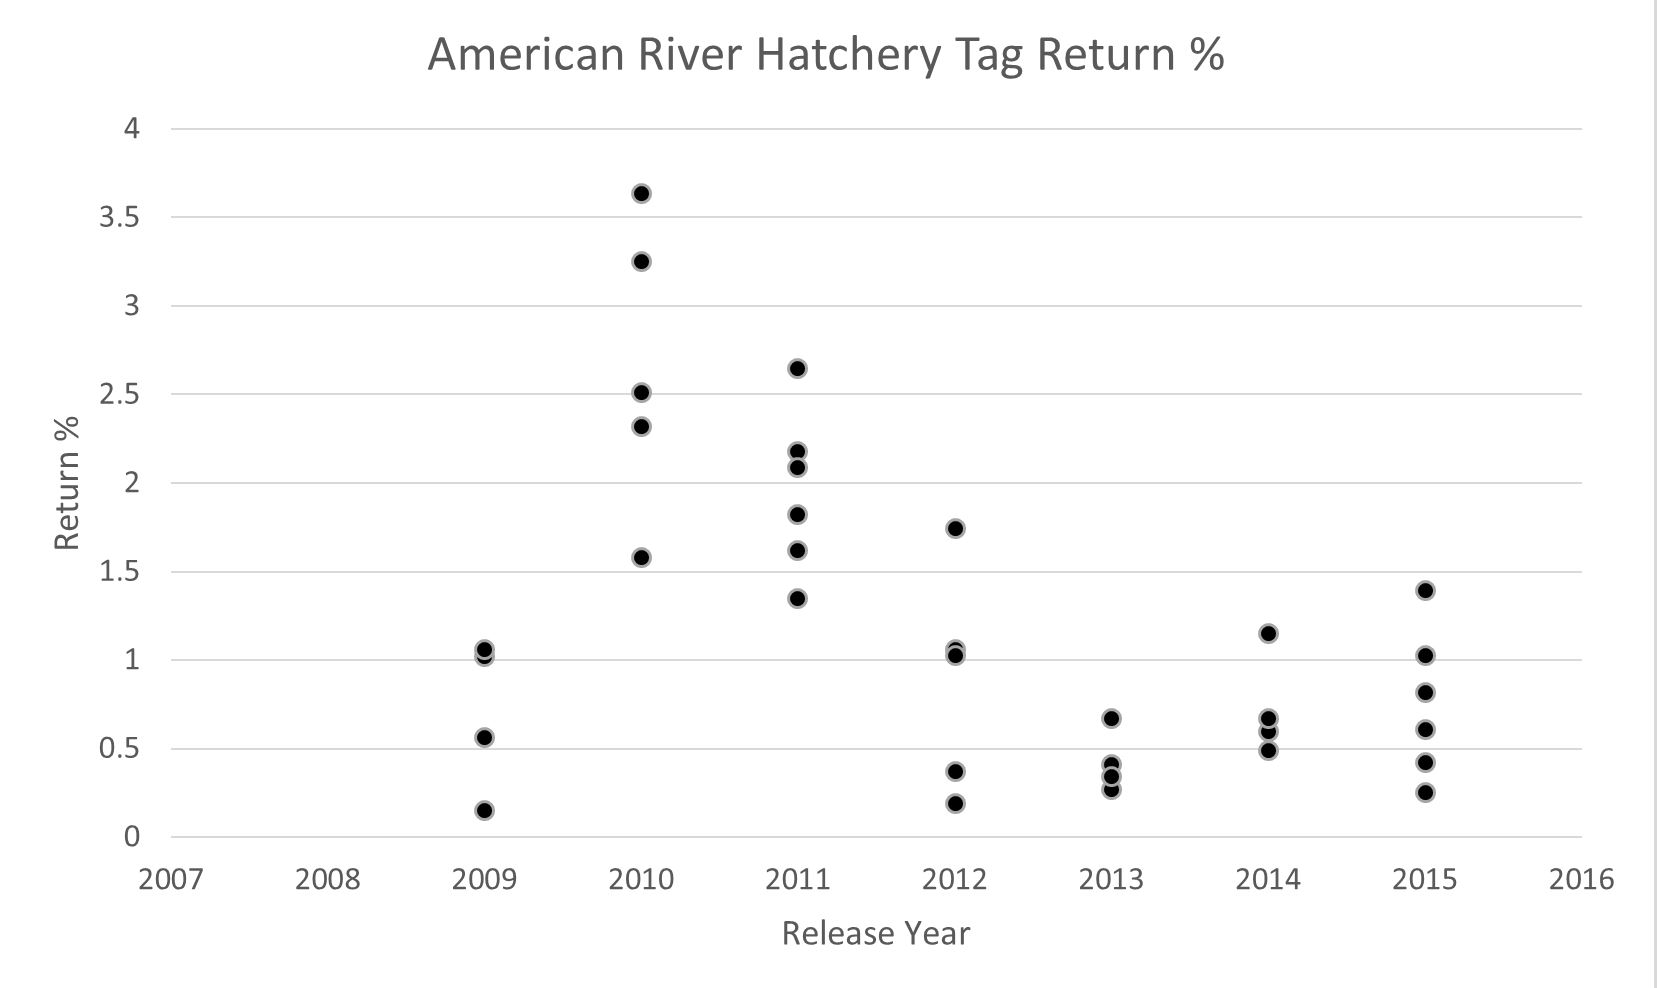
Figure 3. American River Hatchery smolt release group survival (%return) for 2009 to 2015. Data Source: https://www.rmis.org/.
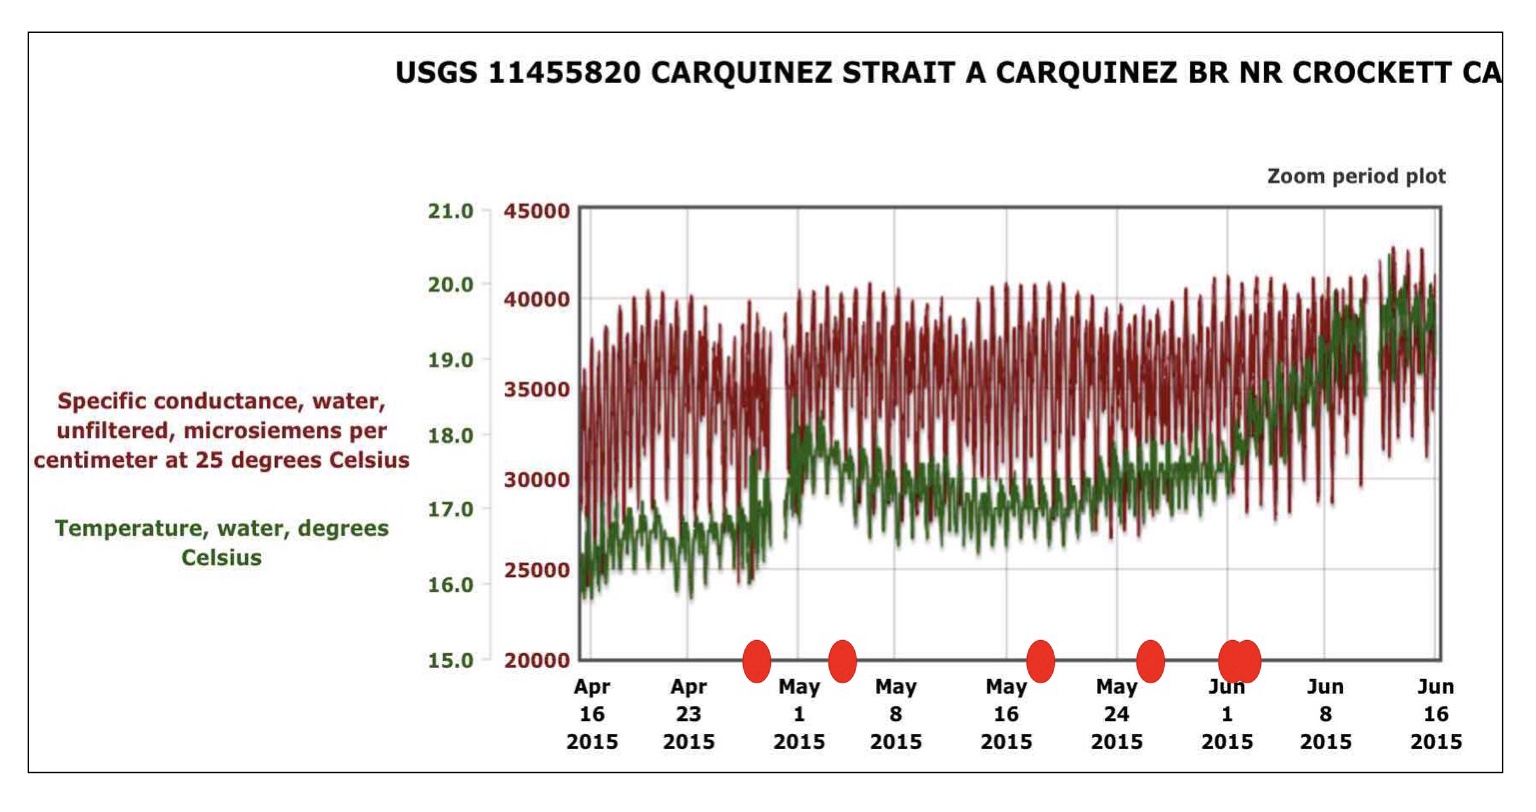
Figure 4. Water temperature and salinity (EC) near American River Hatchery smolt net-pen release sites in spring 2015. Red dots are dates when smolts were released.
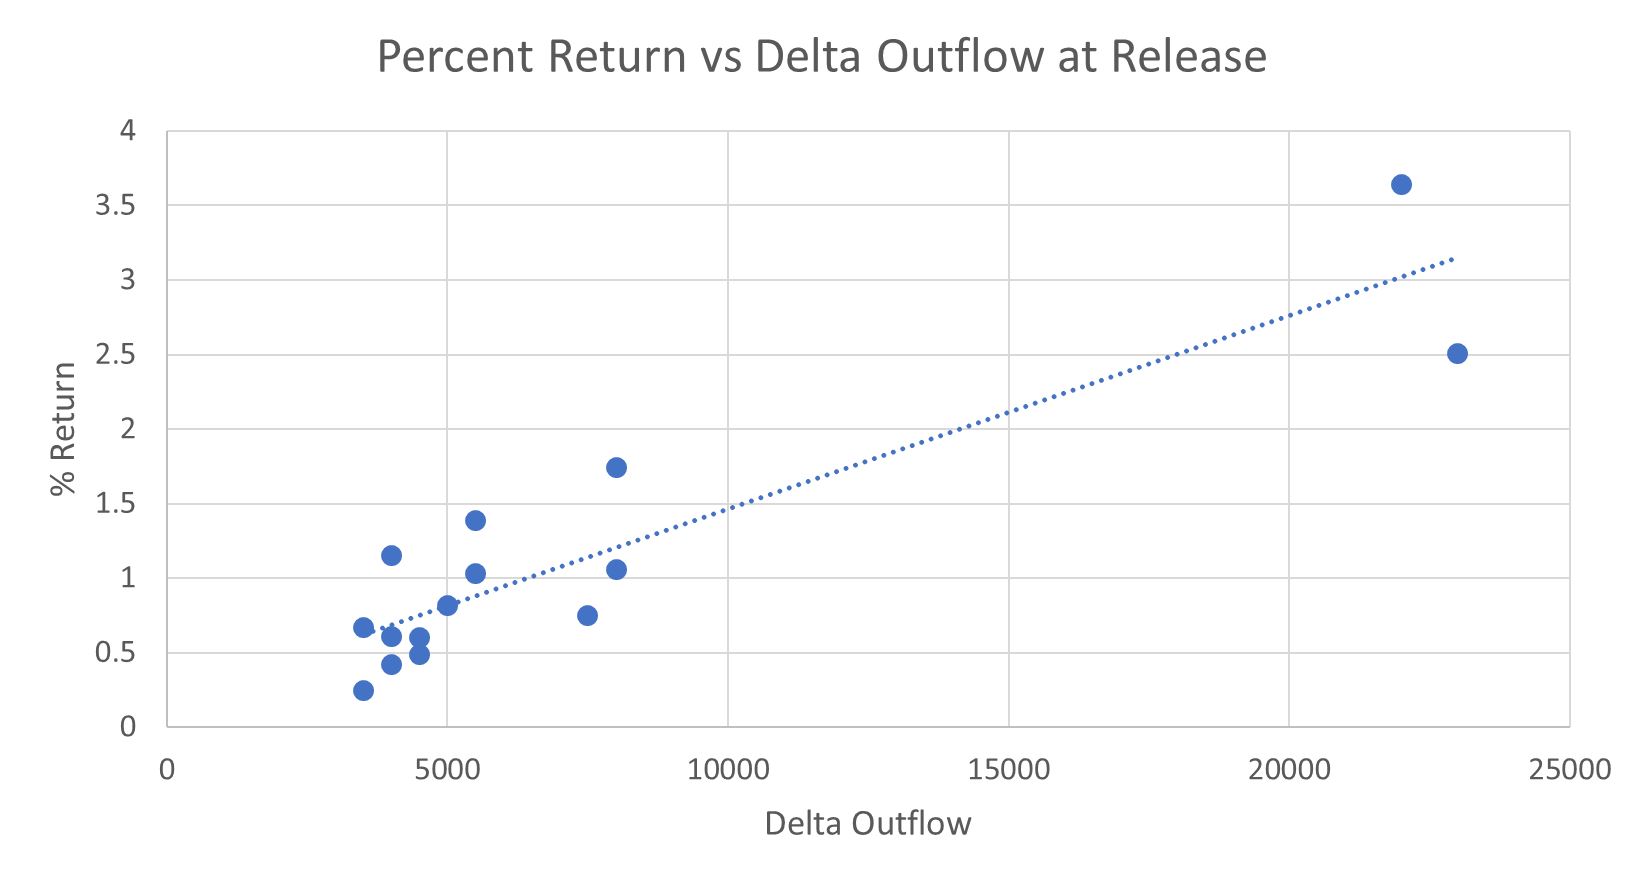
Figure 5. Smolt Bay-pen release group survival rate versus Delta outflow at the time of release.
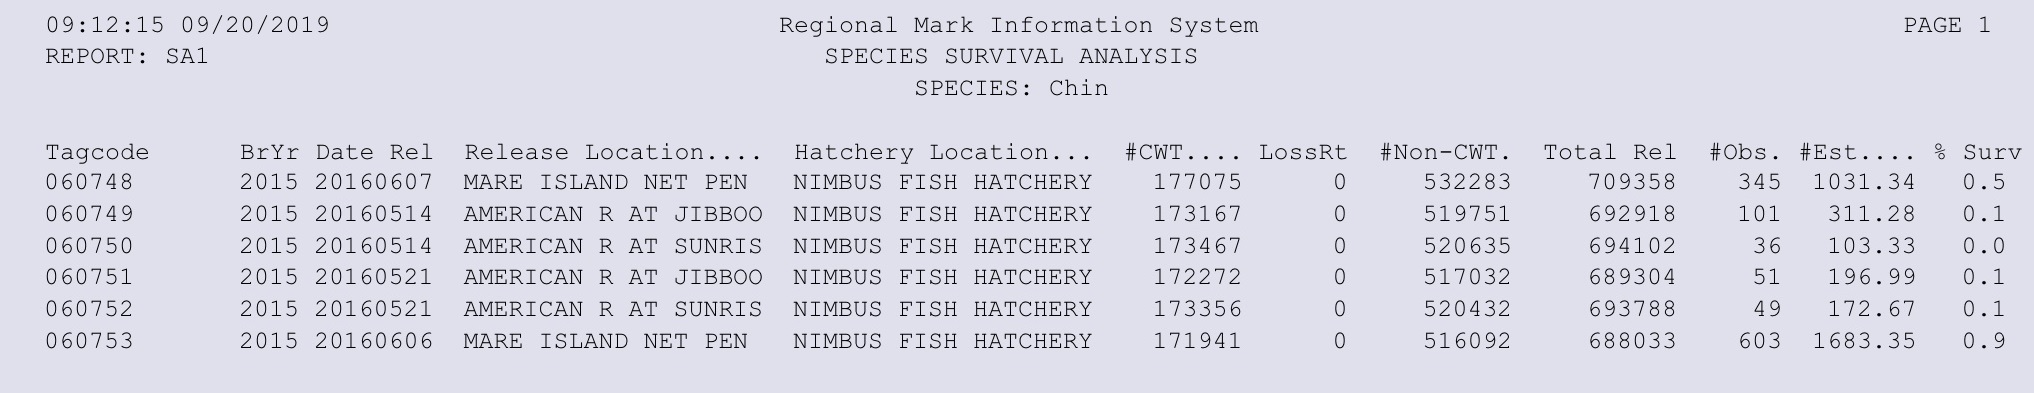
Figure 6. Brood year 2015 hatchery smolt releases in spring 2016.
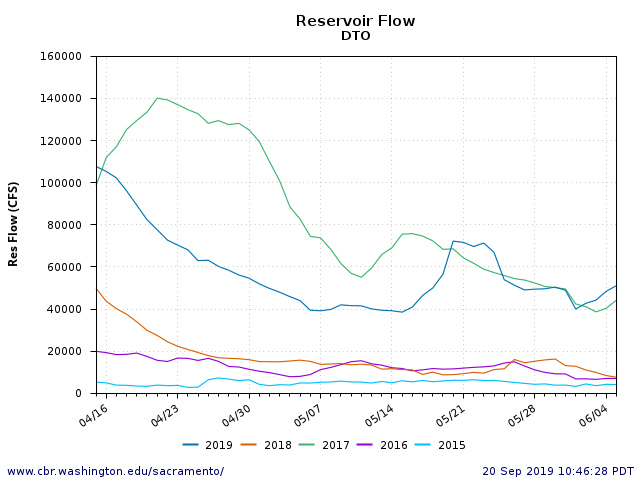
Figure 7. Delta outflow spring 2015-2019.
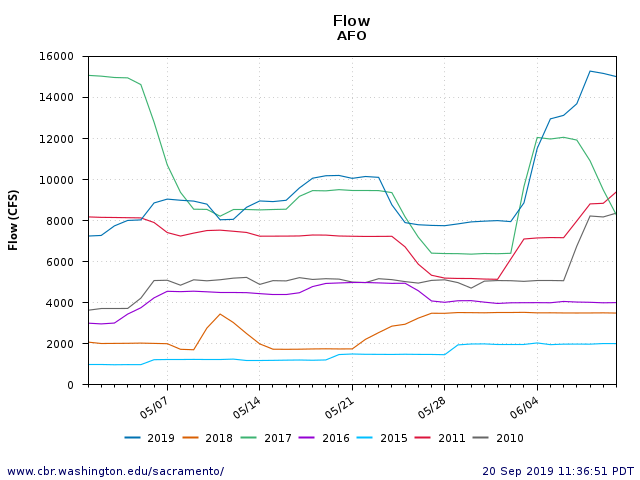
Figure 8. American River flow at Fair Oaks in spring of selected years in last decade.