
Following an introductory post, this is the fourth post in a series on the lessons learned by the National Marine Fisheries Service (NMFS) from the 2013-2015 drought that devastated Sacramento River salmon populations. This post addresses Lesson #3.
The side gates at the bottom of the Temperature Control Device (TCD) on the inside face of Shasta Dam (Figure 1) allow deeper, colder water in the reservoir to be drawn into the power plant intake penstocks and released to the river below. Use of the side gates allows more colder water to be released for salmon in the river below in summer and fall in years when reservoir levels are low and the cold-water-pool is limited.
In 2014 and 2015, NMFS and the Bureau of Reclamation learned that when the reservoir level is low and the side gates are opened to access cold water, some warmer surface water is also drawn downward into the side gate openings.1 The entrance of some warm water through the side gates compromises temperatures downstream of the dam, thus reducing the effectiveness of the TCD system. Warmer-than-expected release temperatures also limit the ability of Reclamation to meet water demands for downstream contractors when reservoir levels are low. Delaying side gate use with the present structure requires maintaining higher summer storage levels with less summer deliveries.
A comparison of Shasta conditions in mid-August 2014 and mid-August 2015 provides a good example of the problems (Figures 2 and 3). Reclamation used the side gates in August 2014 but not in August 2015. In 2014, Reclamation released more irrigation water in summer, in anticipation of being able to use the side gates (Figure 4). In 2015, lower summer releases conserved storage and cold-water-pool volume, thus delaying use of the side gates. The 2014 operations led to the complete loss of access to the cold-water-pool by October (Figure 5). Water temperatures in 2015 were still too high, but complete loss of control did not occur.
There are other operational changes that may help. Most of the water discharged from the TCD passes through penstocks to powerhouses near the base of Shasta Dam. Those powerhouses are operated based on power demand and prices, not based on temperature management (lower graph of Figure 6). As power demand and power values increase, Reclamation “peaks” the powerhouses to follow these increases. However, the amount of water going through the powerhouses seems to affect the layer of water in Shasta Reservoir that the TCD draws from. and thus the temperature of the dam release water (Figure 6). Low intake rates during non-peak times appear to draw a greater proportion of warmer surface waters from Shasta Reservoir.
It is likely that a more constant rate of release from Shasta Reservoir, rather than peaking, would maintain an overall lower temperature of water that leaves Shasta Reservoir and enters Keswick Reservoir immediately downstream of Shasta. It is also likely that a constant flow of water through Keswick would allow less mixing of Keswick’s warmer surface water with the cooler release from Shasta. This is because water from Shasta would spend less time in Keswick and because a constant release from Shasta would help the cooler water maintain an “underflow” of cooler water at the bottom of Keswick.
Similarly, operation of the powerhouses at Trinity Reservoir and Whiskeytown Reservoir affect the water temperature of water exported from the Trinity River to the Sacramento River system. Most of the water exported from the Trinity to the Sacramento passes through Spring Creek Powerhouse, located on the west side of Keswick Reservoir. All of these powerhouses, too, are operated for power first, not for water temperature. Reduced peaking at these facilities, or simply optimization for water temperature, would help improve water temperatures in the Sacramento River downstream of Keswick Reservoir.
In summary, higher storage levels and greater cold-water-pool volume, delayed use of side gates, changing side gate openings, fixing leaks, and possible changes to peaking power operations may be necessary to protect salmon in the Sacramento River below Shasta Dam.
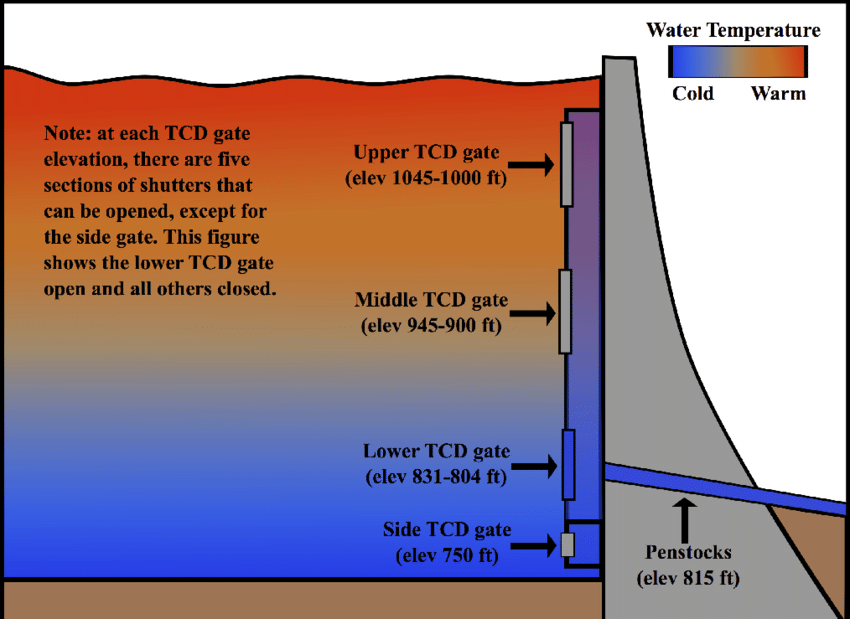
Figure 1. Shasta Dam Temperature Control Device configuration. Source: Reclamation
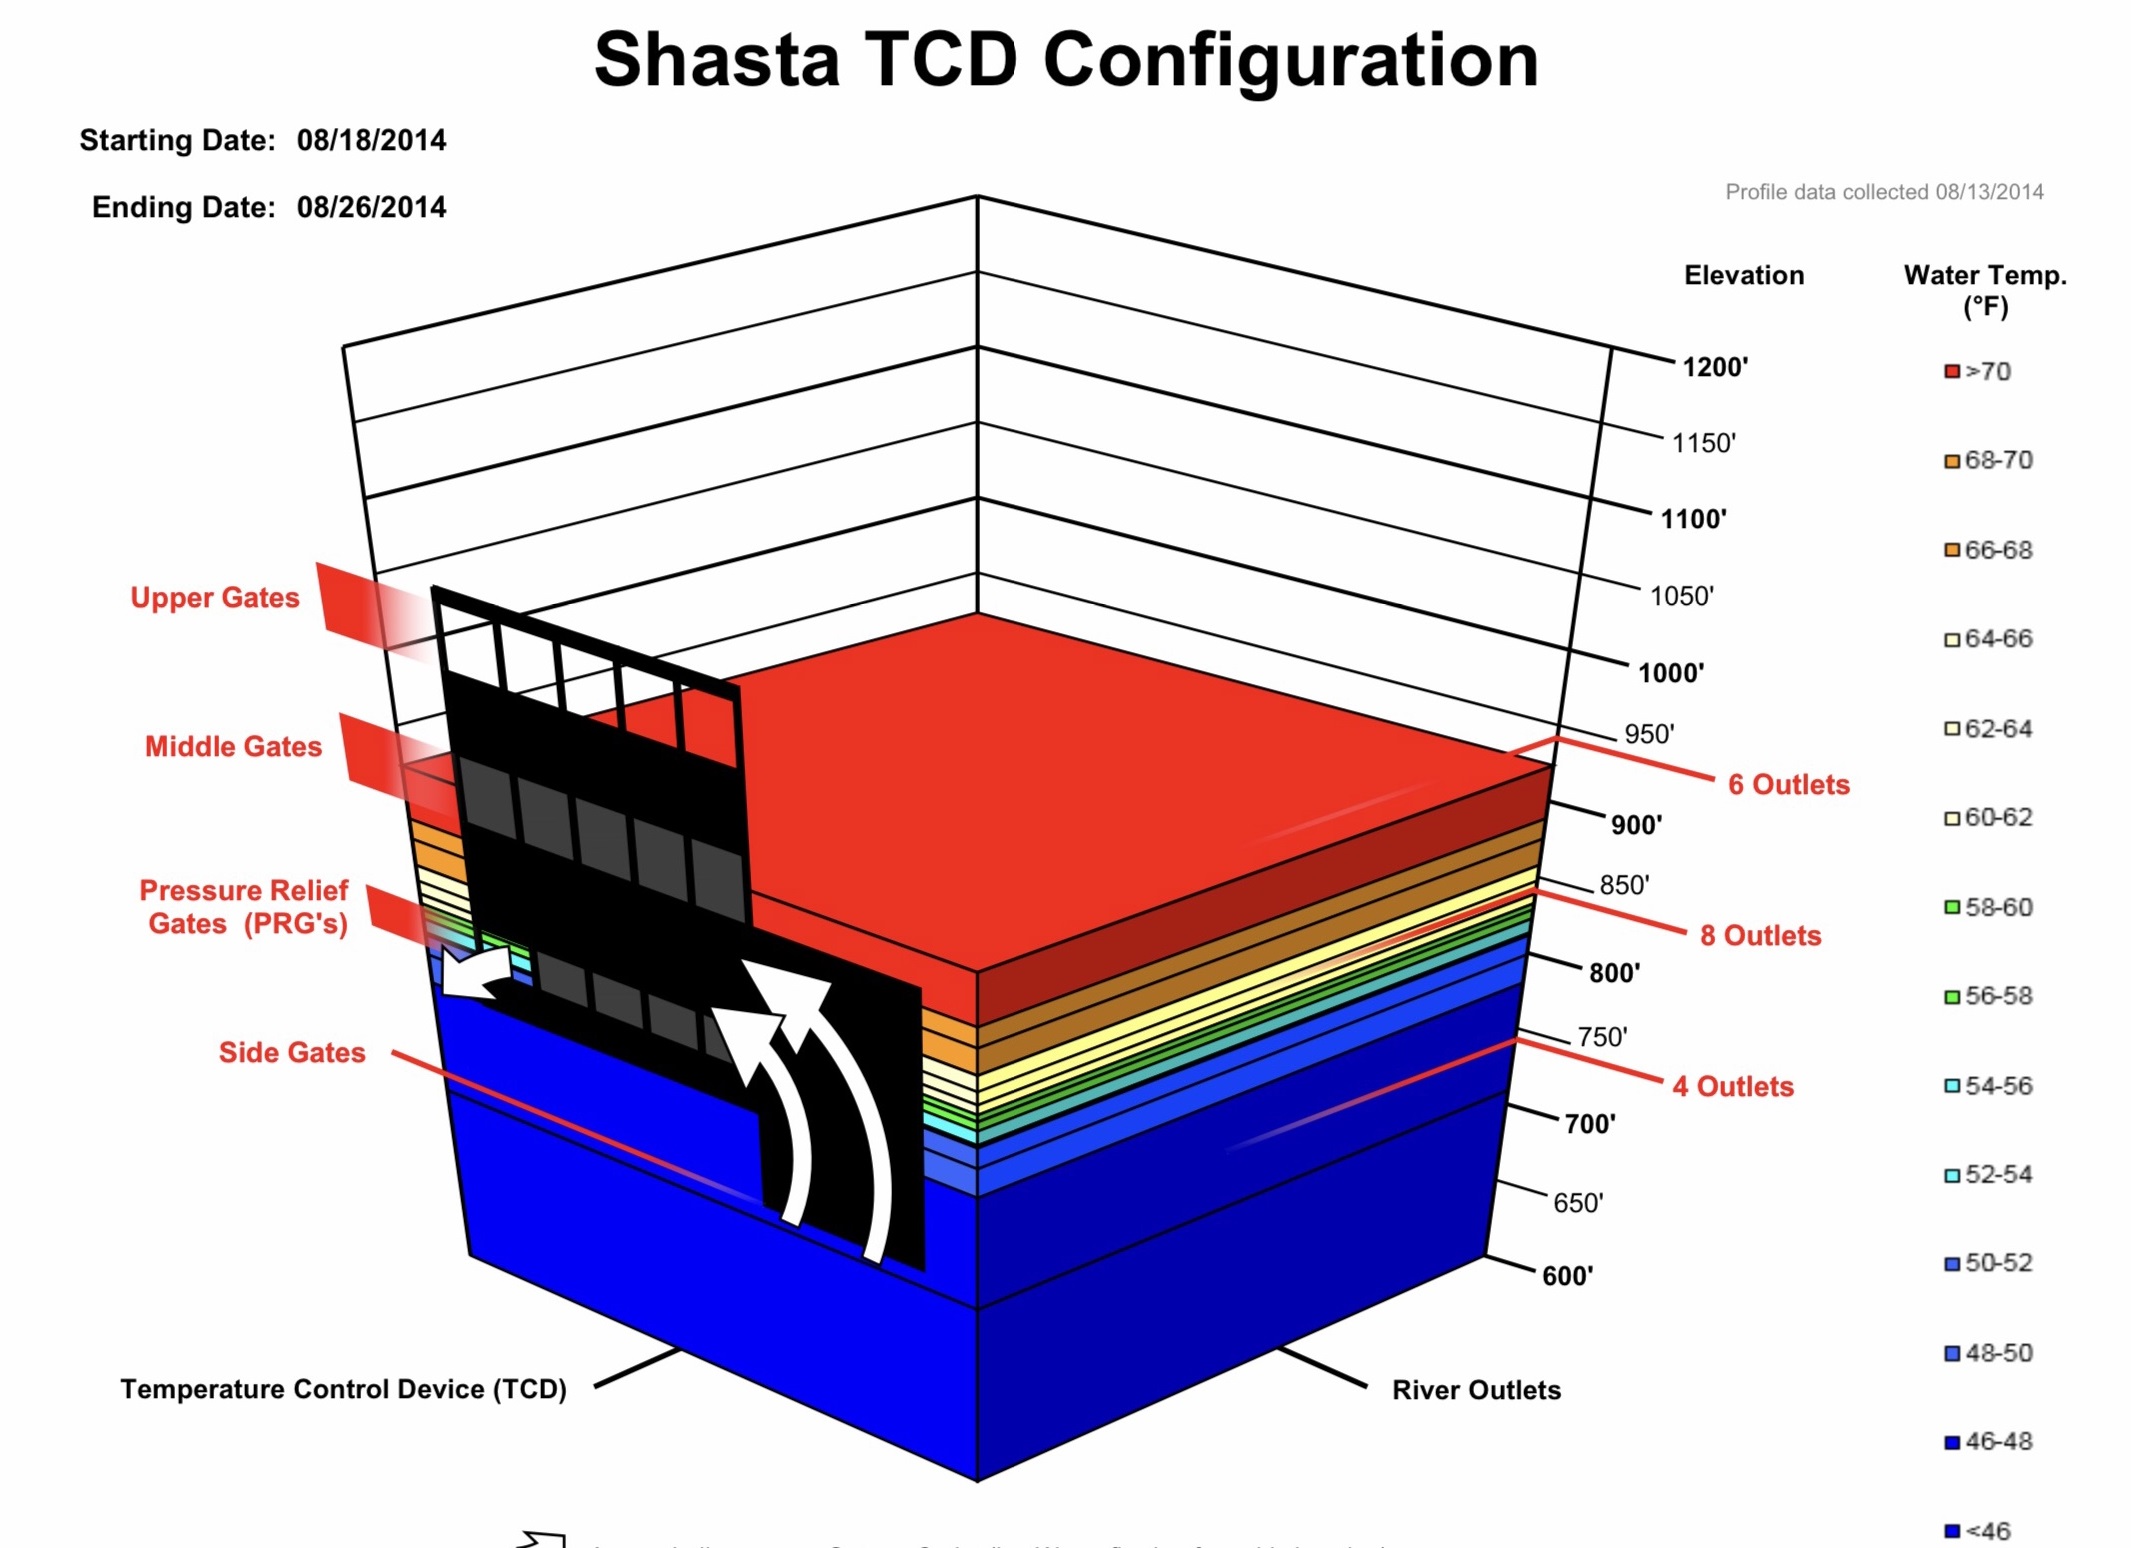
Figure 2. Shasta reservoir water temperature profile and TCD operation in August 2014. Note side gate use (curved arrows).
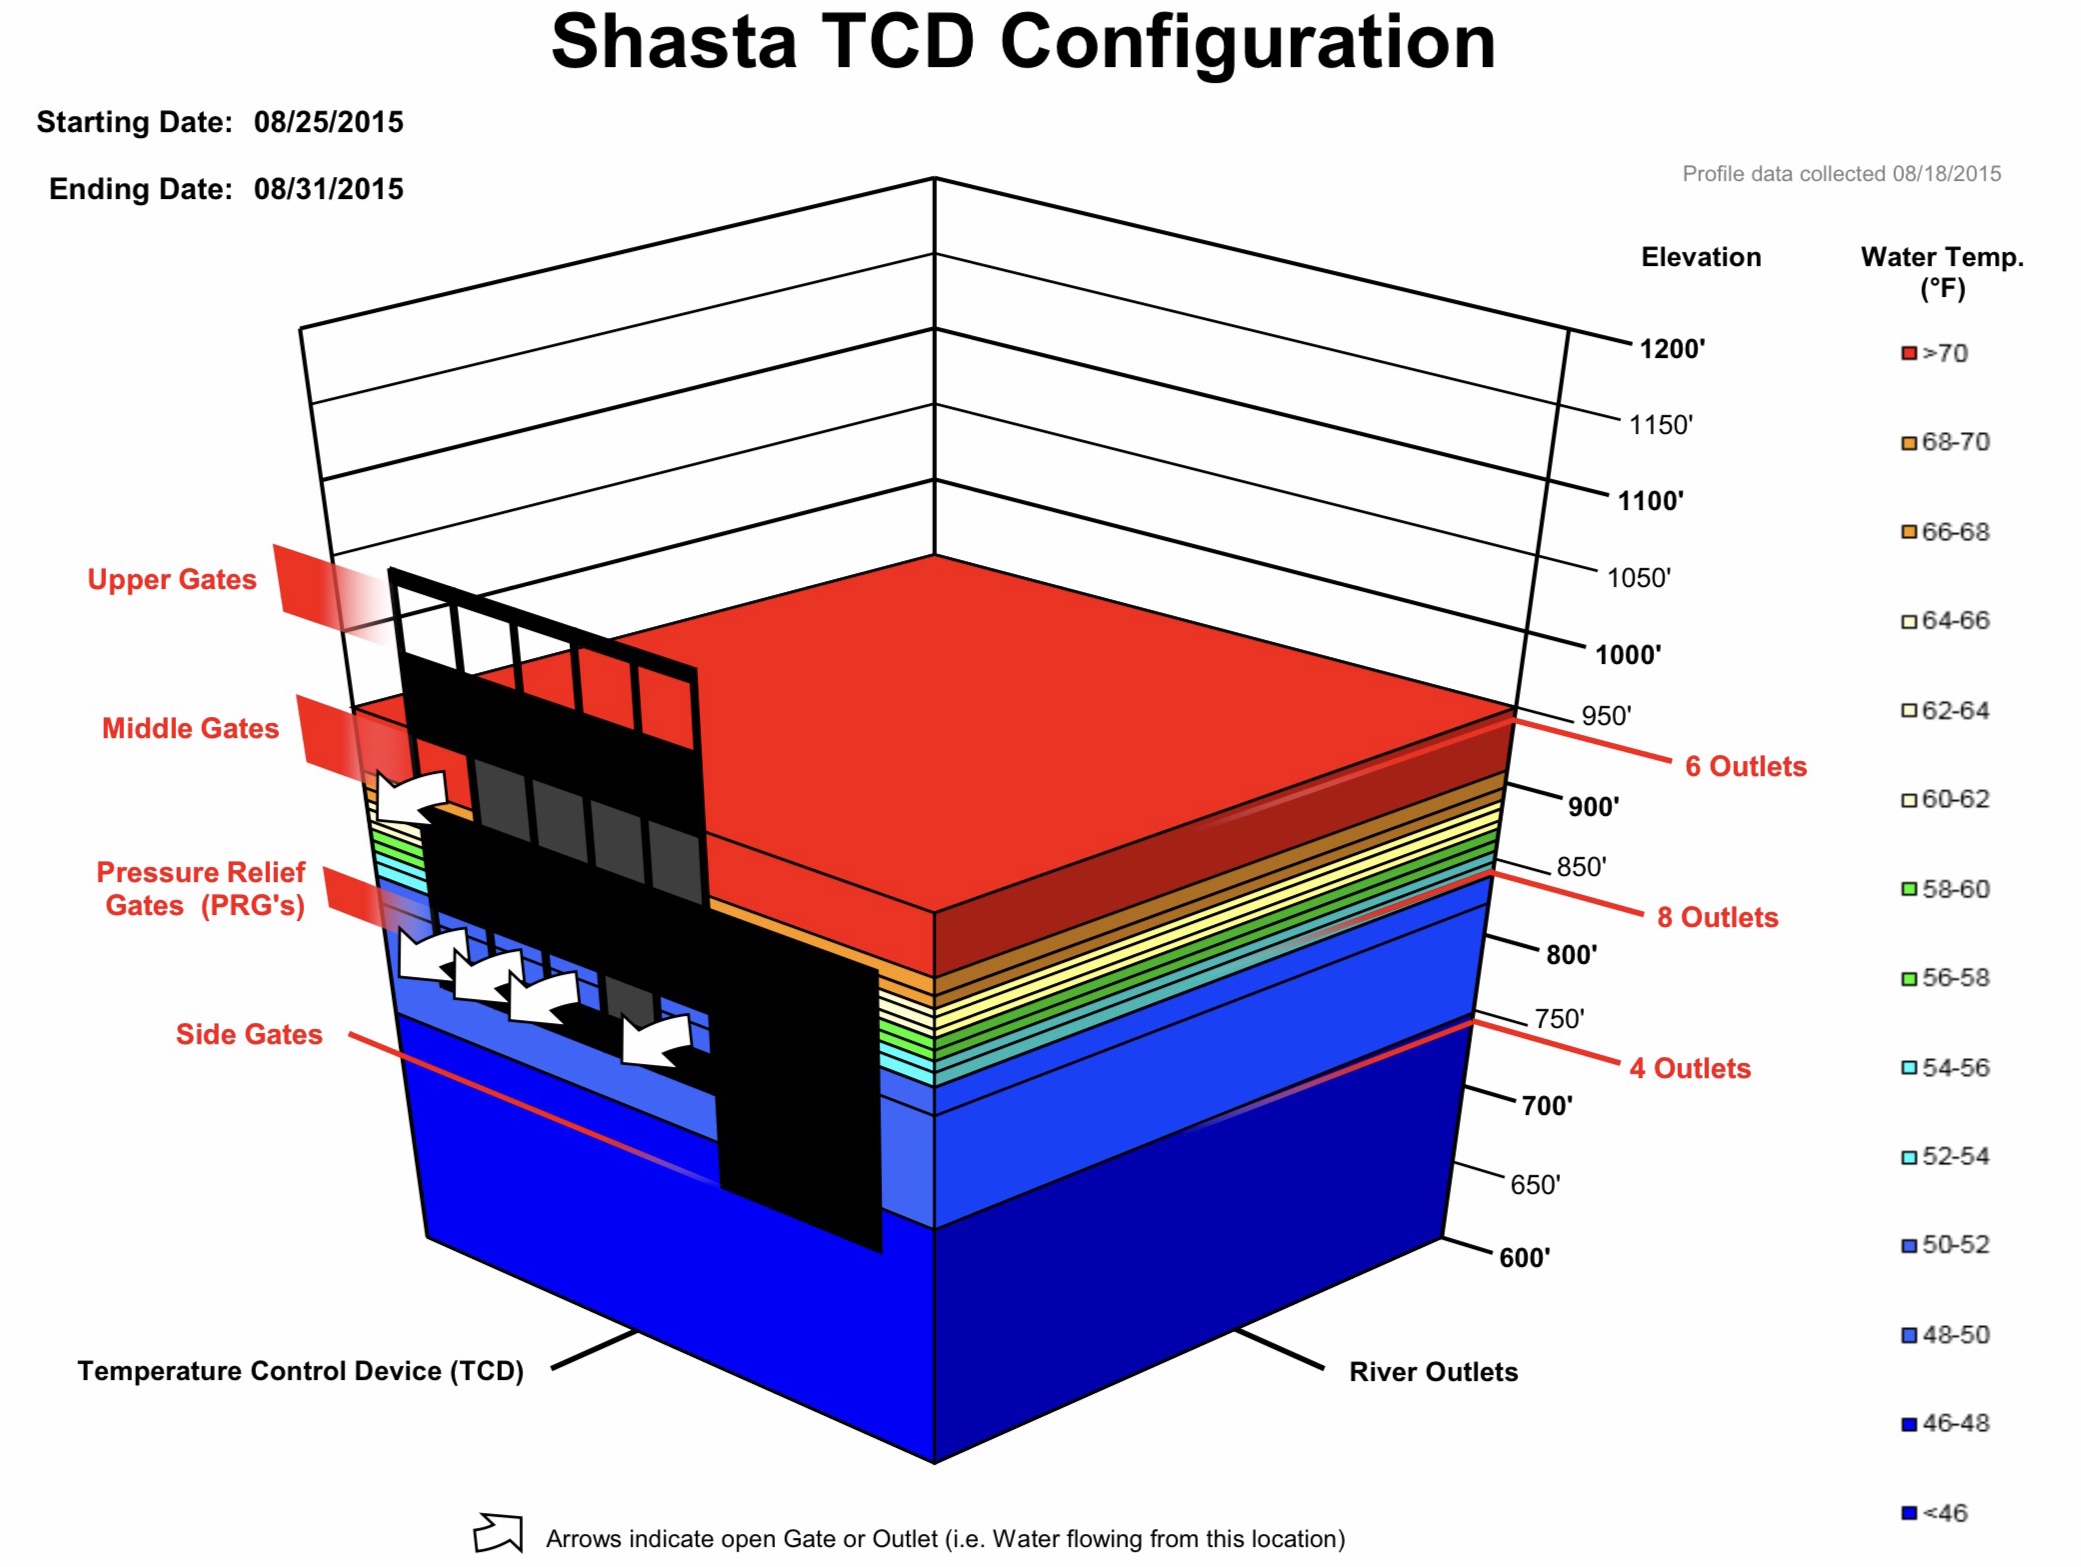
Figure 3. Shasta reservoir water temperature profile and TCD operation in August 2015. Note water level and cold water pool elevations were slightly higher in 2015 than 2014 (Figure 2).
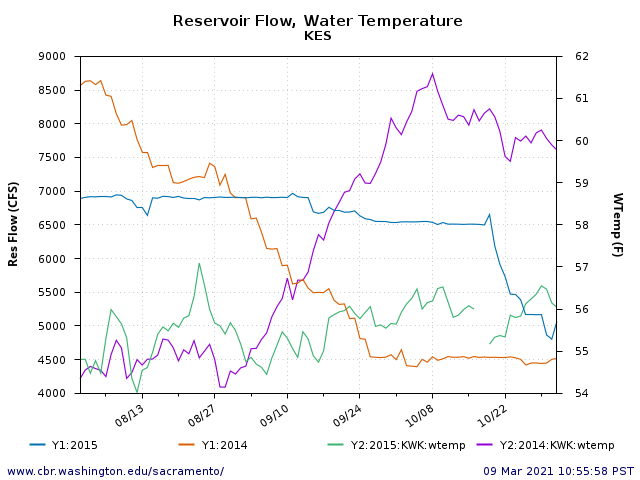
Figure 4. Water temperature and volume of releases to the lower Sacramento River Aug-Oct 2014 and 2015. Note loss of Shasta cold-water-pool access in September 2014. The higher storage releases in August in 2014 compared to 2015 made up much of the storage level differences between 2014 and 2015 shown in figures 2 and 3.
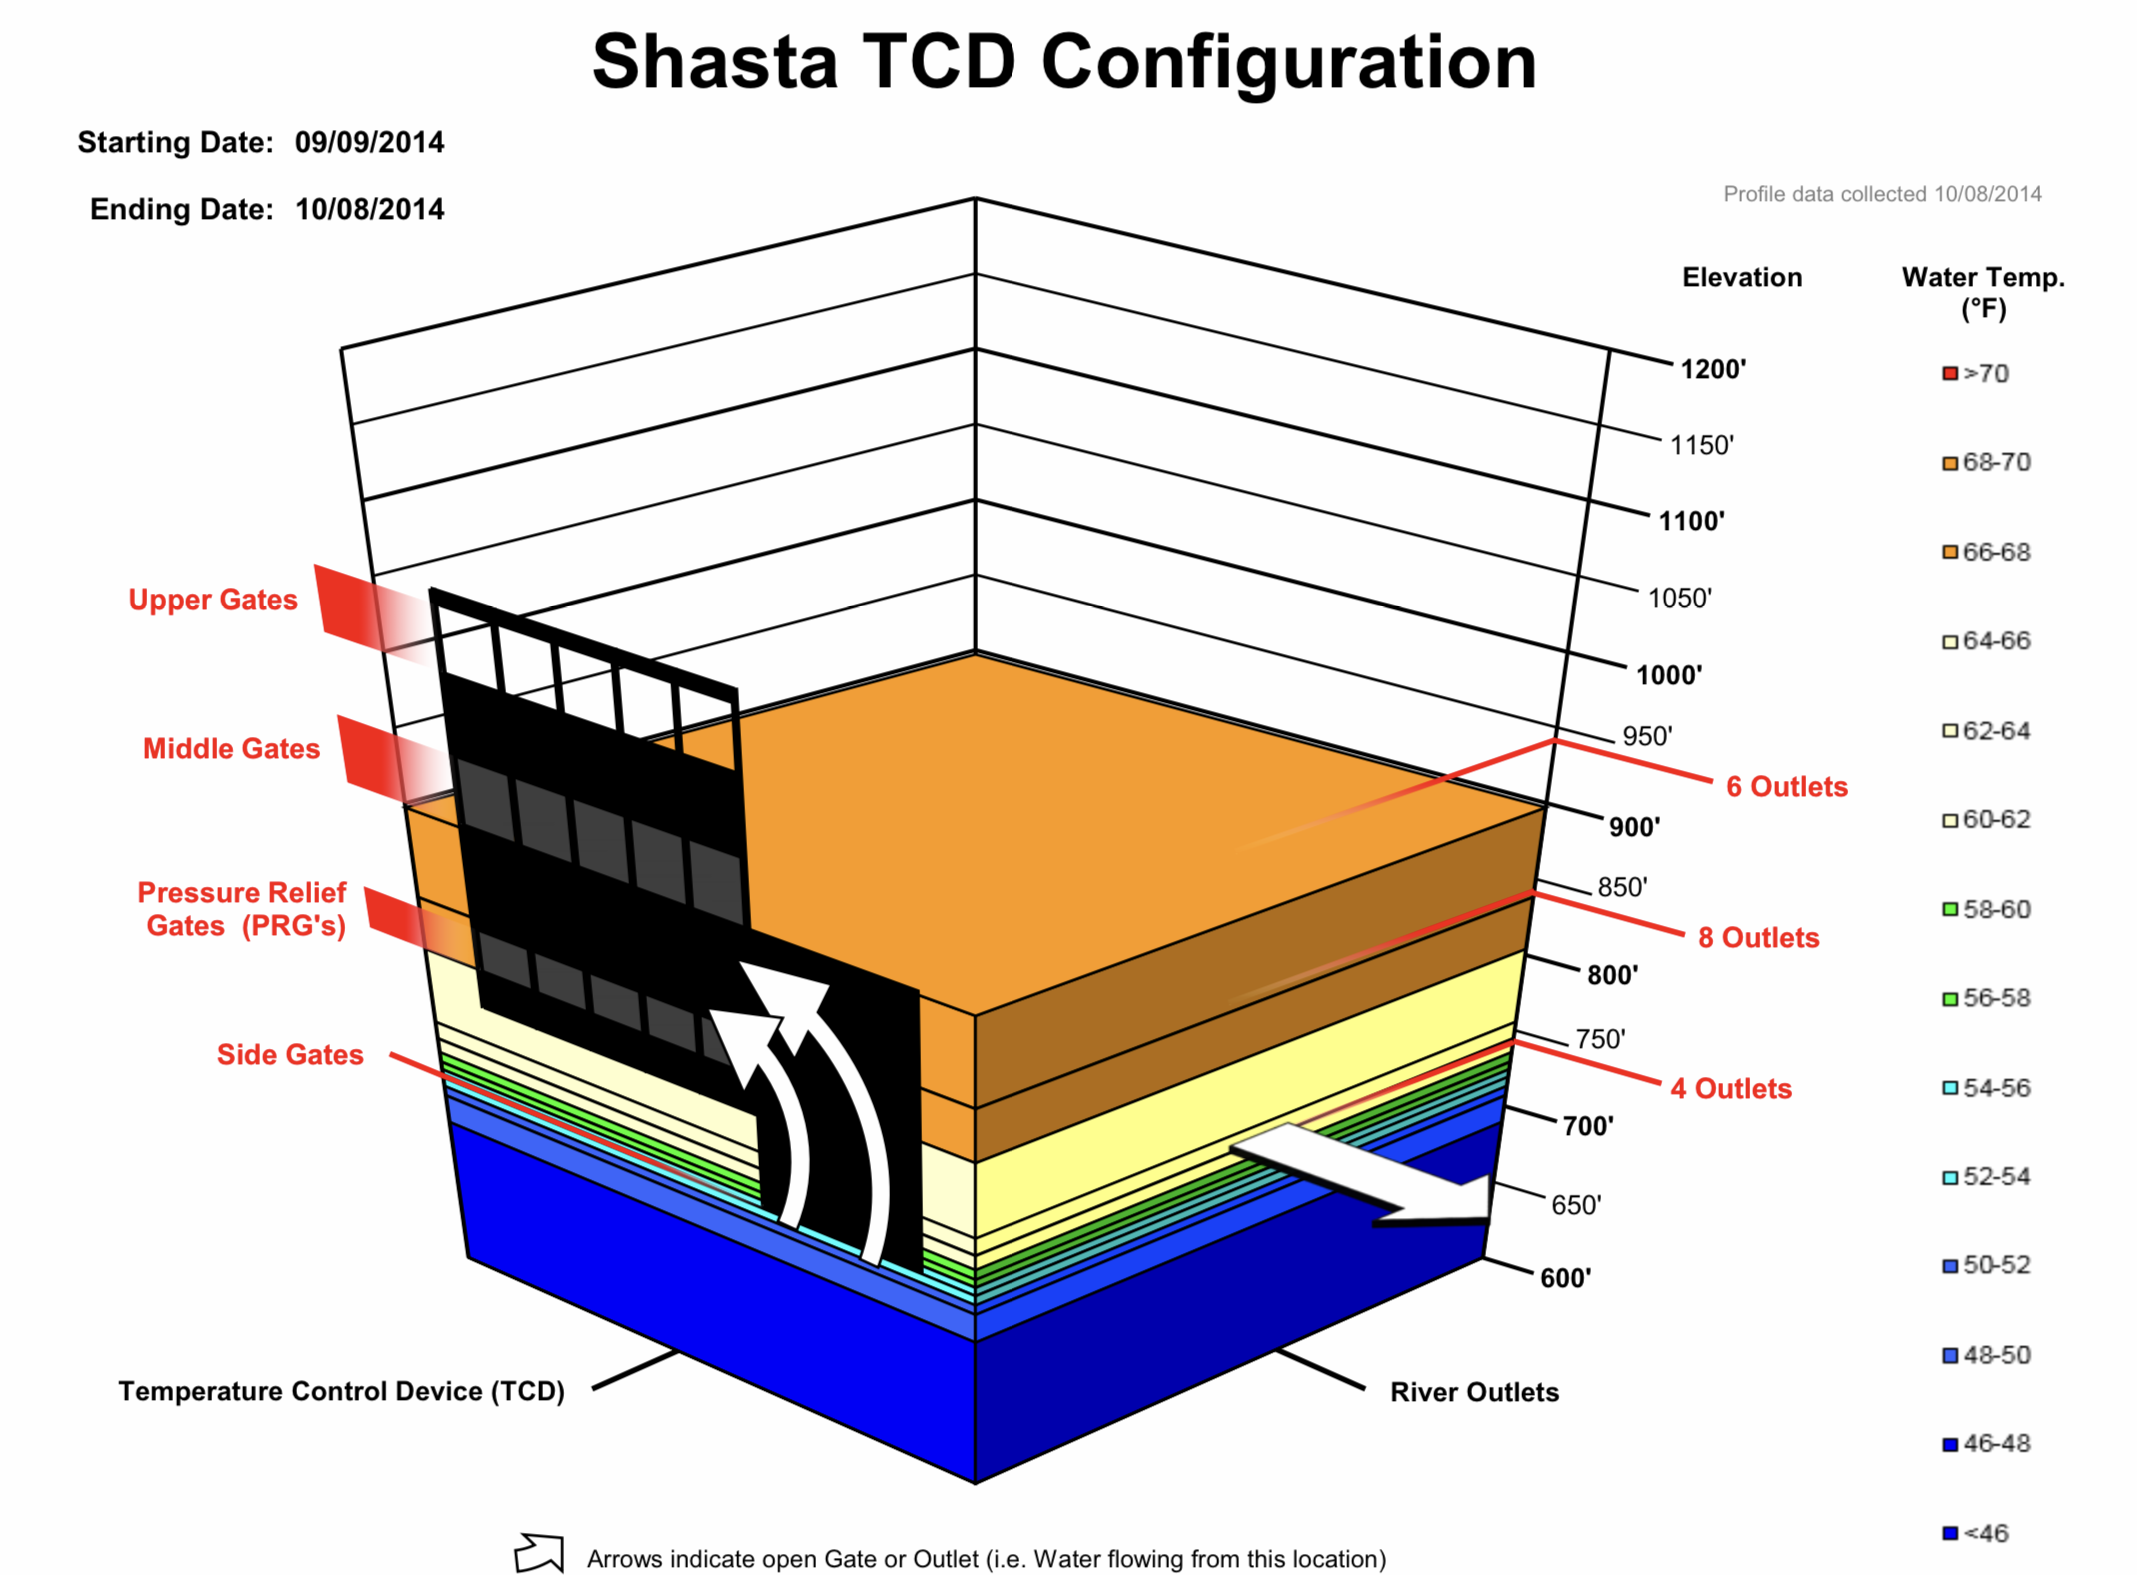
Figure 5. Water temperature profile in Shasta Reservoir and outlet tower Temperature Control Device configuration in October 2014.
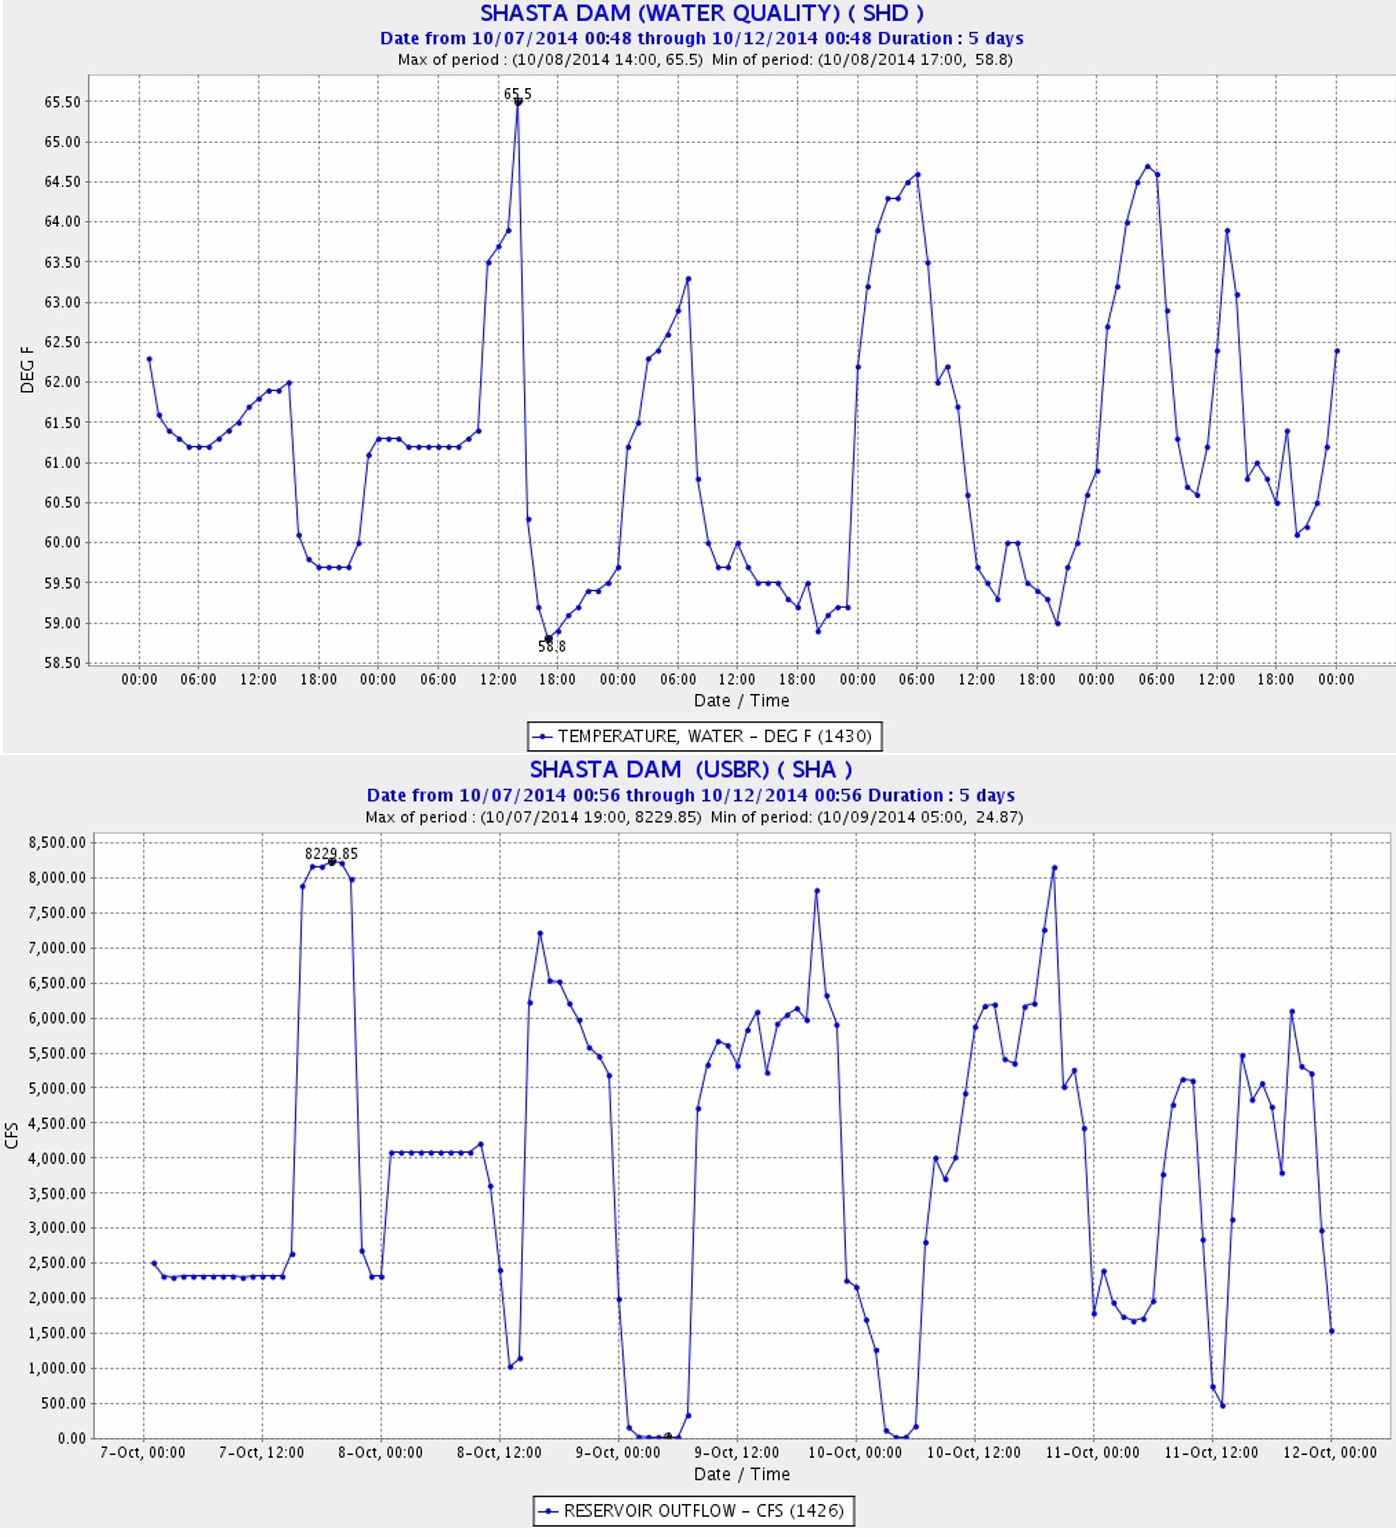
Figure 6. Hourly water temperature and release rate from Shasta Dam 10/7-10/12 2014. Note highest water temperatures were during lower non-peaking-power release periods. See Figure 5 for reservoir water temperature profile and TCD operation on 10/8/2014.
- TCD leaks at higher elevations were also detected. ↩