
Unlike most of the Central Valley native fishes including salmon and smelt, striped bass have an inherent natural advantage or resilience: they are long-lived, have ten or more spawning year-classes in any spawning year, and produce a thousand times more eggs per female. This advantage has come into play after a decade of drought: in the spring of 2016, there are optimal spawning and early rearing conditions for striped bass.
The late April 20-mm Survey results indicate a possible strong year class for stripers compared to recent years. The distribution of larvae in late April 2016 (Figure 1) is the product of moderate normal year Delta outflow with low Delta exports. The 2016 distribution is a dramatic improvement over the critically dry year 2015 (Figure 2), the drought-year 2009 (Figure 3), and also the normal year 2010 (Figure 4).
Normal water year spring Delta outflows that place the Low-Salinity-Zone westward in Suisun Bay, combined with a strong spring plankton bloom, bode well for the growth and survival of young stripers. In contrast, conditions were poor in 2015, when young stripers were confined to the Delta under low Delta outflows and low productivity, and were subject to Delta exports and diversions (Figure 2). Chances of a comeback in the fall-index (Figure 5) remain to be seen, given the lack of summer Delta protections since 1995 under the existing Delta Water Quality Control Plan. Expected high summer exports and low Delta outflows, such as those in normal water year 2010 (the record low fall-index year), may yet preclude a comeback.
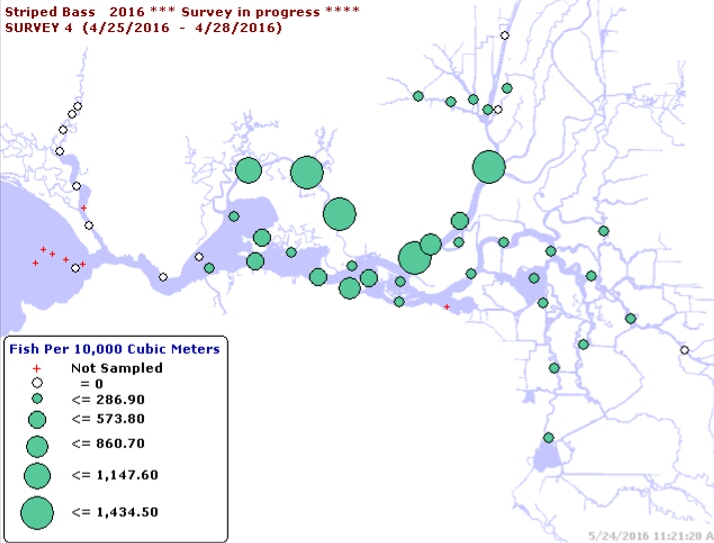
Figure 1. Striped bass larvae density distribution in 20-mm Survey #4, Apr 25-28, 2016.
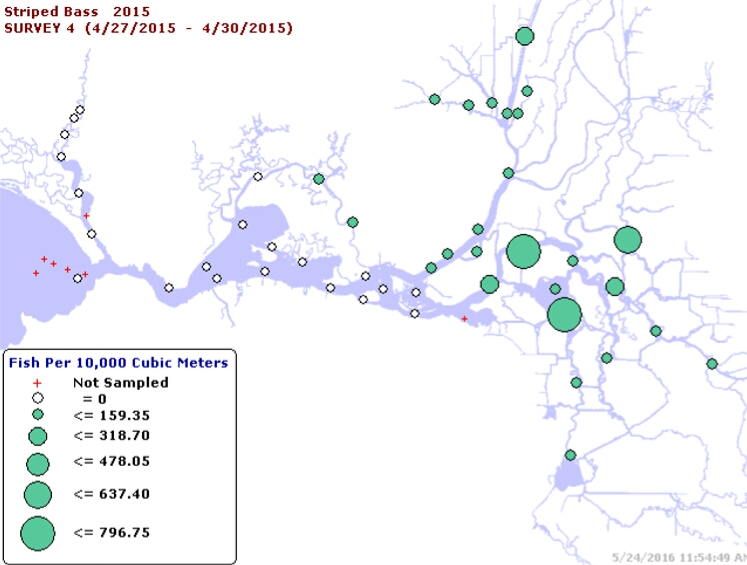
Figure 2. Striped bass larvae density distribution in 20-mm Survey #4, Apr 27-30, 2015.

Figure 3. Striped bass larvae density distribution in 20-mm Survey #4, Apr 20-24, 2009.
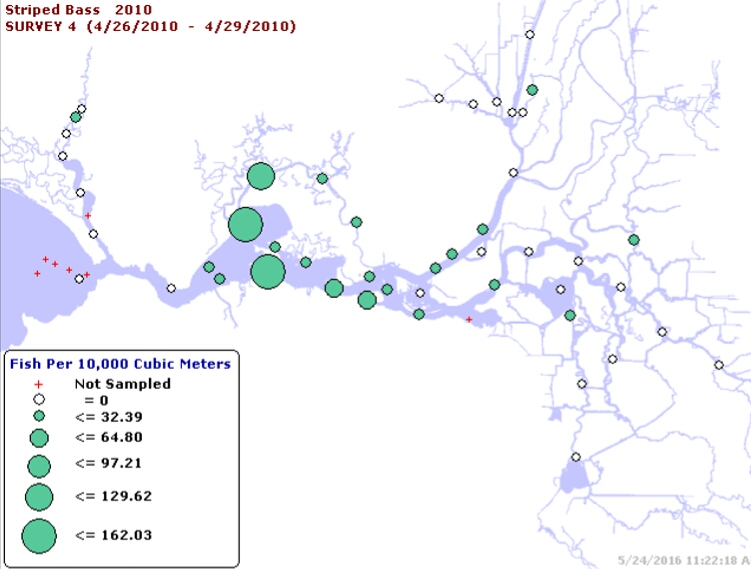
Figure 4. Striped bass larvae density distribution in 20-mm Survey #4, Apr 26-29, 2010.
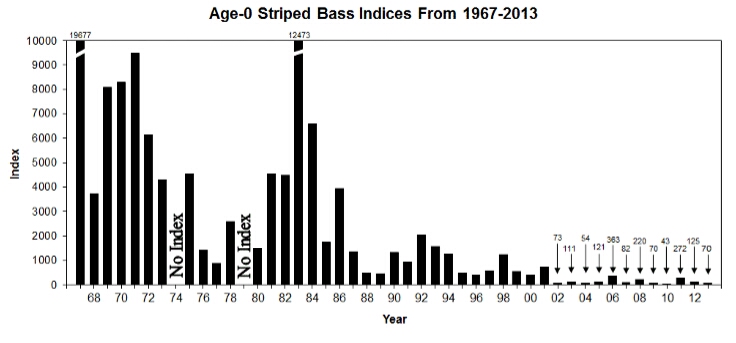
Figure 5. Striped bass fall index of young striped bass 1967-2013. Not shown are the near record low indices in 2014 and 2015 (59 and 52, respectively).