Under Weakened Delta Standards
To save water, the State Water Board’s April 6 Drought Order reduced the Delta outflow standard to 4000 cfs Net Delta Outflow Index (NDOI) and allowed the Delta salinity standard compliance point to move upstream to near Rio Vista. Normally the NDOI would be 7100 cfs, and the salinity compliance would be further downstream toward Collinsville. South Delta exports are limited in the Order to 1500 cubic feet per second (cfs).
I provide the following picture of Delta conditions during a mid-April spring tide (strong incoming tide phase).
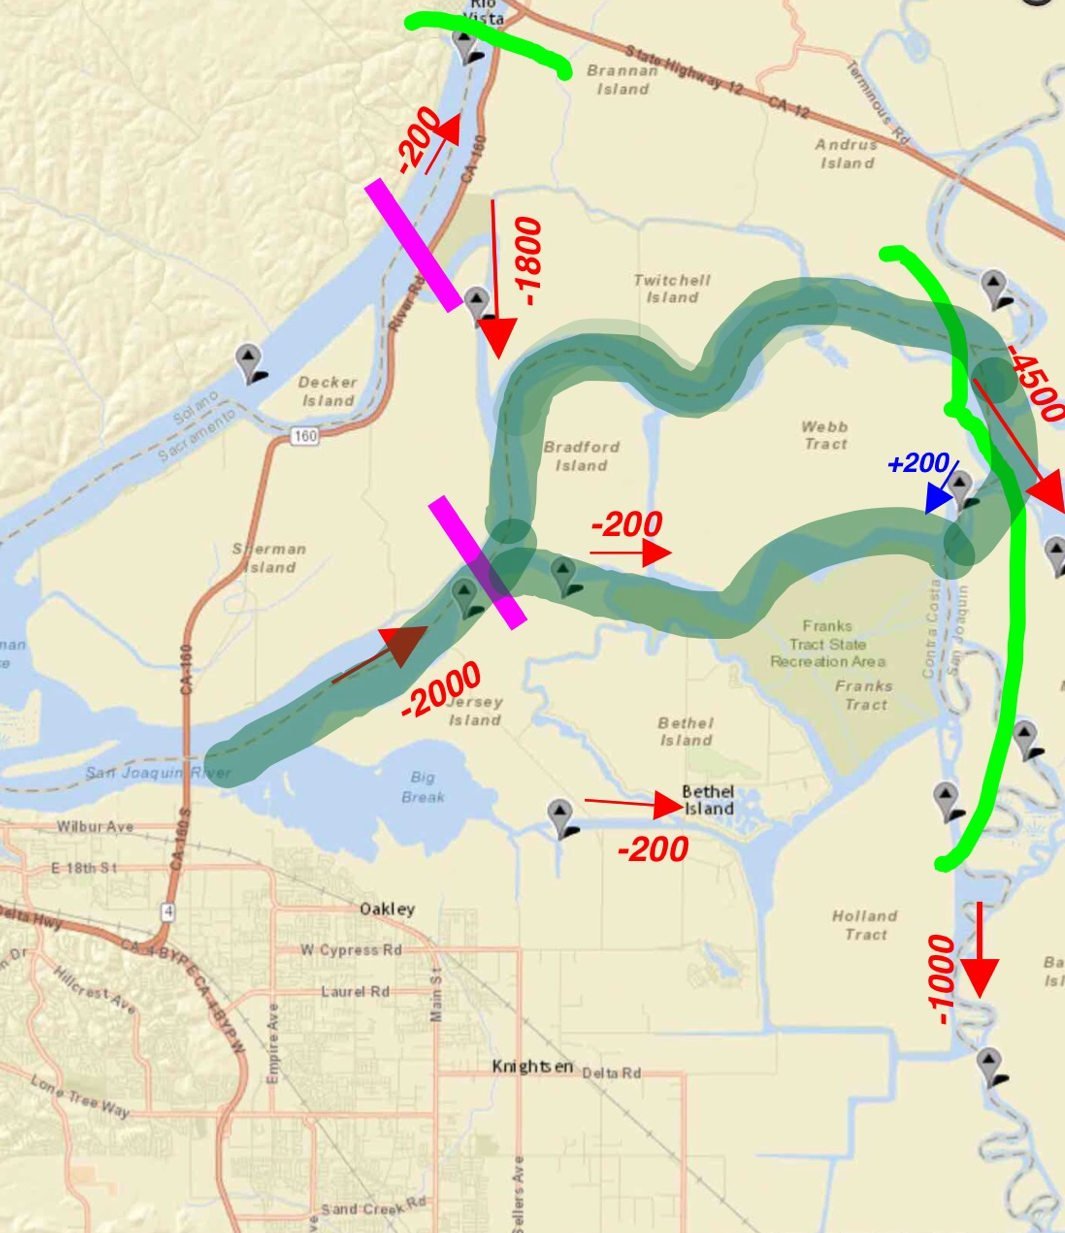
(Map source: USGS map of Delta gage locations.)
The magenta and light green lines represent, respectively, the high tide upstream salt-intrusion limit of X2 (2640 EC salinity) and upper extent of the Low Salinity Zone (LSZ) (500 EC salinity). The red and blue arrows represent the net tidally filtered (average daily) flows in cfs for their locations. The dark green region represents an area of strong plankton bloom determined from mid-April chlorophyll measurements.
There are a number of important points about this picture and what it depicts:
- The Order requires NDOI of 4000 cfs. Reclamation’s calculated NDOI on April 16 was 4966 cfs1. The USGS measured the actual Net Delta Outflow on April 16 as -3741 cfs. Outflow is negative because the high spring tide overcomes the freshwater inflows to the Delta.
- The spring tide also moves X2 and the LSZ upstream into the central area of the Delta.
- Longfin and Delta smelt young tend to concentrate in the area of X2 and upstream to the head of the LSZ (light green line). One reason for this is that it puts them in the zone of high estuary productivity (high chlorophyll and turbidity), where their potential for higher growth and survival is greater.
- Net negative flows draw smelt into the central Delta including Franks Tract, a notorious habitat of predatory fish. The smelt (and the LSZ and its plankton bloom) are also being drawn south in Old and Middle Rivers to the south Delta federal and state export pumps. Water pulled from the central Delta is replaced by water from the Sacramento River near Rio Vista, which becomes poor smelt habitat because it is fresh and warm, and has low turbidity and productivity.
In addition to restoring Delta flow and salinity requirements that were weakened by the State Board’s April 6, 2015 Order, what else should be done to reduce these negative effects on the LSZ and smelt during drought conditions?
- During spring tides, more real Delta outflow is needed. This can come in two ways: 1) more inflow (reduce upstream Valley diversions); or 2) reduced Delta exports and diversions.
- Install a False River flow barrier (on north side of Bethel Island), which would stop tidal pumping of X2 water from the Jersey Point area of the west Delta into Franks Tract in the central Delta. (Note that tidal flow would then be forced up the San Joaquin channel on north side of Bradford Island and Webb Tract.)
- Open the Delta Cross Channel (part of the day) in the north Delta to increase freshwater inflow to lower San Joaquin channel in the central Delta. Since salmon tend to migrate at night, daytime Delta Cross Channel openings draw fewer young salmon from the Sacramento River.
- Install the Head-of-Old-River flow barrier (location is south and east of the map area) to increase freshwater flow from the San Joaquin River into the central Delta.
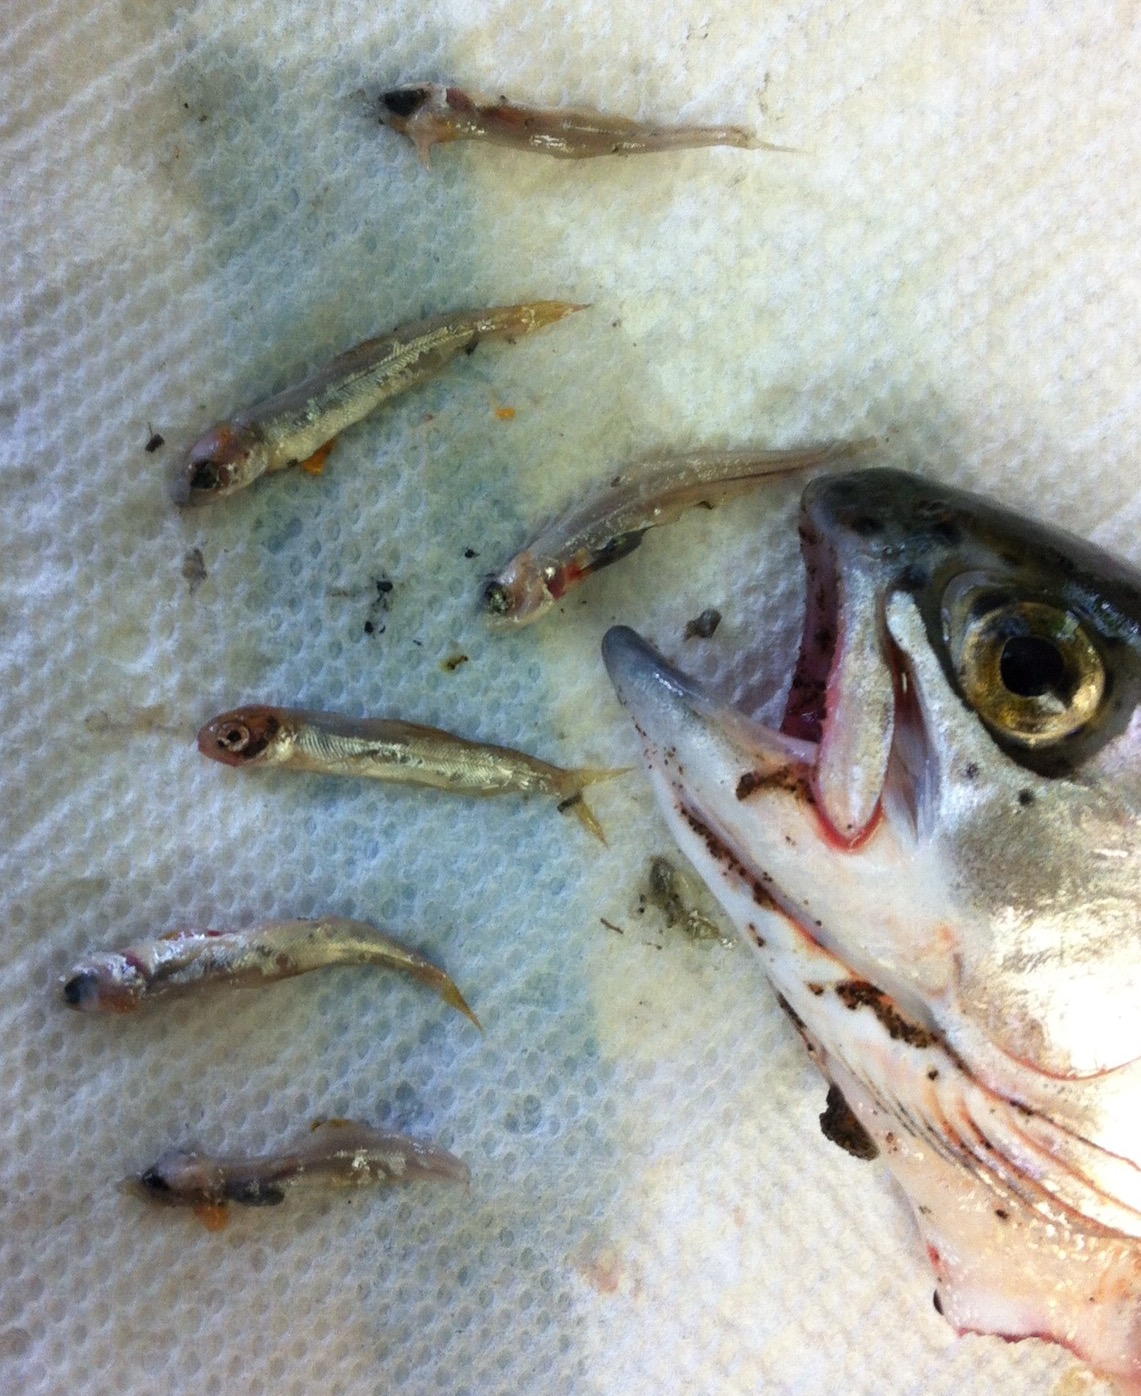
 The small numbers of Steelhead I have caught or seen caught, or observed while snorkeling, are most often hatchery fish, likely strays originating from the Feather River Hatchery. In fact, a small percentage of the resident trout above and below Daguerre are hatchery steelhead that did not migrate to the ocean (photo at right). Hatchery smolts released in the lower Feather River near the mouth of the Yuba often move up the Yuba.