Tom Cannon December, 2025
In a 9/12/25 post, I warned of poor summer conditions in the Bay for sturgeon. This came on the heels of a poor population status assessment by CDFW.
From the Department of Fish and Wildlife: “Recent results from white sturgeon monitoring surveys by the California Department of Fish and Wildlife (CDFW) suggest the white sturgeon (Acipenser transmontanus) population has continued to decline. CDFW fisheries biologists now estimate there are approximately 6,500 white sturgeon between 40-60 inches long in California — down sharply from the previous estimate of approximately 30,000 fish in that size range, based on the 2016-2021 survey average.” https://mavensnotebook.com/2025/07/10/cdfw-scientific-surveys-show-continued-decline-in-white-sturgeon-population/
Not only was the recent adult sturgeon population survey estimate down, but the products of sturgeon reproduction in 2025 were nearly non-existent, a pattern inconsistent with an above-normal water year. During the wet year 2023, white sturgeon reproduction in the Bay-Delta population was up sharply, as shown by numbers salvaged at the south Delta pumping plant fish salvage facilities (Figure 1). In contrast, sturgeon salvage numbers were very low in summer of above-normal water year 2024. In above-normal water year 2025, no sturgeon were collected in the south Delta salvage surveys.
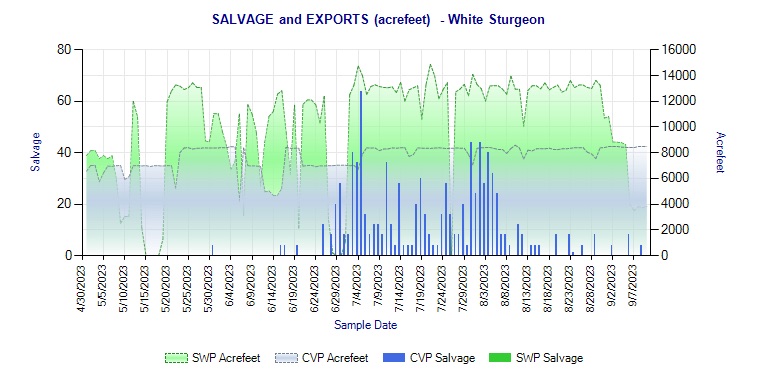
Figure 1. Number of juvenile sturgeon salvaged at south Delta state and federal pumping plant fish screens in wet year 2023. Source: https://wildlife.ca.gov/Conservation/Delta/Salvage-Monitoring
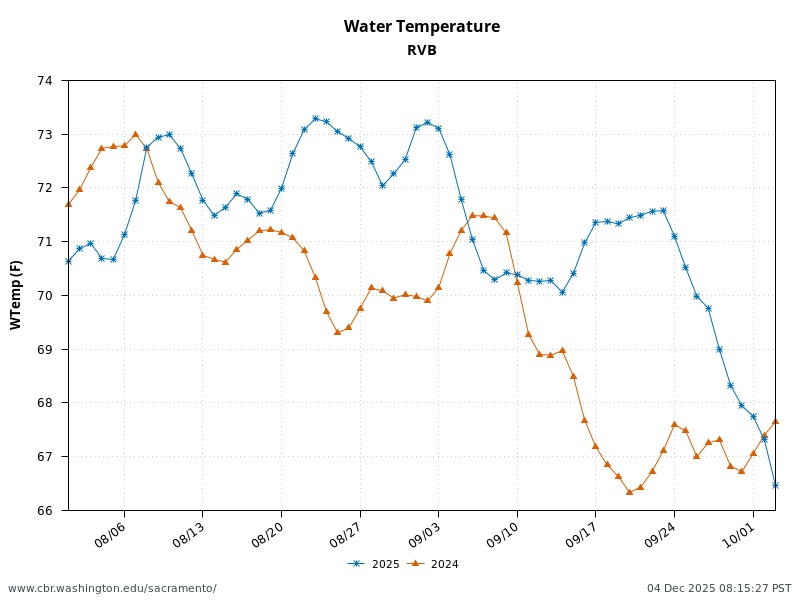
A big reason for the unsuccessful sturgeon reproduction in water years 2024 and 2025 was poor conditions in the spring spawning and early rearing reach of the middle Sacramento River (Figure 2). Water temperatures were above optimal (>65oF) and at times stressful (>68oF) or even lethal (>72oF) in 2024 and 2025. Few juvenile sturgeon survive to reach the Delta under these habitat conditions. This was one of the factors that led the State Water Board and USEPA to set 68oF as the water quality standard for the Sacramento River two decades ago. This standard is also a condition of the State Water Board water right permits for the state and federal water projects.
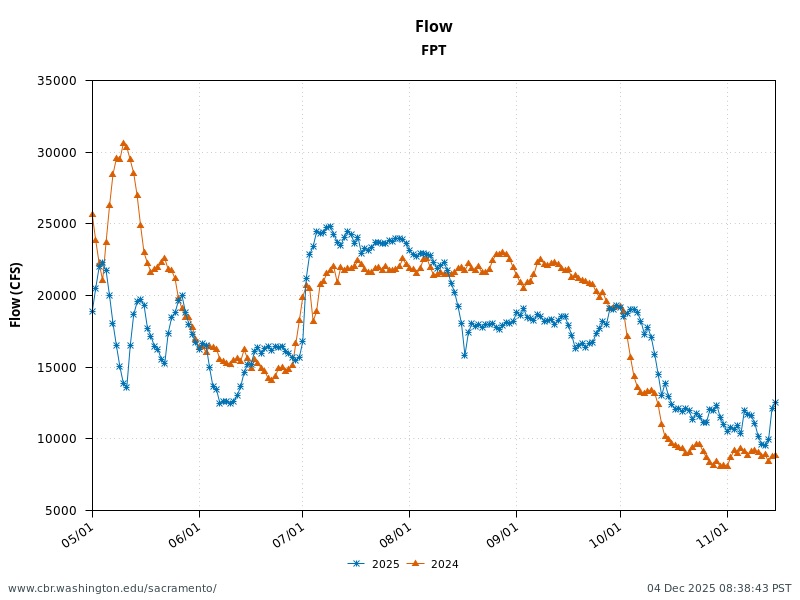
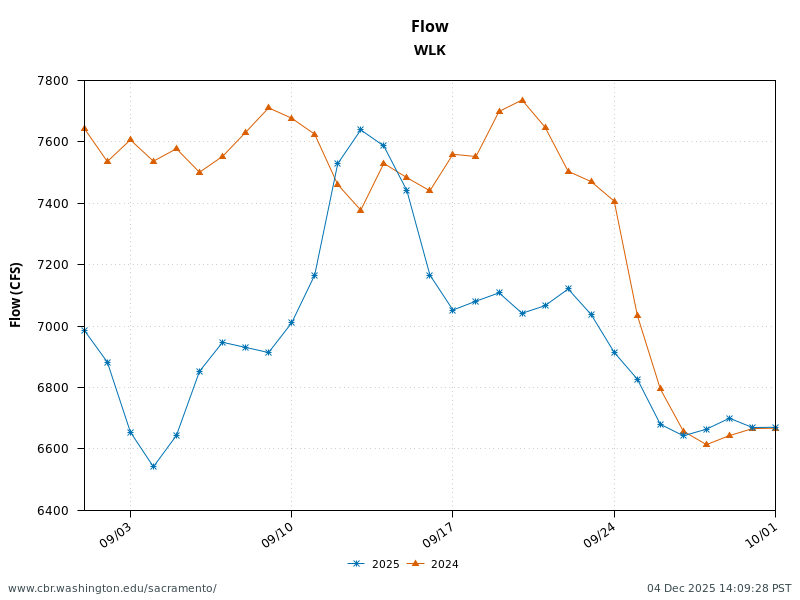
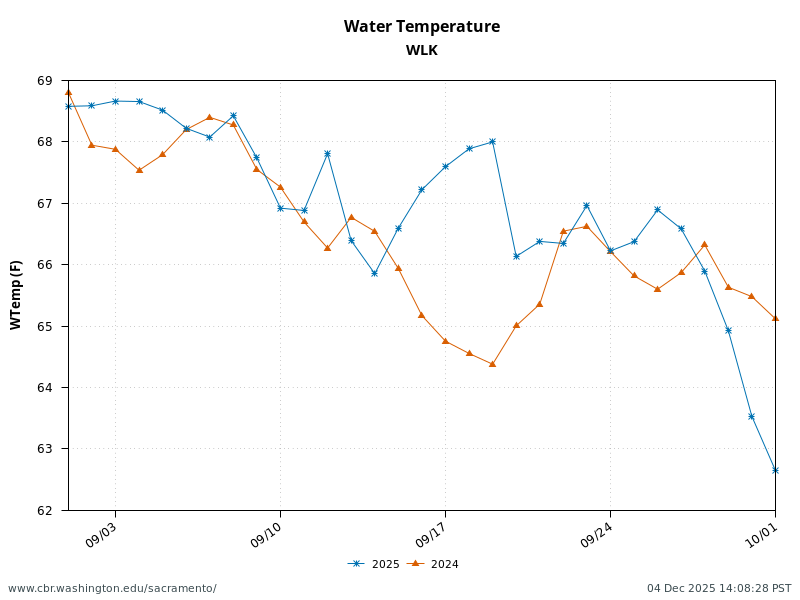
The water temperature standard could be met if river flows are maintained in the 8000-10,000 cfs range at the Wilkins Slough gage (WLK) located upstream of the mouth of the Feather River (river mile 120). (Note the water temperature benefit of higher flows in the May and June flow pulses in 2025.)
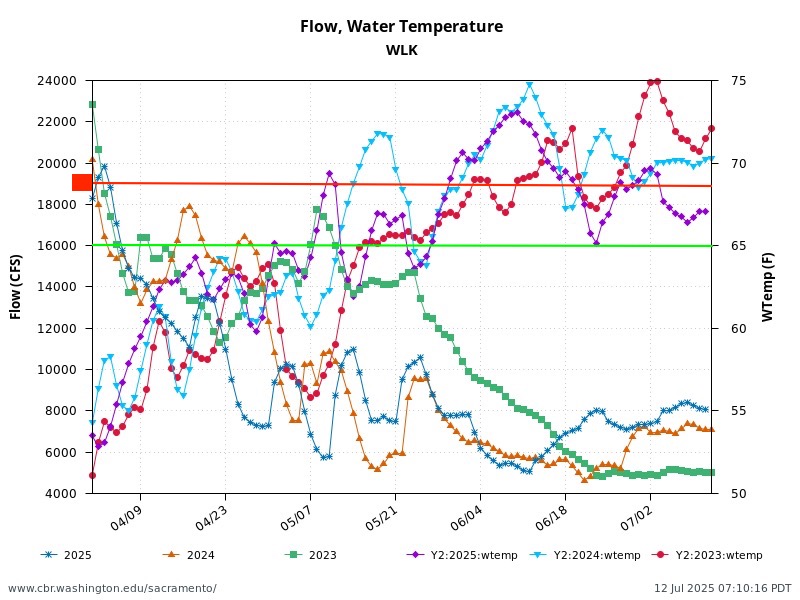
Figure 2. Lower Sacramento River flow and water temperature at Wilkins Slough gage (RM 120) Apr-Jul 2023-2025. Stress on egg and larval sturgeon occurs above 65ºF, whereas mortality begins at 70-72ºF.
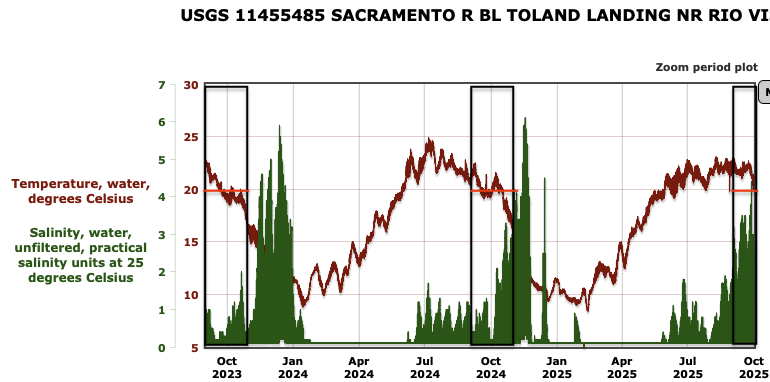
The residual adult sturgeon population within their Bay summer habitat also experienced unfavorable elevated temperature conditions (>20ºC, 68ºF; Figure 3).
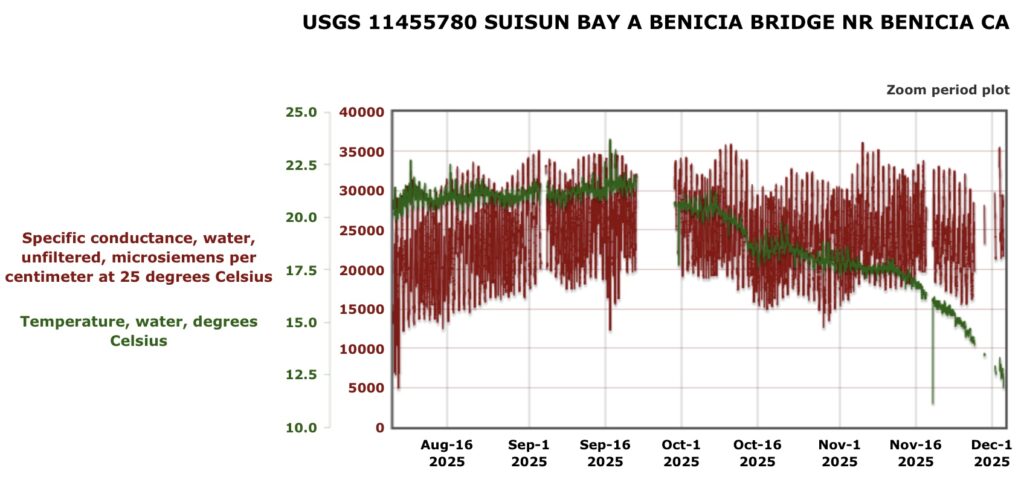
Figure 3. Water temperature and salinity in Suisun Bay at the Benecia Bridge gage, Aug-Nov 2025. Water temperature spike in mid-September occurred with Delta draining in super moon cycle and low Delta outflow (without Fall X2 Action).
For further detailed discussion of the status of sturgeon in the Central Valley see: https://calsport.org/fisheriesblog/?cat=20 .