
When I last updated the status of the mainstem Sacramento River fall-run salmon below Shasta in a July 2019 post, I expected 2019 in-river escapement to improve from the 2017 record low run (Figure 1). The record low 2017 run had been the consequence of extreme drought conditions during 2015, the third year of a major drought. In contrast, the 2019 run was largely the progeny of water year 2017, a wet year with good spawning, rearing, and migrating conditions for the 2016 salmon brood year. A potential negative ingredient to the 2019 escapement was the poor number of spawners returning in the fall of 2016 that spawned brood year 2016 (Figure 2). Likewise, 2020 escapement ingredients included the record low number of spawners in 2017, as well as poor rearing and migrating conditions in winter-spring of below-normal water year 2018.
In an April 2017 post, I presented the status of the overall fall-run salmon for the Sacramento River basin that included escapement to the mainstem, tributaries, and hatcheries. Updates of those numbers are shown in Figure 3. The total river escapement, like the upper Sacramento in-river escapement, was depressed from 2015 through 2018. Escapement in 2019 improved, but it declined again in 2020. The 2019 and 2020 Sacramento salmon runs were improved over the 2015-2018 drought-influenced runs, but were lower that returns from other wetter years, because their parental spawner numbers were depressed in 2016 and 2017 (Figure 4). Note in Figure 4 the 2019 run is shown by blue-17 to represent the wet year rearing and emigrating conditions for the 2019 run. The figure depicts the positive spawner-recruit relationship and the strong water-year type influence from two years earlier on the adult escapement (run size).
The prognosis for the 2021 and future runs is poor because of the low number of spawners in recent years and drier water year winter conditions in 2018, 2020, and 2021. Restrictions on the 2021 fishery are likely1 despite wet year 2019 conditions. Hopefully, the 2021 run will show improvement with the restricted fishery and better production from wet year 2019.
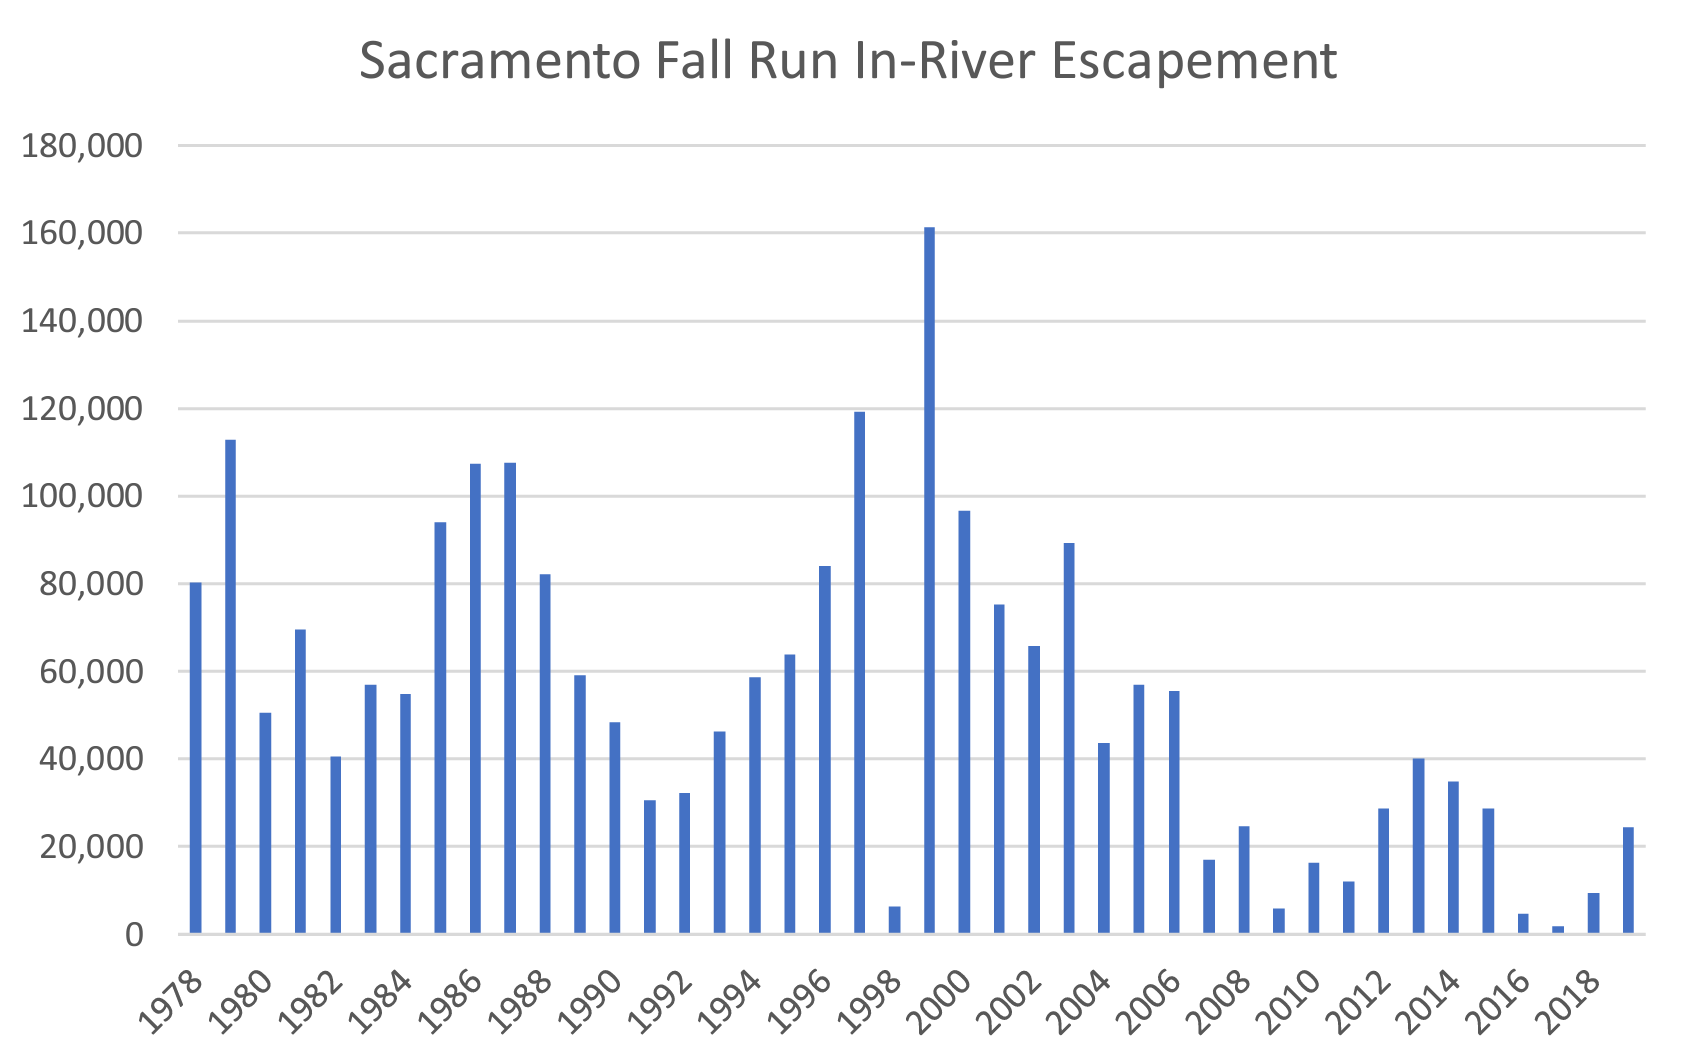
Figure 1. Fall-run Chinook salmon escapement (run size) in the mainstem in-river Sacramento River 1978-2019. Source: https://nrm.dfg.ca.gov/FileHandler.ashx?DocumentID=84381
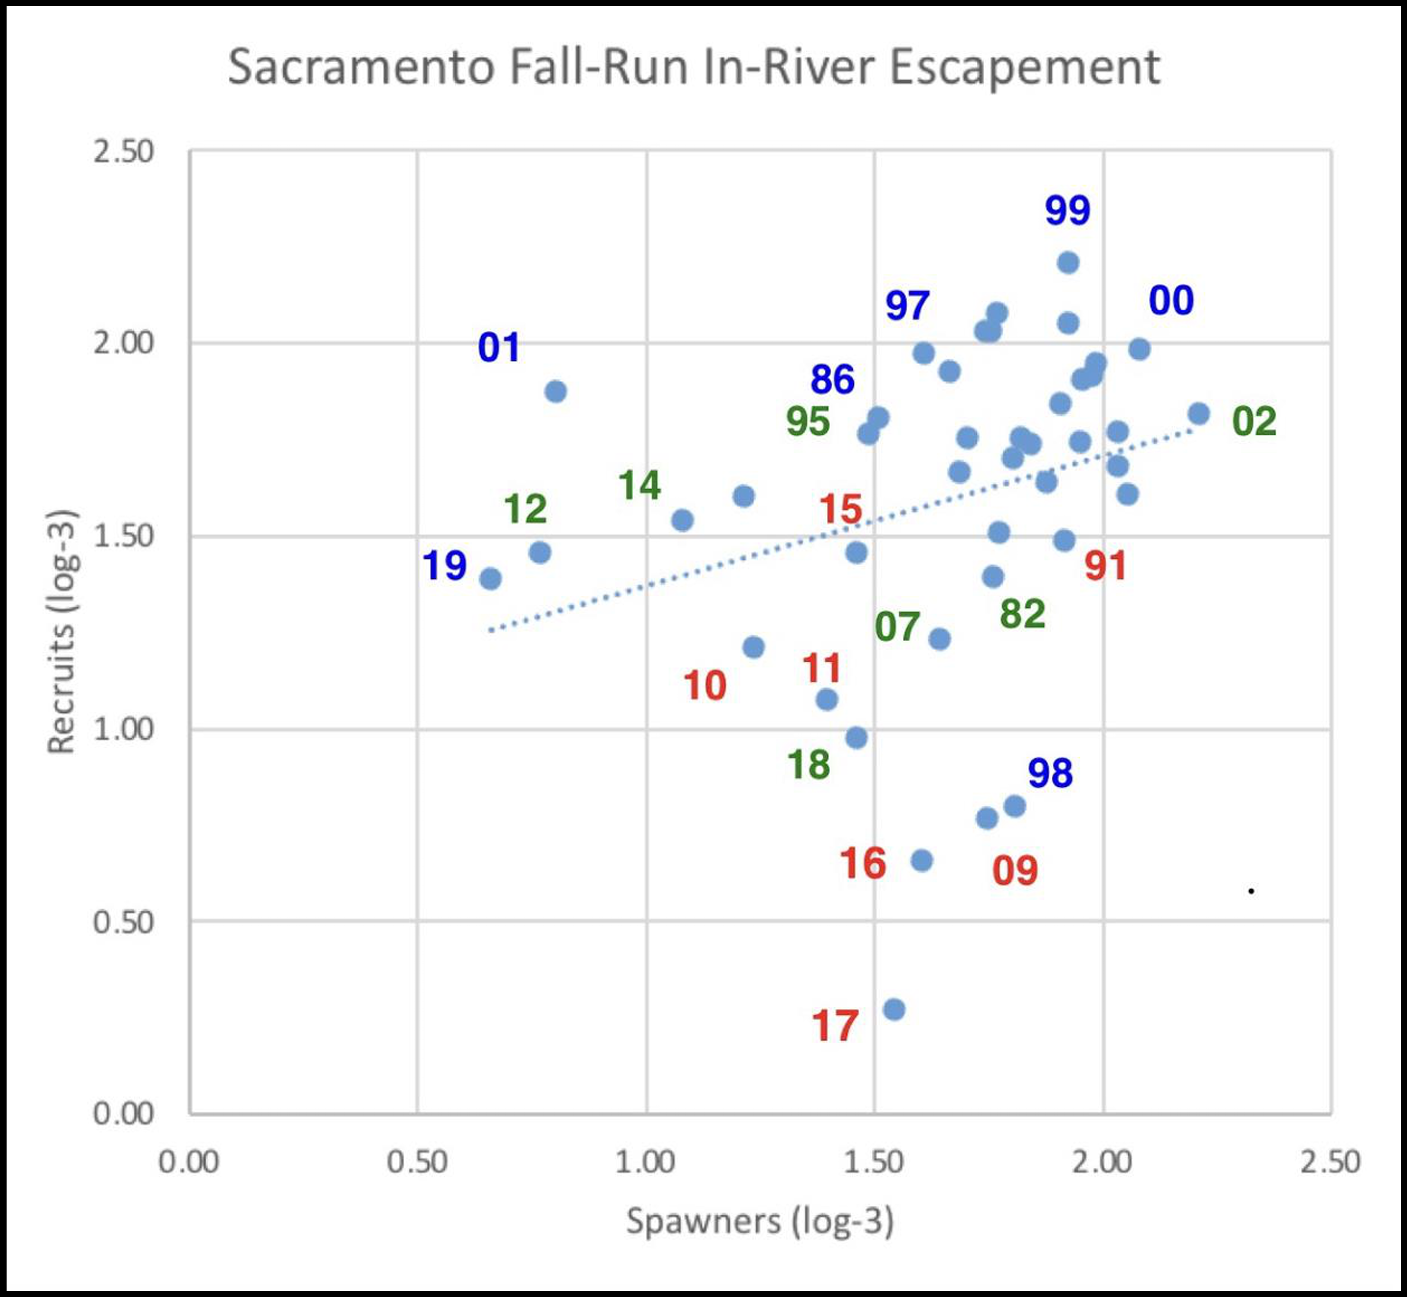
Figure 2. Spawner-Recruit relationship for upper Sacramento River mainstem fall run Chinook salmon. Number is recruitment year (escapement). Spawners are recruits from three years prior. Numbers are log minus 3 transformed. Red is for dry water year two years prior during rearing and emigration. Blue is for wet year. Green is for normal water year. For example: red 17 represents 2017 run that reared in drought year 2015, with spawners (parents) being 2014 run green number.
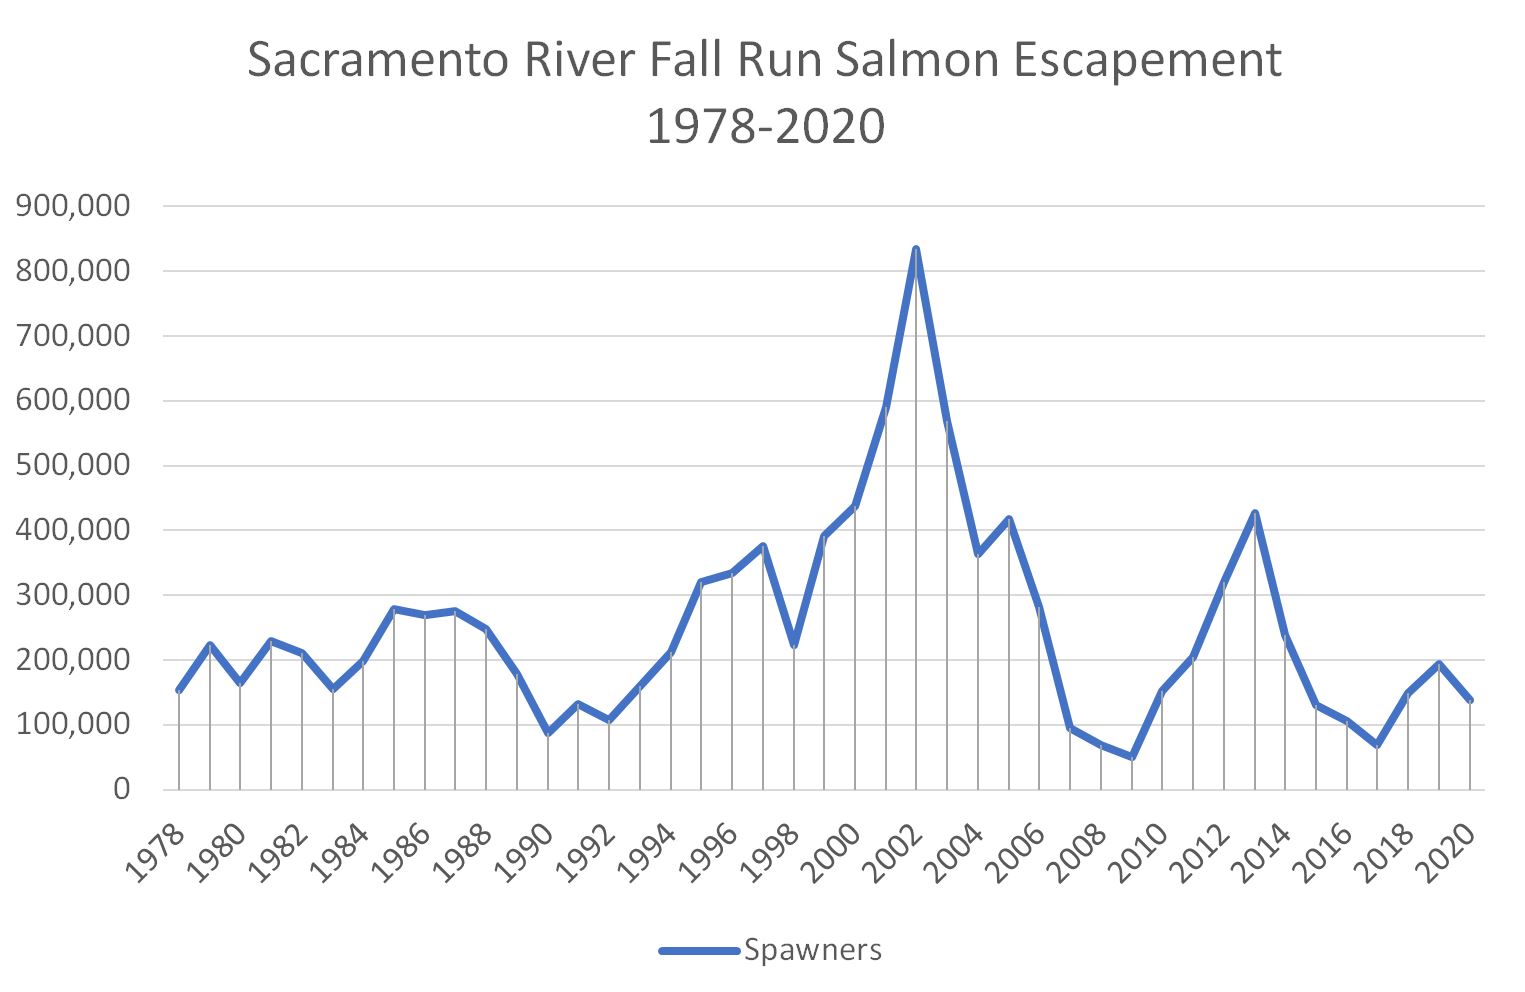
Figure 3. Fall-run Chinook salmon escapement (run size) in the main, tributaries, and hatcheries of Sacramento River watershed 1978-2020. Source: 1978-2019 https://nrm.dfg.ca.gov/FileHandler.ashx?DocumentID=84381; 2020 source: https://www.dailykos.com/stories/2021/2/25/2018149/-Poor-Sacramento-Klamath-River-Salmon-Forecast-for-2021-Suggests-Restricted-Fishing-Season?fbclid=IwAR1WE-wzw2OhwRIBfQ6bOsvm1S6bgym0Sta80VP28PgaopY6WxZ1UpWY9-Y
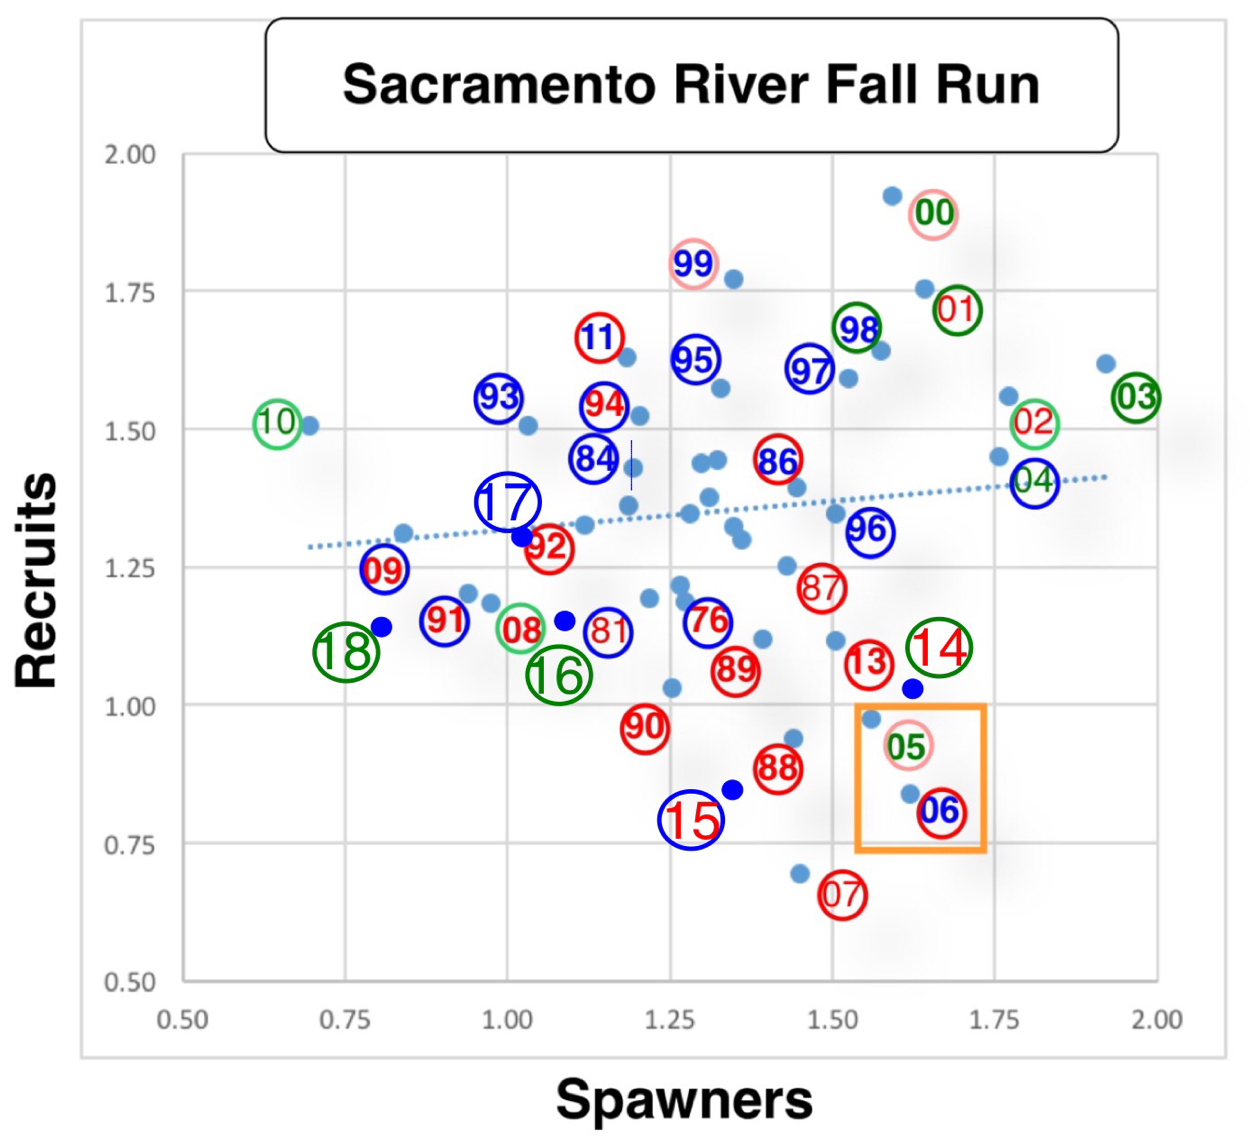
Figure 4. Sacramento River spawners versus recruits three years later from escapement estimates (Log10X – 4 transformed). Note that some variability likely occurs from a low number of 2- and 4-year-old spawners in the escapement estimates. Numbers are sum of hatchery, mainstem, and tributary estimates from CDFW GrandTab database. Number shown is rearing year (winter-spring) following fall spawning year. For example: “88” represents rearing year for 1987 spawning or brood year. These fish returned to spawn (recruits) in 1990. The red “07” represents the record low run in fall 2009. Red years are critical or dry water years. Blue years are wet water years. Green years are normal water years. Red circles represent adult return years being drier water years. Blue circles represent return years being wet water years. Green circles represent return years being normal water years. Orange square denotes outlier years influenced poor ocean conditions, floods, or hatchery management factors. Note that runs from wet years are up to ten times higher (1 log number) than the drought influenced years, particularly 87-90, 07-08, and 12-15.

