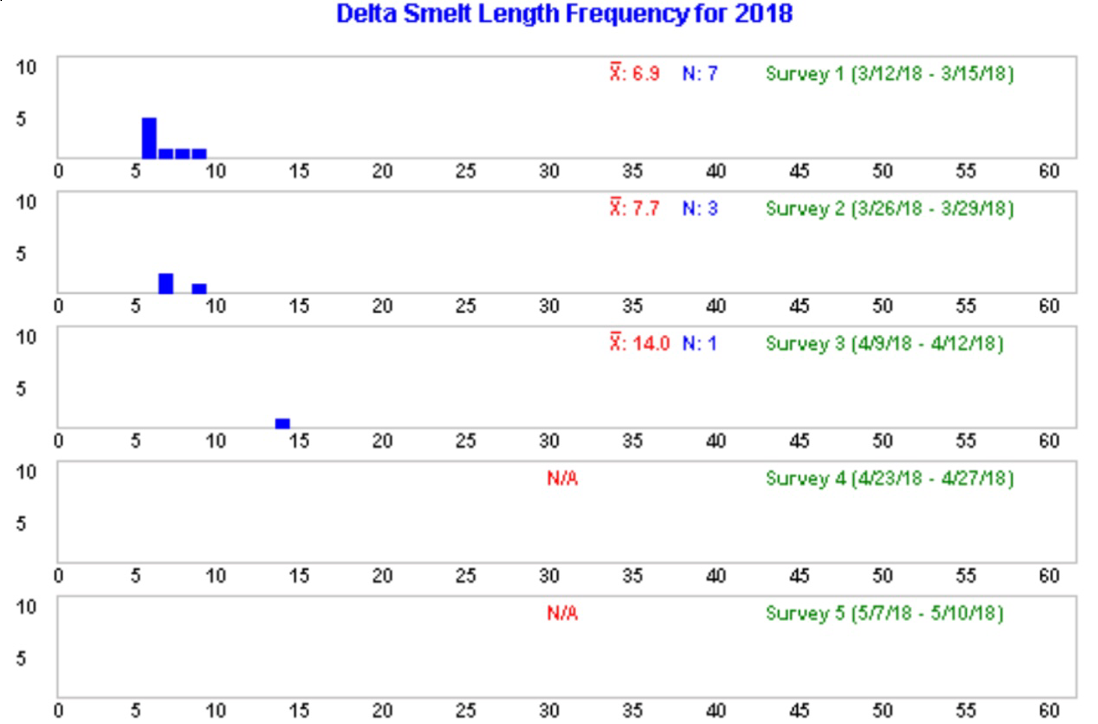
In a January update on late-fall-run salmon, I noted record low runs of late-fall-run Chinook salmon to the upper Sacramento River in 2015 and 2016. That trend continued in 2017 (Figure 1), as shown in recent data published by the California Department of Fish and Wildlife. Spawning runs from 2015-2017, the product of runs from the 2013-2015 drought, were three lowest since year 2000.
As it was for spawning run 2013, the rate of return for 2014 spawning run of tagged late-fall-run hatchery smolts was very low (Figure 2). I concluded in the prior post that low river flows and lack of flow pulses caused the poor return rate. There were flow pulses in winter 2014-15 (Figure 3). However, only the later season release group responded strongly favorably to a flow pulse (Figure 4). This suggests that later winter releases of fish from the hatchery, in combination with flow pulses, provides higher rates of returns for hatchery fish. Prescribed flow pulses from Shasta Reservoir in dry winters like 2014-15 (Figure 5) appear to improve survival of late-fall-run hatchery smolts.
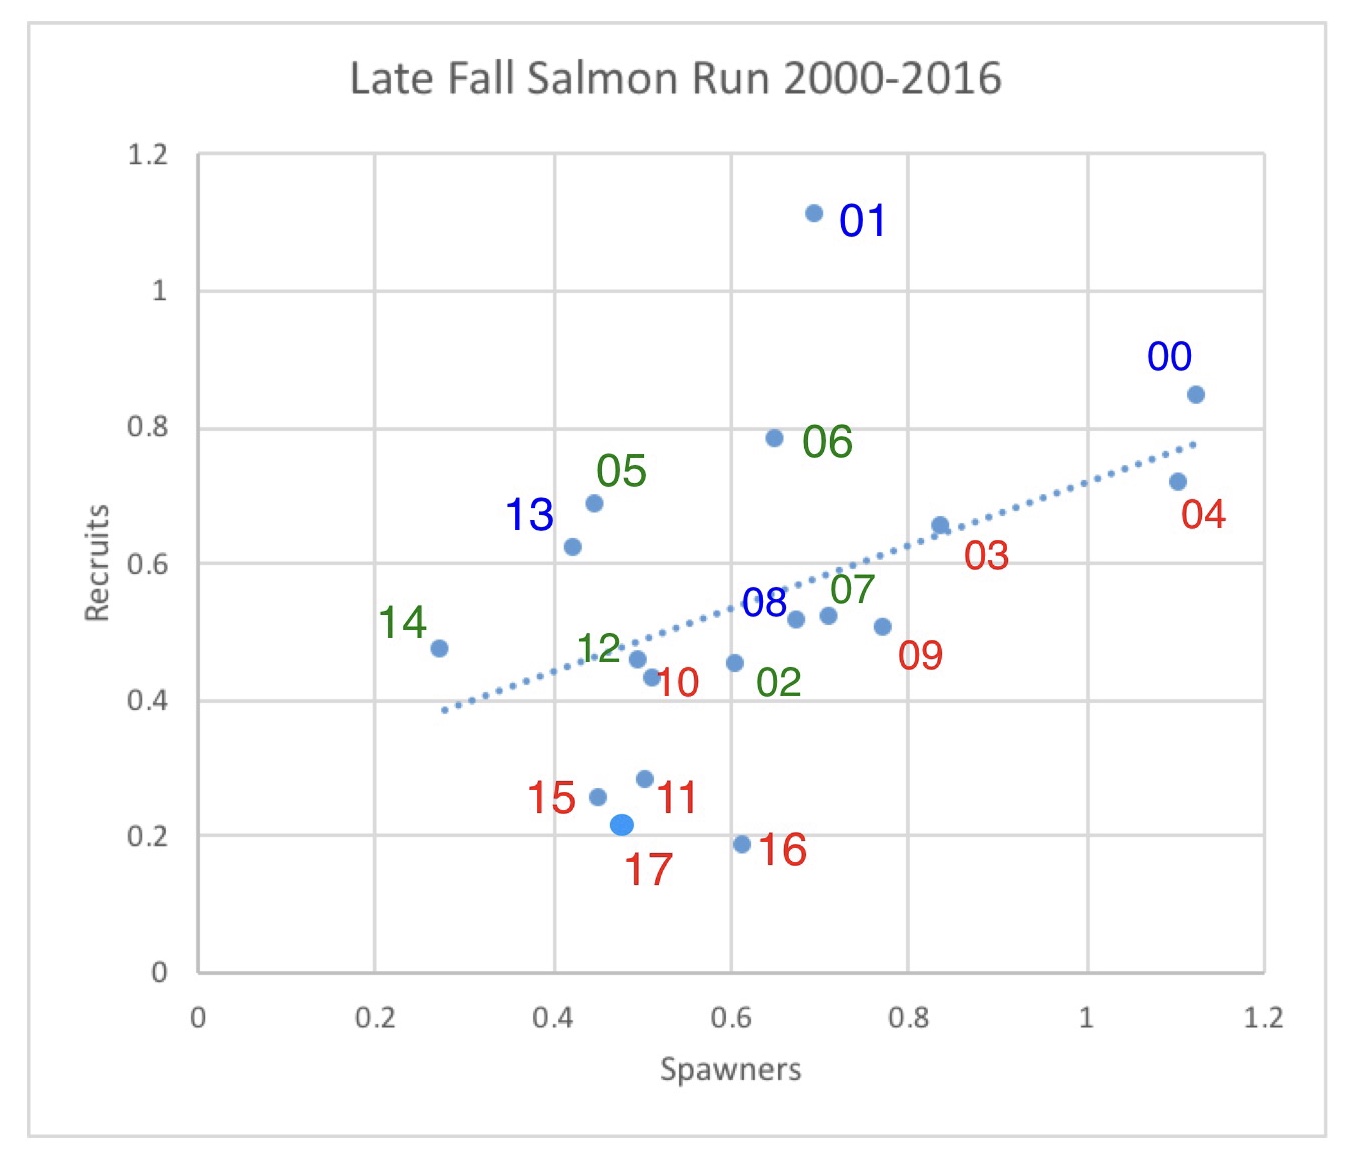
Figure 1. Spawner-recruit relationship for late-fall–run salmon. Number is log10-3.5 transformed escapement (recruits) for the fall of that year. For example, year “16” represents escapement for late fall 2016, which includes spawners from early winter 2017. Spawners represent escapement from three years earlier (brood year). In the example, spawners for year 16 were the progeny of escapement in 2013. Colors represent winter rearing condition two years earlier. In the example, red “16” represents dry winter 2014. Green represents normal years two years earlier. Blue represents wet years two years earlier.
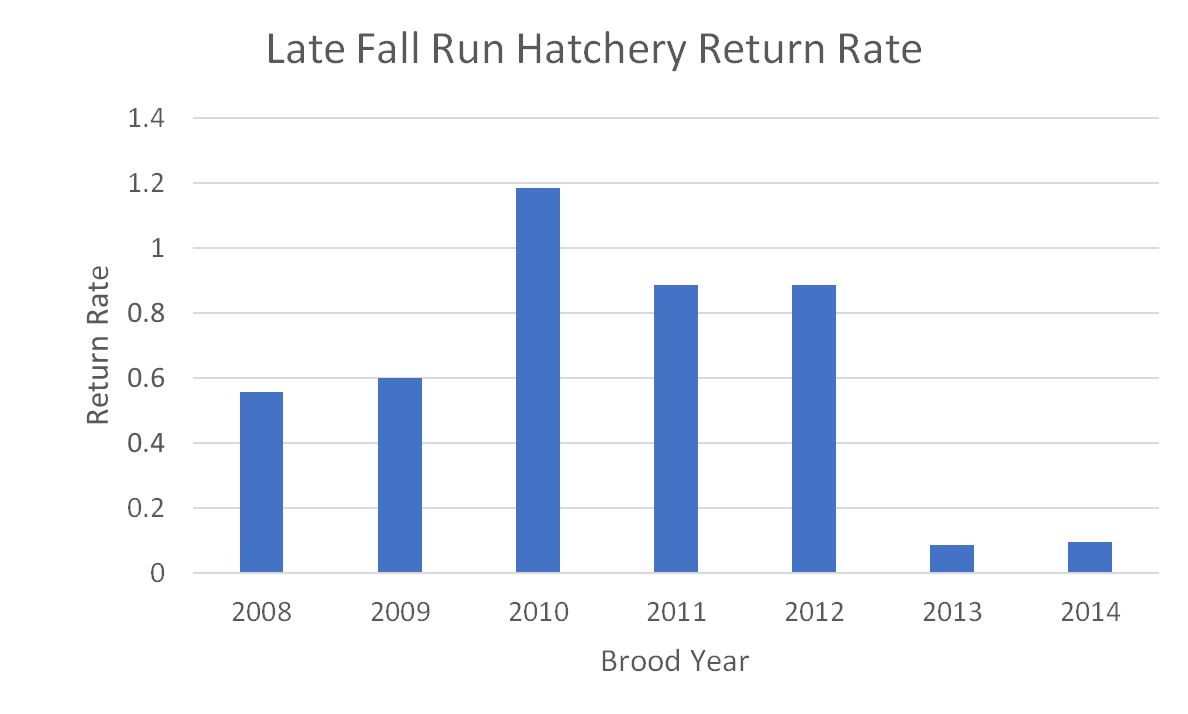
Figure 2. Hatchery smolt survival for brood years 2008-2013 based on coded-wire-tag returns.
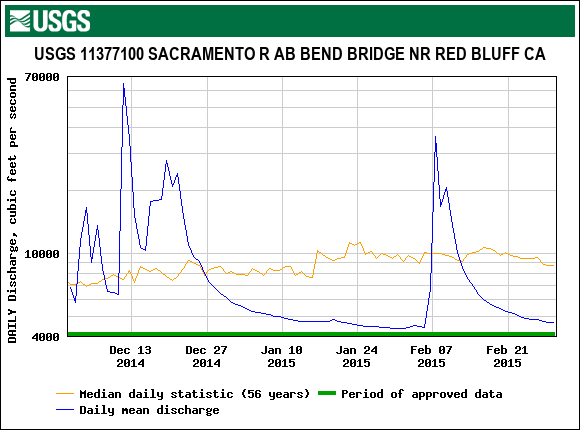
Figure 3. Winter 2014-15 Sacramento River flows downstream of Battle Creek along with 50-yr average.
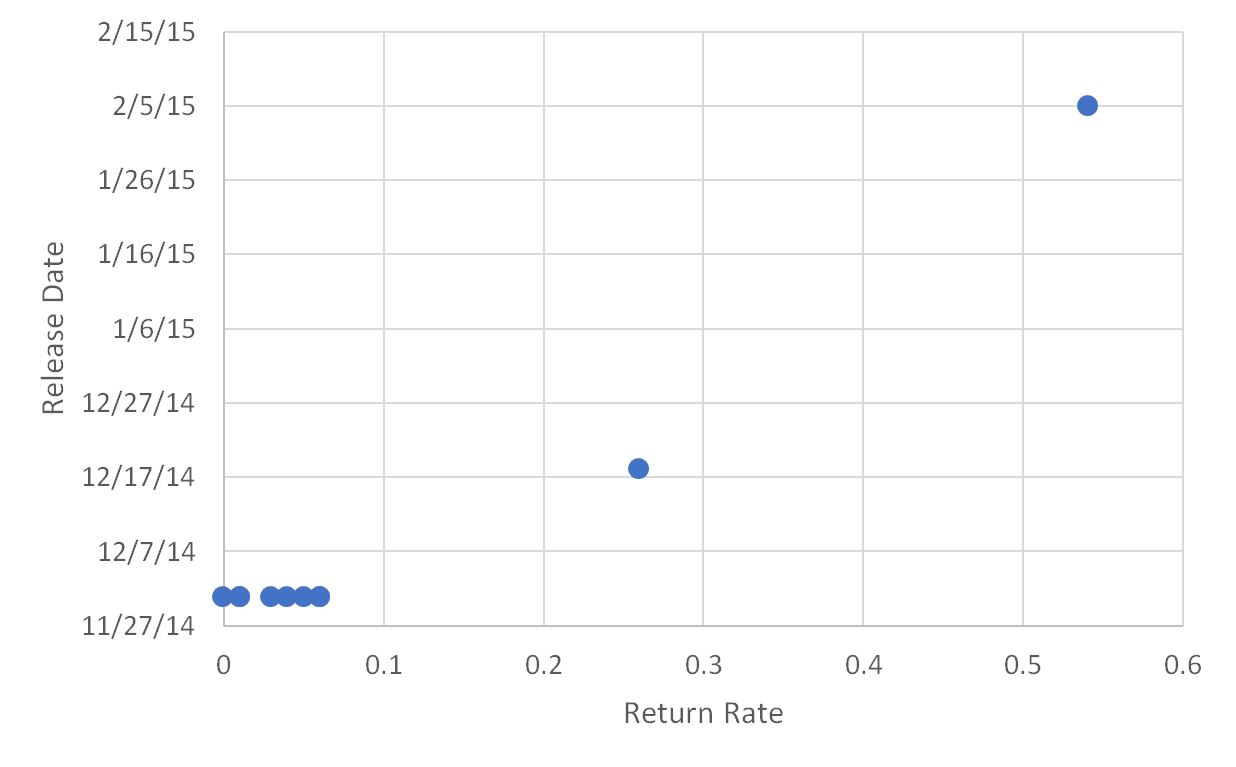
Figure 4. Return rates by date of release for late-fall-run tagged hatchery smolt release groups from winter 2014-15. Source: https://www.rmpc.org
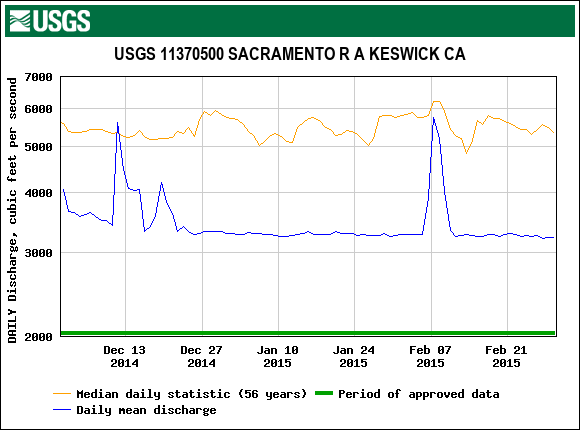
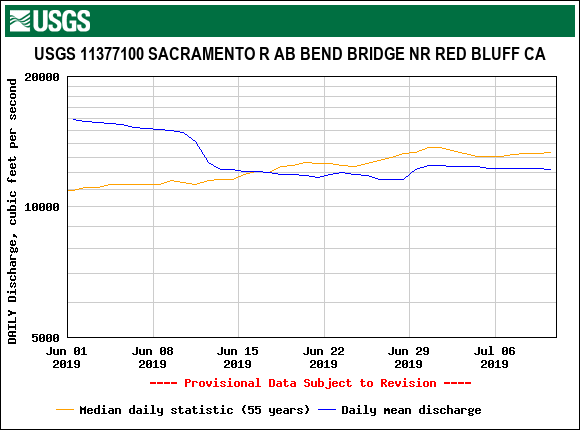
Figure 5. Winter 2014-15 Sacramento River flows downstream of Shasta Dam along with 50-yr average. Note short term reservoir water releases in December and February prescribed to support upper river hatchery smolt outmigration.