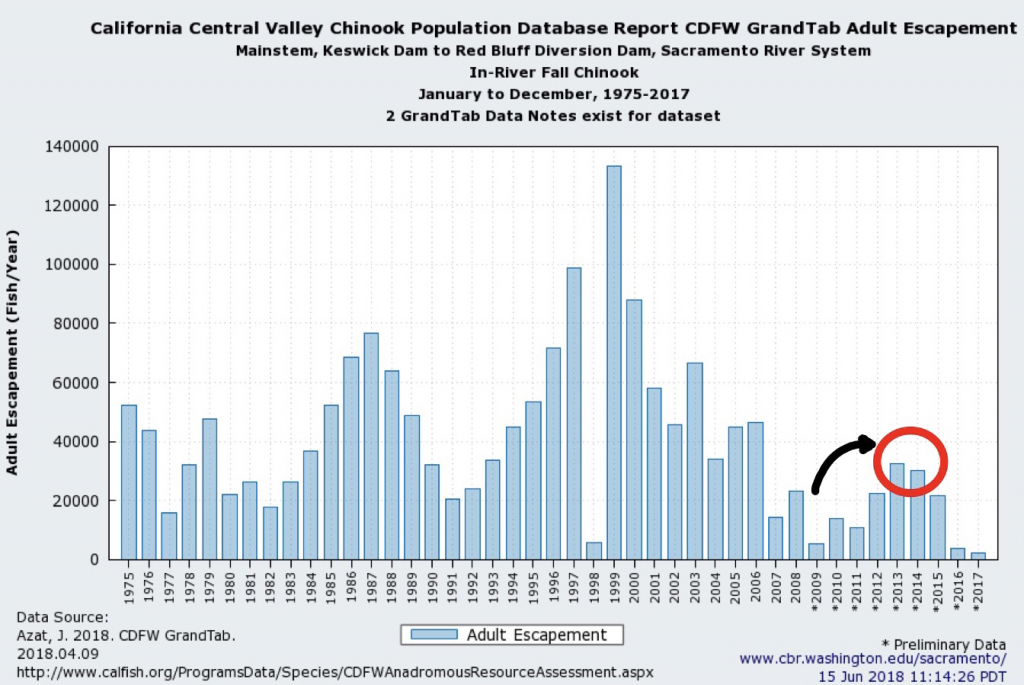
In a March 14 post, I discussed the primary factor in the initial decline of Sacramento River winter-run salmon in the early 1980s (Figure 1) – higher south Delta exports in drier years after the State Water Project came on line in the 1970s. In a January 15, 2017 post, I discussed the causes of the recruitment failures from poor egg survival in spawning grounds in summers of 2014 and 2015. In this post, I suggest that recruitment into the population and long-term population declines stems from fewer spawners (eggs produced) over time and low Sacramento River flows (Shasta Reservoir releases) in fall and winter.
The spawner-recruit relationship (Figure 2) depicts a strong positive effect of the number of spawners on the number of recruits into the population. This is important because mortality reduces the number of spawners and also the subsequent years’ egg production – a double whammy. Without mitigation, the population spirals toward extinction.
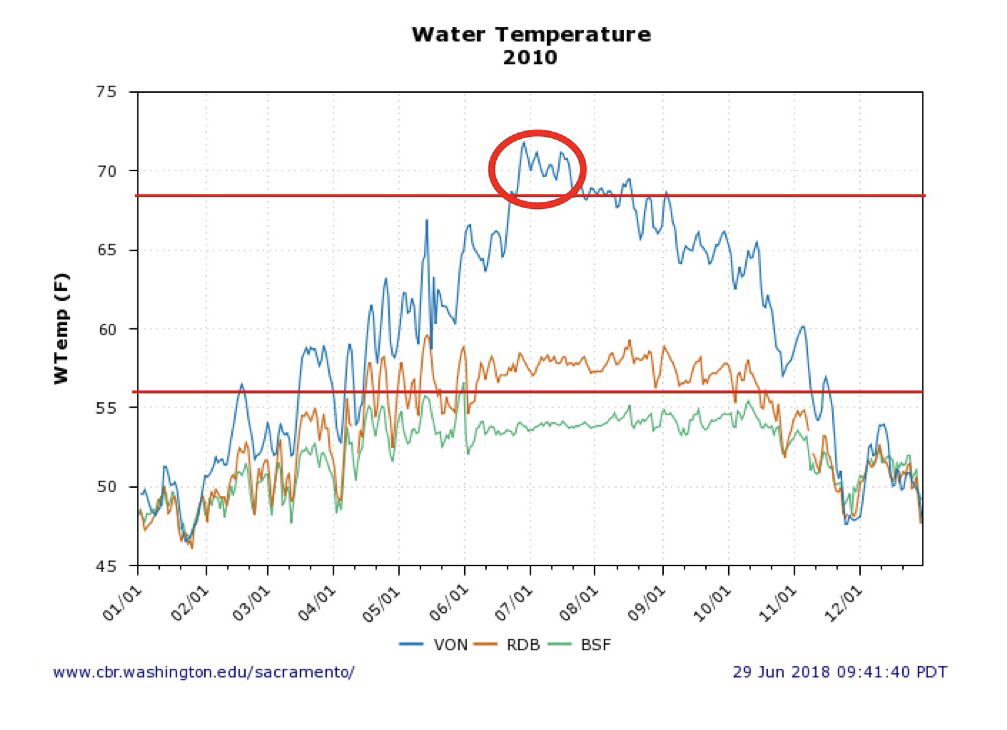
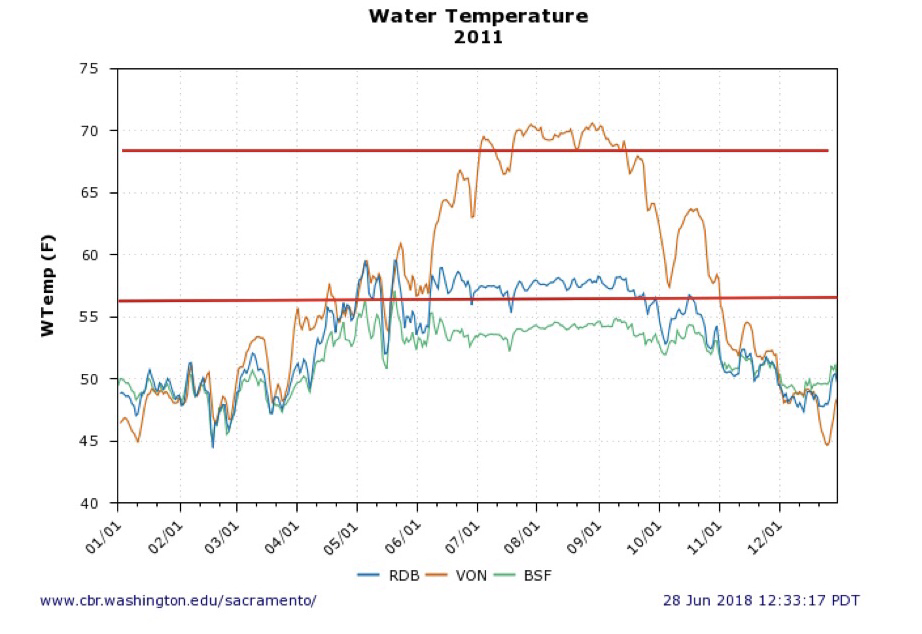
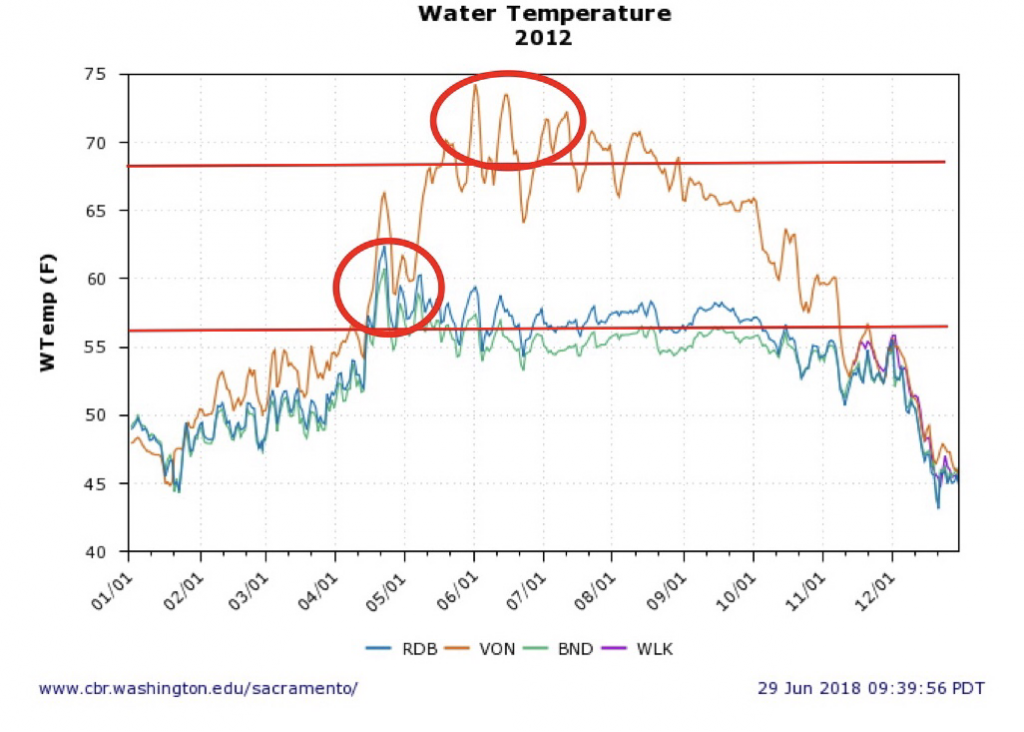
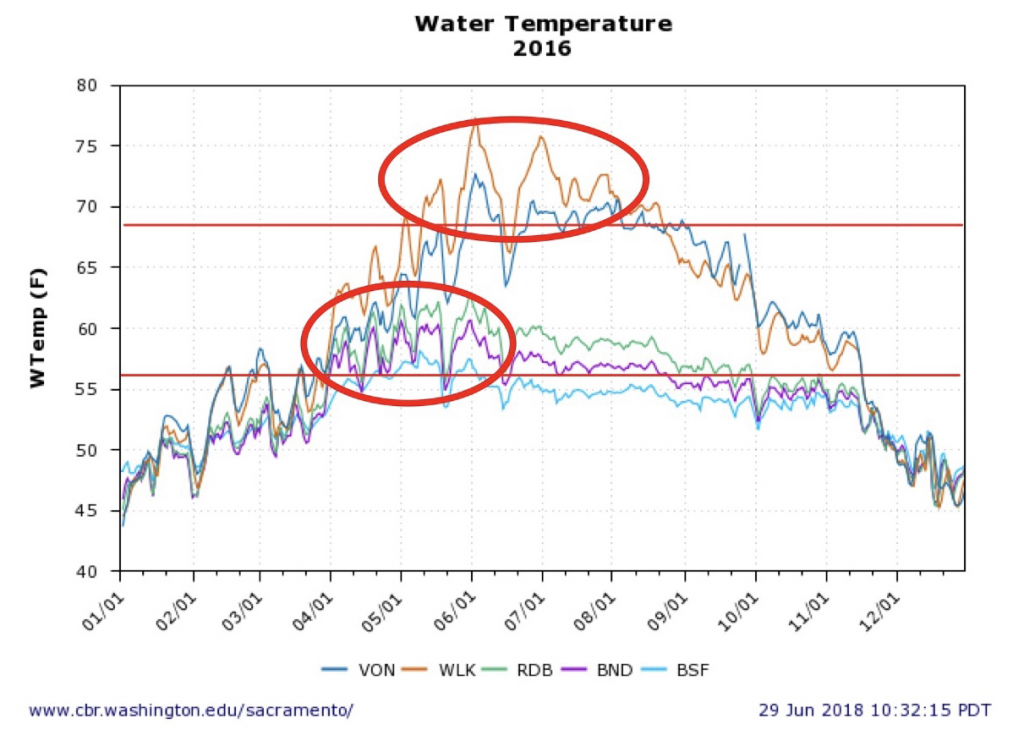
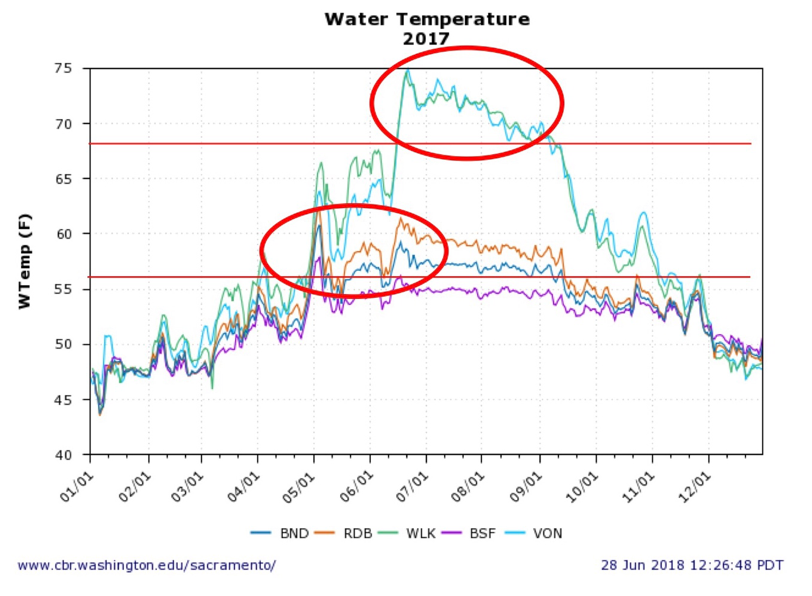
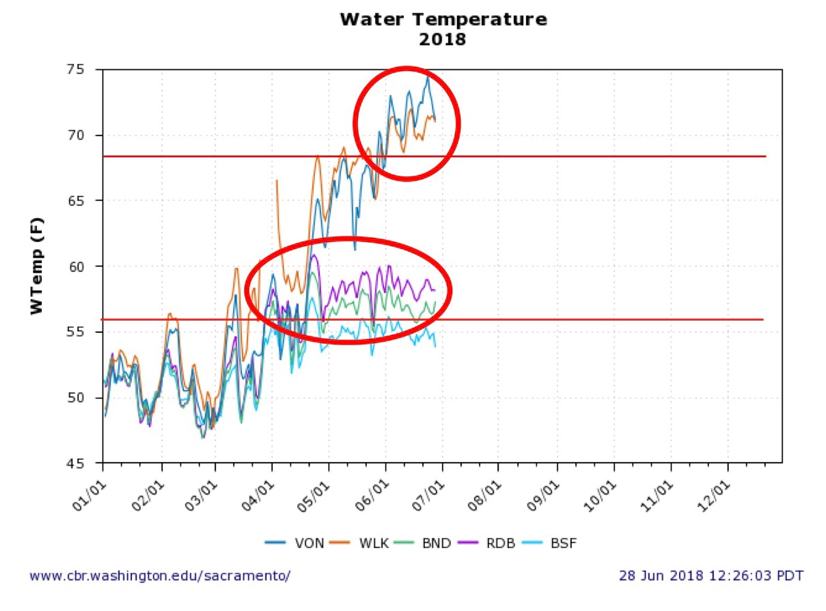
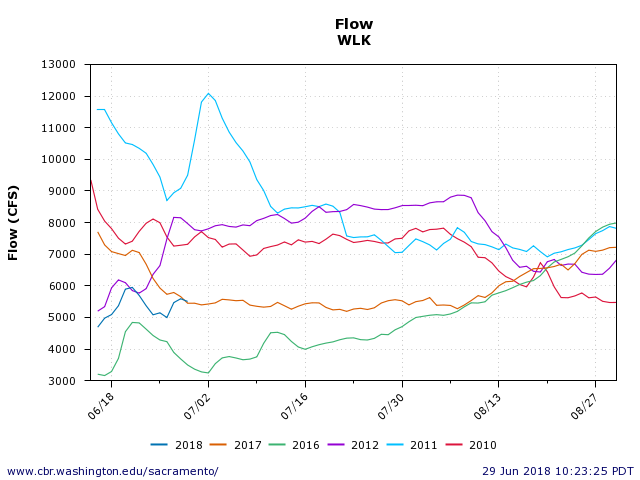
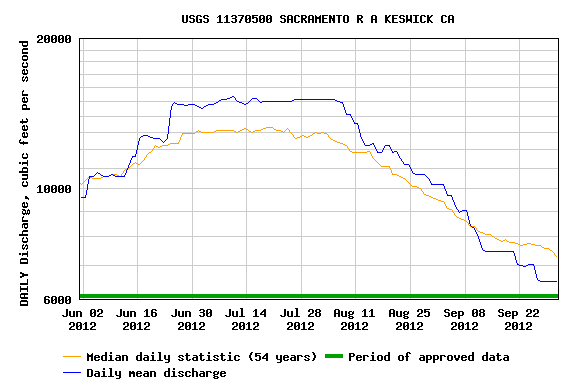
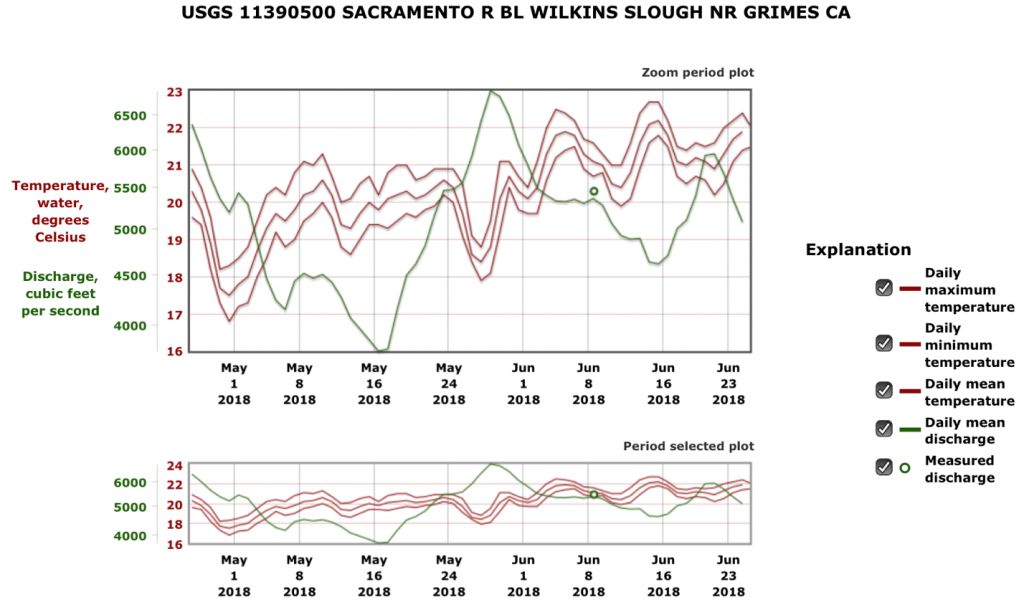
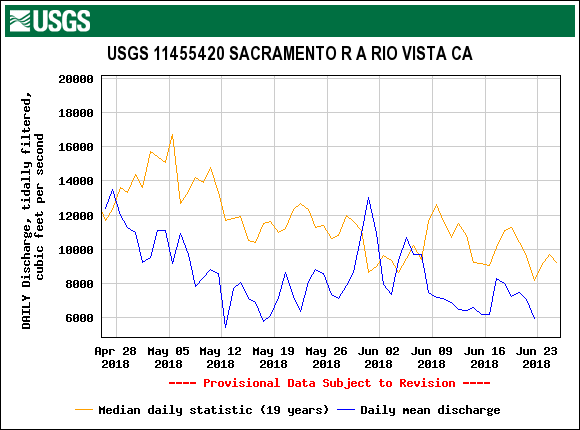
In addition, the relationship suggests that ten times as many salmon are produced in wetter years as in dry years for the same level of spawners. Over the past decade, drier years have lower fall and winter river flows in the upper river spawning and early rearing reach (Figure 3), and lower winter flows in the lower river rearing and migratory reach (Figure 4). The lower fall-winter flows reduce the productive capacity and survival of young salmon in the upper river spawning-rearing reach. The low winter flows in the lower river reduce transport and survival on the way to and through the Delta.
The road to recovery is to build up the number of spawners by providing better flows in fall and winter, and to ensure eggs are sustained by cold-water Shasta Reservoir releases through the summer. Hatchery augmentation helps sustain existing low levels of adult spawners in the population; otherwise the population would decline toward extinction in fewer generations.
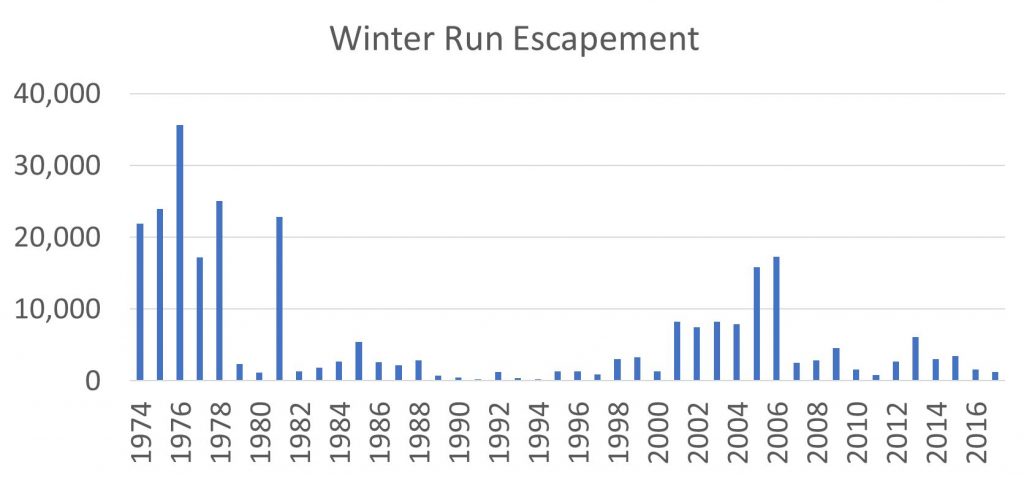
Figure 1. Spawning population estimates of adult winter-run salmon in the upper Sacramento River from 1974 to 2017. Source: CDFW.
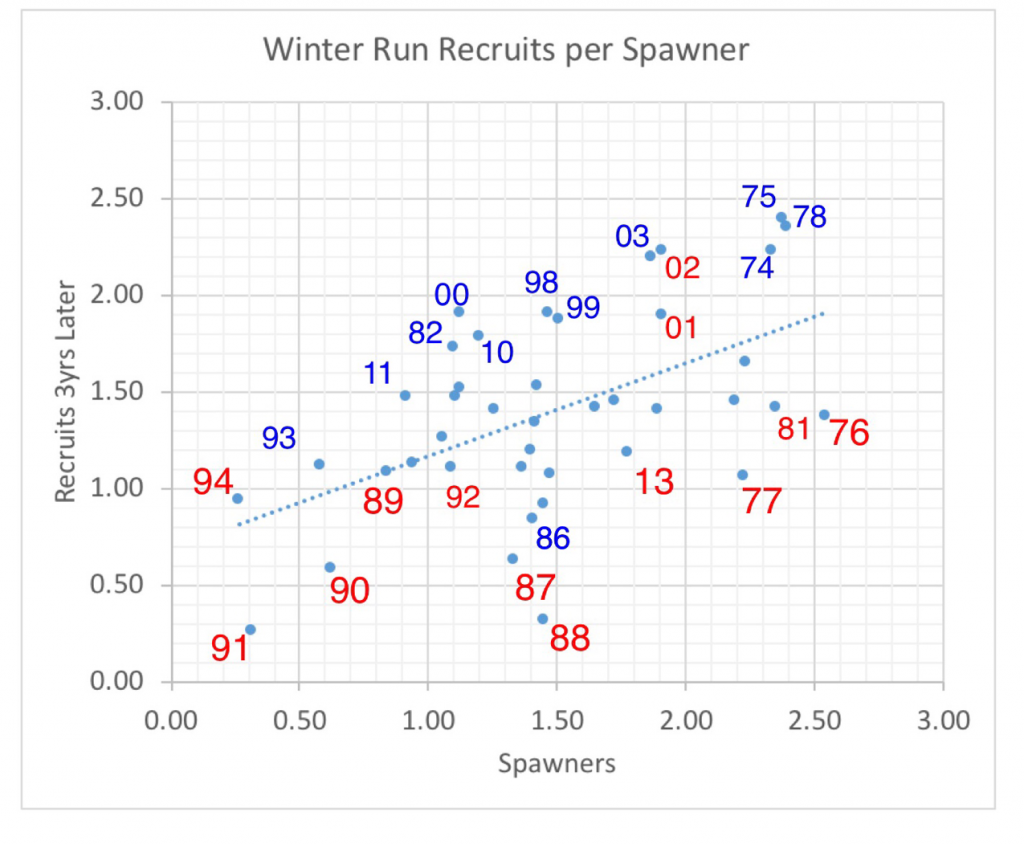
Figure 2. Spawner-recruit (log-log) relationship for the winter-run salmon population in the Sacramento River. The number is the brood year. For example: 1991 depicts the recruits derived from 1991 spawners. Red represents drier years, and blue represents wetter years for the brood year’s first summer and fall. For example: 1991 was a dry year.
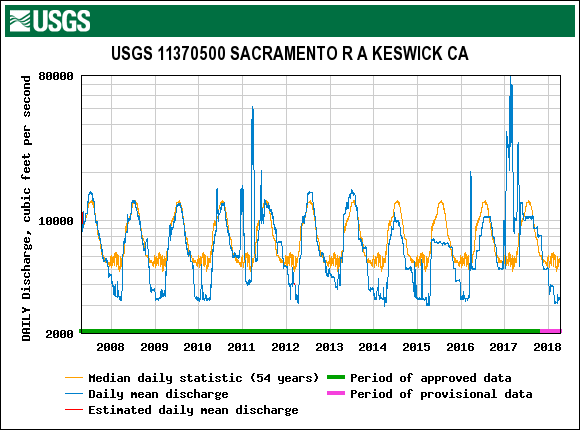
Figure 3. Daily average Sacramento River flow below Keswick Dam, 2007-2018. The 54-year average median daily flow is also shown. Source: USGS.
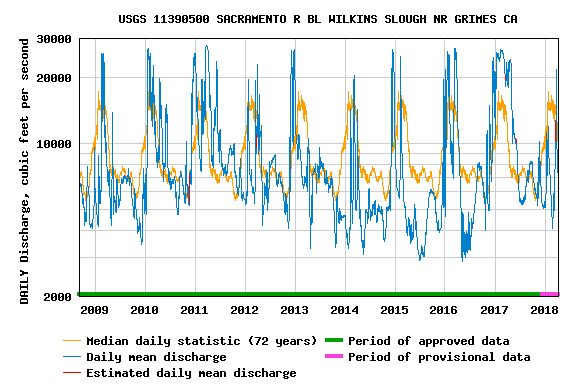
Figure 4. Daily average lower Sacramento River flow at Wilkins Slough, 2008-2018. The 54-year average median daily flow is also shown. Source: USGS.